Page MenuHomePhabricator

Security review of the Performance Inspector
Closed, ResolvedPublic

Description

Project Information

Description of the tool/project

The Performance inspector is an extension to help editors to find potential performance problems on specific articles. The first initial release will help editors to find too large images and potential too many/large modules. It will also setup the a pattern/structure for us to add more performance related information to the user in coming versions (see T117411).

Description of how the tool will be used at WMF

The tool is made for technical power editors to find potential performance problems themselves.

Dependencies

List dependencies, or upstream projects that this project relies on

Has this project been reviewed before?

No.

Working test environment

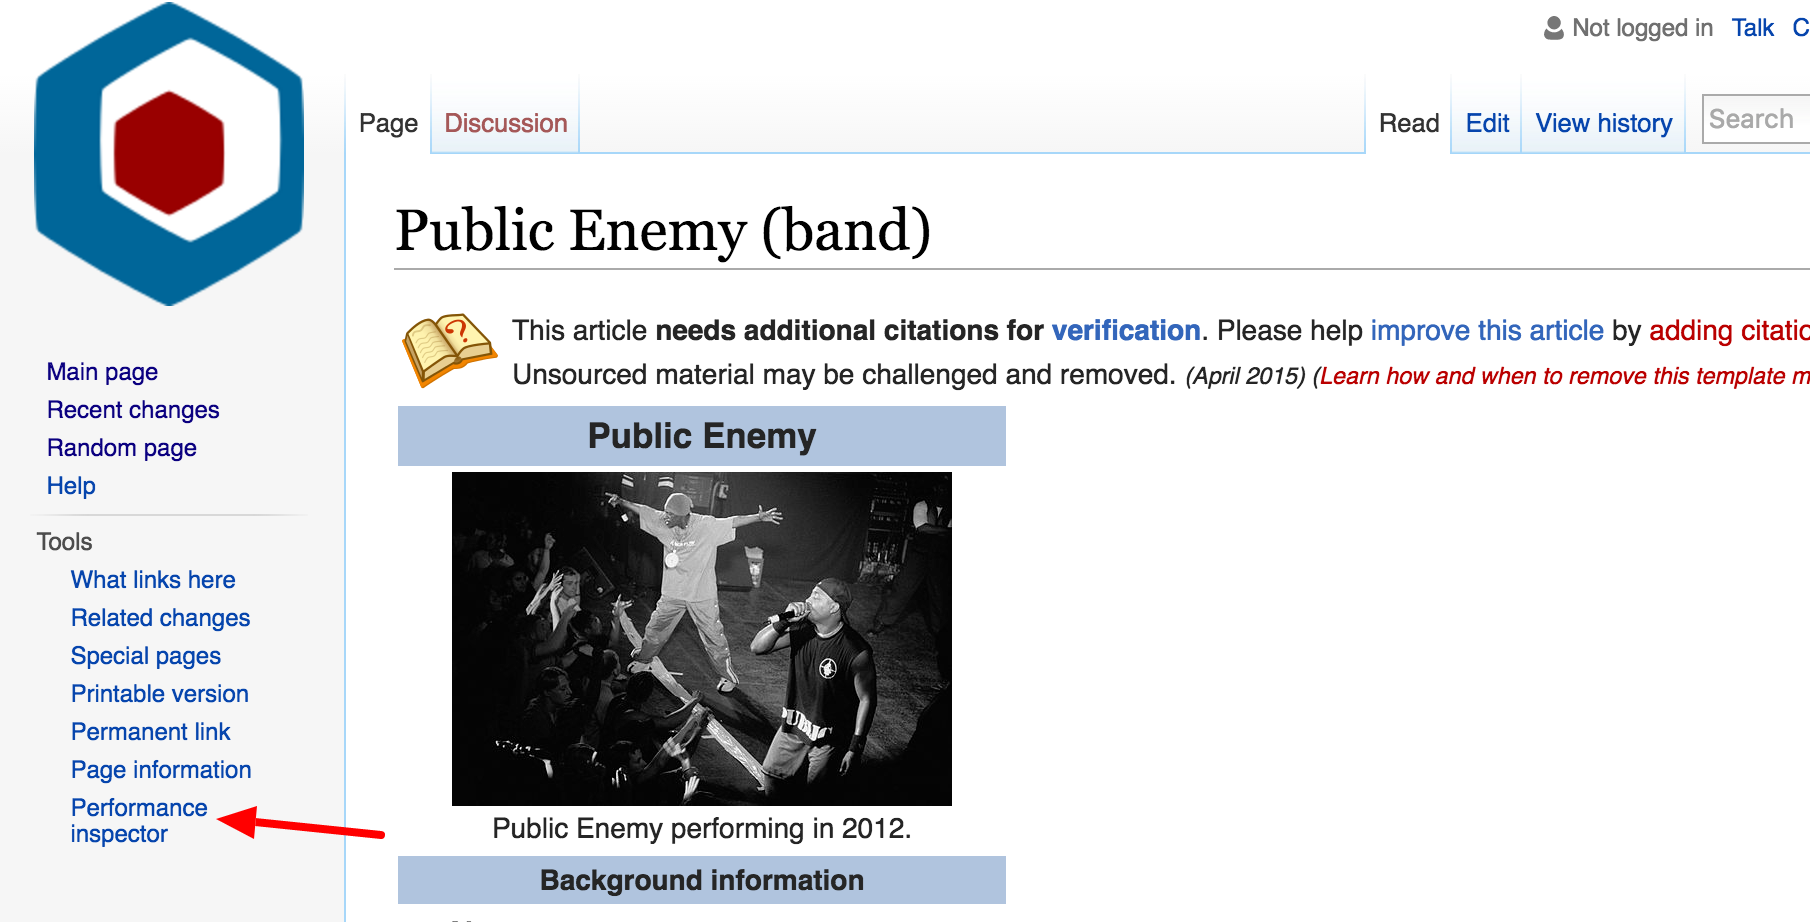
None yet but you can test it using the Vagrant setup you can enable the role performanceinspector: vagrant roles enable performanceinspector

Click in the menu item "Performance Inspector" to activate

perfinspector.png (922×1 px, 397 KB)

Post-deployment

Performance-Team @Peter

Event Timeline

Security review of version 413910ce6d15e (ie HEAD as of august 18)

Overall, this extension looks well done :D

Low severity issues

  • Use of raw html for messages. Most of the messages used in the mustache templates are included as raw html. We are trying to avoid use of raw html messages in new code. Please html escape all messages unless absolutely necessary.

Non-security

This is stuff that jumped out at me when I was looking at the extension but aren't security issues. Most of these things are minor and some are rather nitpicky. This part is just meant to be helpful, but is not part of the security review, so feel free to ignore if you disagree with any of the points.

  • [extension.json] i18n is marked as for the Boilerplate extension. This should be changed, as could mess up localizationCache if another extension used the same name.
  • Lines like: var moduleCollector = function runModuleCollector( data ) { - Is that correct (having a function name and treating it as an anonymous function). I'm not super familiar with the nitty gritty of js, so maybe that does do something, but it seems like having the second name would not do anything (?)
  • The toolbox entry is shown always, but only works when doing a preview of a page (And you have js enabled). Toolbox entry really shouldn't be shown in cases where it wouldn't work, or at least some sort of error should pop-up in cases where it doesn't work.
  • Be nicer it the parser cache section of the report actually parsed the data (e.g. date should be human readable form. Cache expiry should specify the unit is seconds, etc.)
  • The bar-graph should probably have whitespace: nowrap for the module names, otherwise long module names smush into next row.
  • [modulesize collector toHumanSize()] - Note we also already have i18n messages for size units - size-megabytes and friends. Perhaps those should be used for the human readable sizes.
  • Missing message performanceinspector-imagesize-title, performanceinspector-newpp-title messages. (The current mustache template turns them into tags)

Thanks very much @Bawolff!

  • Lines like: var moduleCollector = function runModuleCollector( data ) { - Is that correct (having a function name and treating it as an anonymous function). I'm not super familiar with the nitty gritty of js, so maybe that does do something, but it seems like having the second name would not do anything (?)

It's not a pattern we use very frequently, but it does have a point: the second name means stack traces and other debugging contexts (profiler output, etc.) display a descriptive name, rather than 'anonymous function'.

See https://kangax.github.io/nfe/

Oh cool. Good to know.

Thanks @Bawolff I'll take your non-security input, I'll create a couple of issues for those.

ori claimed this task.
ori reassigned this task from ori to Bawolff.