This is purely to track labs instances hanging with messages about hung tasks in kernel / console log. There is a subtask: T140256 for tools k8s and T141017 for k8s worker nodes. T124133 also has more information.
| Instance | OS | virt host | time | ssh | iowait | io spike | graphite data | nfs | recovery |
| deployment-logstash2 | Jessie | labvirt1010 | 27 jul 09:00Z | no | no | no | no | no | ? |
| tools-merlbot-proxy | Jessie | labvirt1010 | 31 jul 01:00Z | no | yes | regular spikes to 300 (typically 50) | no | yes? | rebooted |
| novaproxy-01 | Jessie | labvirt1001 | 2 Aug ~21:15Z | no | no | no | no | yes | reboot |
| librarybase-reston-01 | Jessie | labvirt1006 | 07 Jul ~0200Z | no | no | no | no | no | reboot |
| tools-grid-master | trusty | labvirt1010 | 2 Aug ~14:00Z | no | yes | no | no | yes | slow and drawn out reboot |
| tools-webgrid-lighttpd-1202 | precise | labvirt1019 | 9 Aug ~05:47Z | no | no | no | no | yes | reboot |
| extdist-01 | jessie | labvirt1009 | Aug 17 10:19:37 (a) | no response | yes | yes (regular, still happening) | yes | no | reboot |
| extdist-02 | jessie | labvirt1010 | Jul 23 03:19:11 (a) | hangs after handshake | no | yes (single) | no | no | reboot |
| tools-mail | precise | labvirt1009 | Aug 19 00:35:01 (a) | hangs after handshake | no (max 1) | yes (jumps to steady 15k) | no | yes | slow reboot |
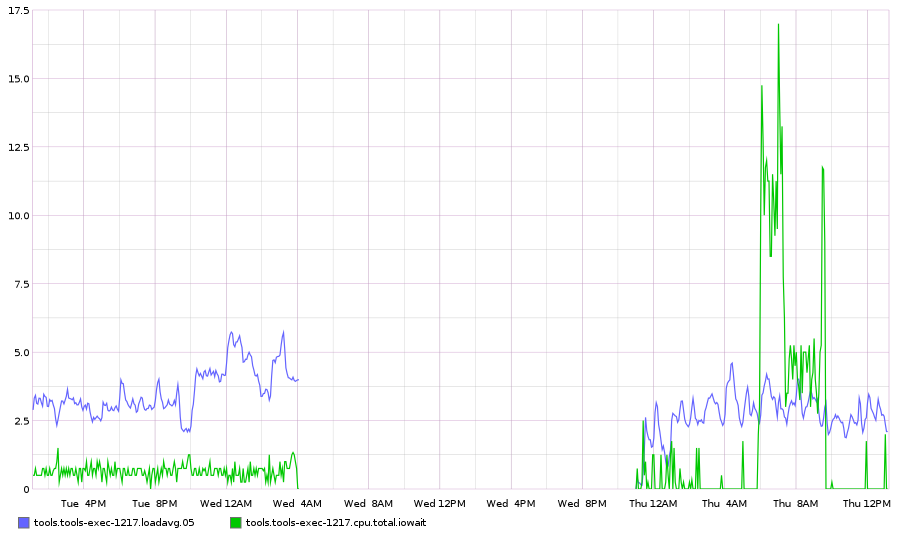
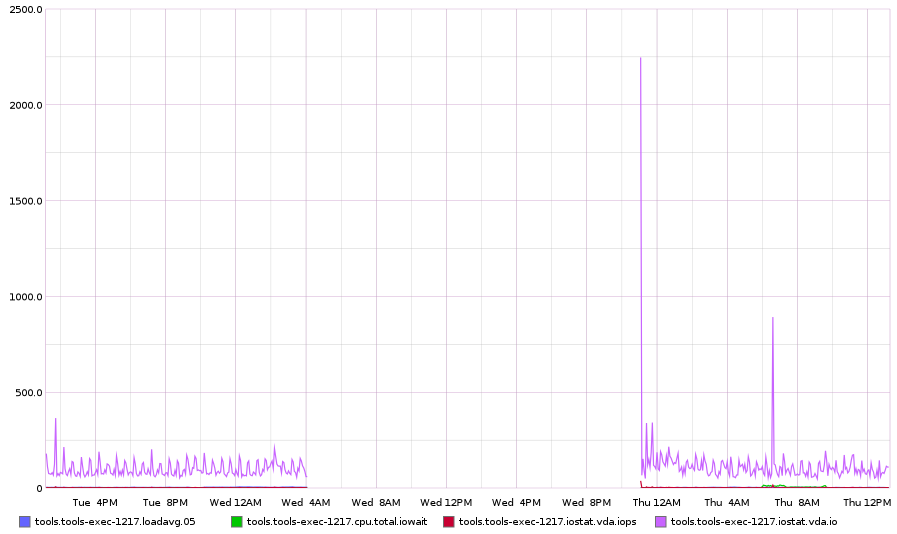
| tools-exec-1217 | precise | labvirt1001 | 24 Aug ~04 AM UTC | nope | nope | no | no | yes | ??? |
(a) last readable entry in /var/log/syslog before reboot
| tools-puppetmaster-01 | jessie | labvirt1001 | Sep 20 13:54:01 | yes | ?? | ?? | ?? | no | reboot |
Legend
Instance: Name of instance
virt host: the virt host the instance is hosted in (you can find this info on wikitech.wikimedia.org/wiki/Nova_Resource:$fqdn)
time: Time at which the host hung
ssh: If you could ssh into it still
iowait: If the host had high iowait (you can find this from https://graphite-labs.wikimedia.org/), e.g. tools.tools-merlbot-proxy.cpu.total.iowait
--> https://graphite-labs.wikimedia.org/render/?width=586&height=308&_salt=1469982906.471&target=tools.tools-merlbot-proxy.cpu.total.iowait
iospike: If the host had io spikes (you can find this from https://graphite-labs.wikimedia.org/), e.g. tools.tools-merlbot-proxy.iostat.vda.io. vdb, ..., might also exist?
--> https://graphite-labs.wikimedia.org/render/?width=586&height=308&_salt=1469983050.092&target=tools.tools-merlbot-proxy.iostat.vda.io
graphite data: If the host is sending graphite data even after it hung
nfs: If the host had NFS mounted