Add alerts for save timing in frontend and backend (median and p75).
Description
Details
| Subject | Repo | Branch | Lines +/- | |
|---|---|---|---|---|
| Add Save Timing alerts to Icinga | operations/puppet | production | +4 -0 |
| Status | Subtype | Assigned | Task | ||
|---|---|---|---|---|---|
| Resolved | akosiaris | T140942 Tracking: Monitoring and alerts for "business" metrics | |||
| Resolved | • Gilles | T153166 Set up Grafana alerts for Web Performance metrics | |||
| Resolved | aaron | T153170 Grafana alerts for save timing |
Event Timeline
I've did a version https://grafana.wikimedia.org/dashboard/db/save-timing-alerts?orgId=1 following the same pattern as for navigation timings. Let us use this one @aaron as a start and then we can tune and make it better.
Change 356449 had a related patch set uploaded (by Phedenskog; owner: Phedenskog):
[operations/puppet@production] Add Save Timing alerts to Icinga
Let me re-do the current version tomorrow: doing % as navigation timing/wpt is probably not the best. I think we can do hard limits (at least for backend time).
Hmm had a look now and it isn't super clear. @aaron need your input what could be a good limit.
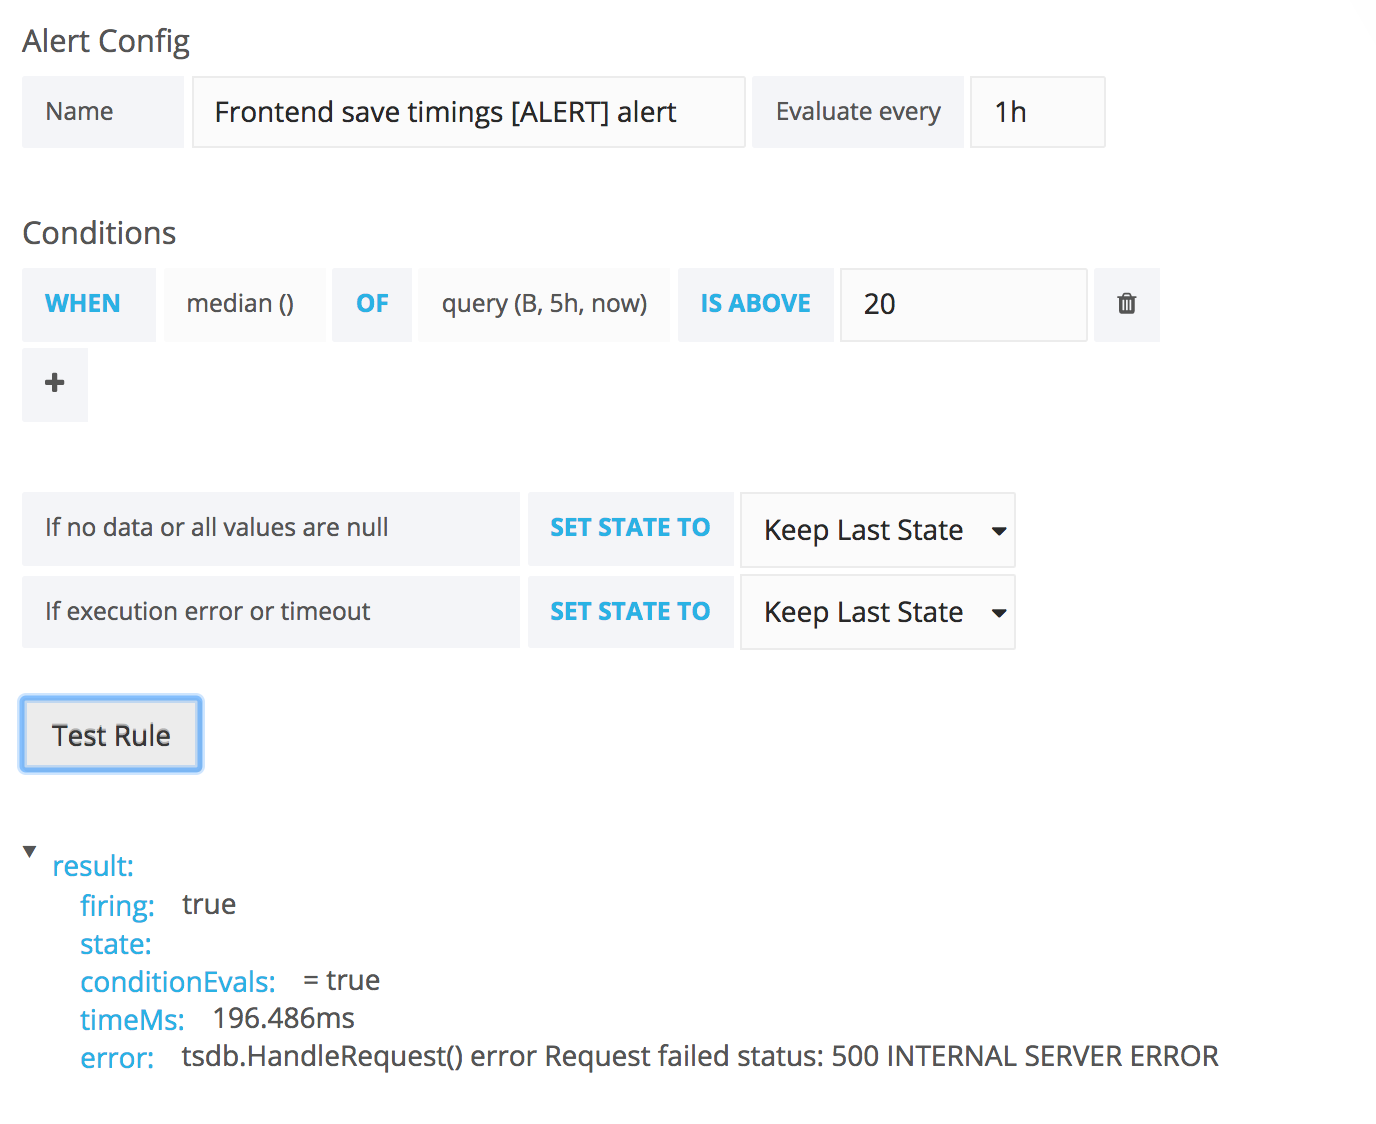
The alerts for save timings isn't working right now when I try to fire them manually:
I think the dashboard is ok now (need @aaron feedback on what kind of limits we should have):
The problem that needs to be fixed is find out why the alerts get a 500. It "only" happen when the alert is fired for the query that do the diff and in % (that works for navtimings/wpt alerts). If I change for just alerting on the default query without diff/% it works fine.
A quick google search points out this https://github.com/grafana/grafana/issues/7061. Looks like the same issue but no reply yet from devs, just reporters
Yes, there's a couple of reports that looks something the same but not answer or just the issue have been closed. I changed the queries, it is something with combo of diffSeries and asPercent that make the backend fail. The current version (where alert works) just divideSeries and adds an offset so we can see the change in percent. This works, it is just a matter of finding good trigger values, need your help there @aaron !
FYI @aaron I've set the limits really hight now for the alerts so we can set it up in icinga and then you can think about what is a reasonable limit.
Change 356449 merged by Alexandros Kosiaris:
[operations/puppet@production] Add Save Timing alerts to Icinga
I'll have to adjust the moving average window. It will likely need to be much larger to avoid noise alerts (and to be able to lower the threshold).
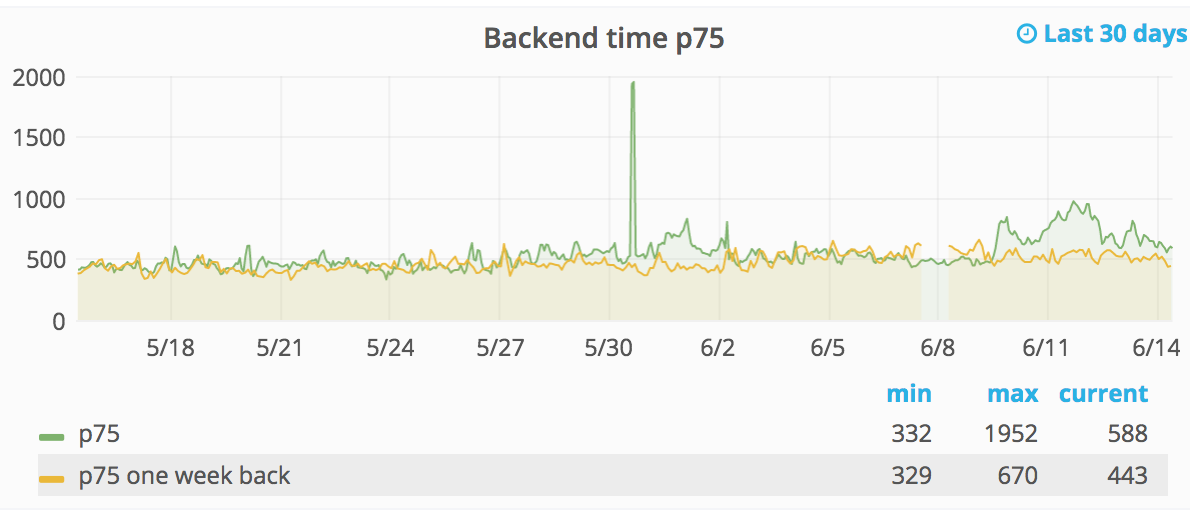
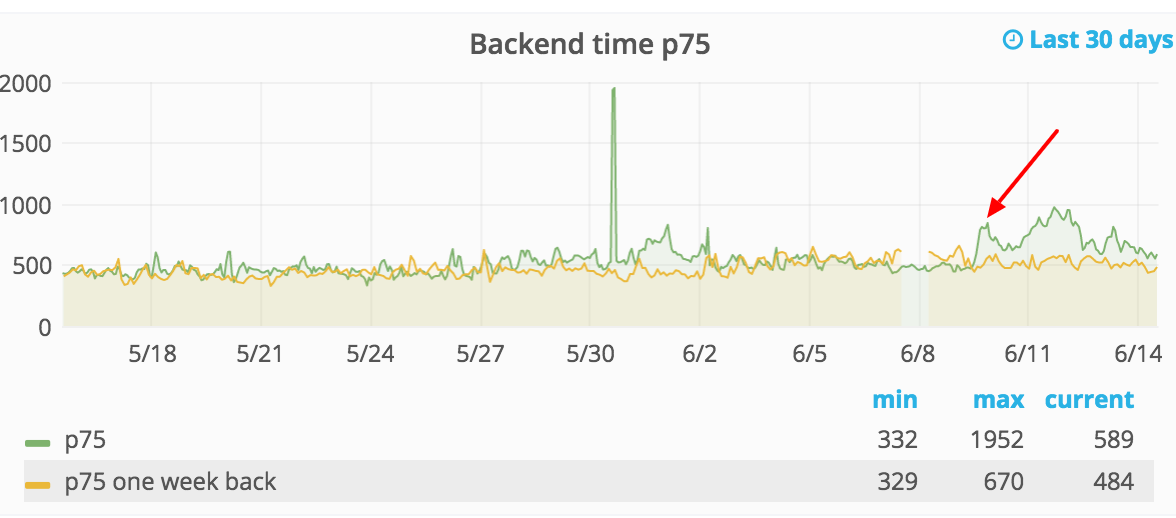
There's a significant spike that started on June 9th (mostly seen on backend) and the alerts haven't caught it.
I think that is my fault. The alerts is set to 50% but it should be 0.50 (you can see the values when you test fire the alerts). I'll change that.
Fixed now. The problem from the beginning is #3306827 that we can't use the same as the other alerts.
I've changed now so the right graphs show the latest 30d (as the other graphs) so it is hopefully easier to spot regressions:
Can we close this now?
No, we should decrease the alerts, for some we have a 50% limit. I've changed the two for backend timing to 20% that seems more reasonable.
Is the alert that just happened due to the recovery improvement? Seems like backend save timing went back down significantly, almost to its levels before June 9th
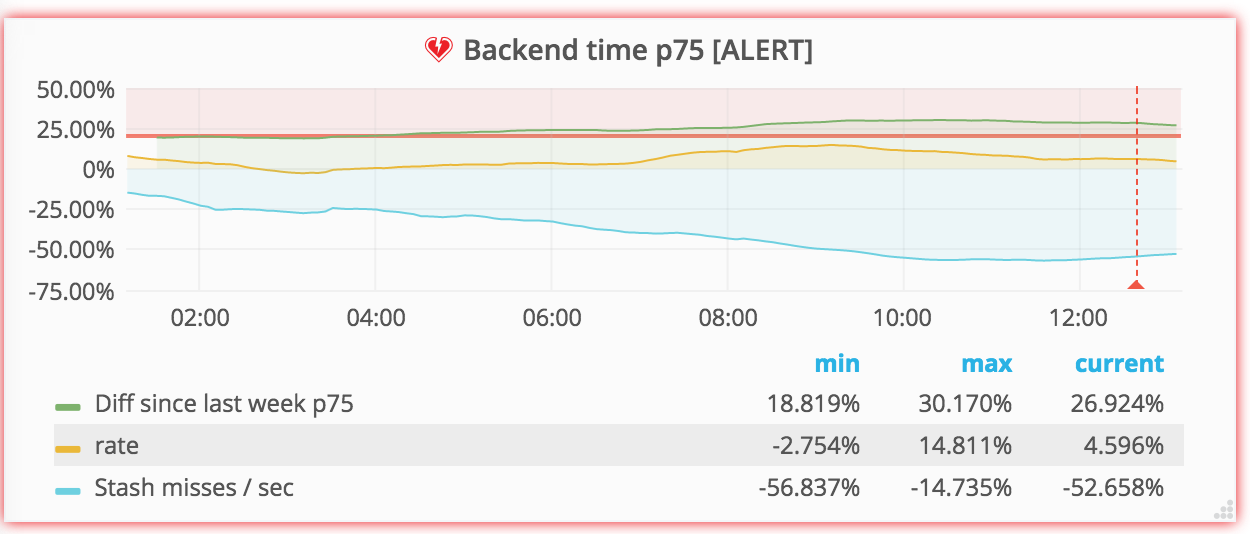
No it's because I changed the limit from 50% to 20%:
So that should have fired a lot earlier if we would have configured it better:
Should we increase the limit, hmm.
Reopening as the alert is going off again:
Status Information: CRITICAL: https://grafana.wikimedia.org/dashboard/db/save-timing-alerts is alerting: Backend time p75 [ALERT] alert.
Yeah, according to #wikimedia-perf-bots (and my icinga inbox) it's been flapping back and forth between CRITICAL/RECOVERY lots of times over the past days.
This is because it's probably too sensitive at this point. The data we are measuring is backend processing time for saving edits, which naturally varies a lot depending on the wiki in question (config, and installed extensions) as well as the edit itself (large submission/small submission, lots of templates or not so much etc.). Given about 500 edits per minute, the median isn't gonna be stable to <100ms as the data set will vary from one minute to another.
When the backend-timing p75 was closer to 800-900, 20% wasn't too sensitive but with it being 400-600ms, it's probably too sensitive (± 80ms vs ± 180ms).
For the time being, I've raised the backend-save-timing alert back to 0.5 (50%). Having said that, despite the recent flapping, even with 50%, there is definitely also a "real" regression going on right now, which is worth investigating.
Closing this task, as it was about setting up these alerts, which was done. Filed T172447 about this regression.
