Onboarding New Developers program.
- Define them.
- Implement them.
Note: Demographics already lists some items.
| Aklapper | |
| Mar 14 2017, 4:24 PM |
| F8460375: Screenshot from 2017-06-14 20-25-49.png | |
| Jun 14 2017, 6:30 PM |
Onboarding New Developers program.
Note: Demographics already lists some items.
| Status | Subtype | Assigned | Task | ||
|---|---|---|---|---|---|
| Resolved | Qgil | T153007 Technical Collaboration annual plan FY2017-18 | |||
| Resolved | Keegan | T131689 Second iteration of the Technical Collaboration strategy | |||
| Resolved | Qgil | T132499 Review KPIs, workflows, and scorecards of the Technical Collaboration team | |||
| Resolved | Aklapper | T160430 Have statistics which allow measuring success of a potential "Onboarding new developers" program | |||
| Resolved | Lcanasdiaz | T151161 Have "Last Attracted Developers" information for Gerrit automatically updated / Integrate new demography panels in GrimoireLab product |
We likely want to get T151161: Have "Last Attracted Developers" information for Gerrit automatically updated / Integrate new demography panels in GrimoireLab product fixed for this task.
The Git-Demographics dashboard currently has an "Attracted developers" widget showing new contributors per month who wrote changes merged into Wikimedia Git (not: Gerrit). Via one-click filtering on the "Top Repositories" widget or manual filtering in Advanced filter field, one can see the stats for specific Wikimedia Git repositories.
I am pretty clueless how we could measure any activity things outside of Wikimedia Git/Gerrit. See for example T132499#3110951.
Just a note to myself:
Quim mentioned "Do we know which Phabricator accounts are also active in Differential (if we ever kill Gerrit)?"
Answer: We neither have Differential stats in wikimedia.biterg.io nor does our monthly email to wikitech-l@ cover this: "Active users" in that email only checks entries in the maniphest_transaction table. Phabricator has a differential_transaction table in the phabricator_differential database (just checked) which also has a authorPHID field (SHOW COLUMNS is your friend).
T132499: Review KPIs, workflows, and scorecards of the Technical Collaboration team proposes:
(*) Recommended projects may include not only those going through Gerrit/Differential, but also Labs tools, bots, gadgets, Lua modules, and GitHub hosted.
Is this a good list? Anything missing? Anything that should be removed or changed? What can we have in place by July 1st?
It is clear that we need a task about creating a selection of software projects for newcomers. I think it is more important to start small with accurate statistics about these selected projects, and then add total Wikimedia stats as we are confident about their accuracy.
OK, here are three metrics from the above list that we could consider our team KPIs:
We can start counting all repositories in Gerrit (last quarter, QoQ, YoY).
@Aklapper, do you agree?
Yes.
- Volunteers contributing code to Wikimedia repositories.
We can check that already nowadays on https://wikimedia.biterg.io as affiliation data is in acceptable shape. What timeframe to compare on?
- New volunteers contributing code to Wikimedia repositories in the last 90 days.
(Means: who made their first contribution in the last 90d.) This should be about Gerrit (uploading code proposals) and not (Git) merged code. Will be possible once T151161 is resolved.
- New volunteers active 1 year after their first contribution.
That is not measurable currently. If we really go for specific people we'd have to find a way to "freeze" that specific subset of new (Gerrit) contributors and recheck/compare a year later.
We can start counting all repositories in Gerrit (last quarter, QoQ, YoY).
OK, since we agree on the principles, let's nail down the implementation:
How many unique independent users have uploaded code contributions to Gerrit. This can be new changesets or new versions of existing changesets. We need last 90 days, QoQ, YoY. Do you need anything else?
How many unique independent users have uploaded their first code contribution to Gerrit in the last 90 days. We need last 90 days (obviously), QoQ, YoY.
I think we can measure this easily (even if manually, every quarter) with a "Last attracted developers in the last 15 months" table (similar to the ones in "Demographics") filtered to show only independent users, with these columns:
Export to CSV. In a spreadsheet, sort the First Upload column by oldest first, keep those uploading patches 15-12 months ago and discard the rest. Then apply a subtraction between Last and First upload, and check those that are older than one year.
I have created an example spreadsheet to illustrate the point.
With this last one, we also would count last 90 days, QoQ, YoY.
- KPI 2: New volunteers uploading code to Wikimedia repositories in the last 90 days
How many unique independent users have uploaded their first code contribution to Gerrit in the last 90 days. We need last 90 days (obviously), QoQ, YoY.
- KPI 3: New volunteers active 1 year after their first code upload
I think we can measure this easily (even if manually, every quarter) with a "Last attracted developers in the last 15 months" table (similar to the ones in "Demographics") filtered to show only independent users, with these columns:
- Author
- First upload
- Last upload
Export to CSV. In a spreadsheet, sort the First Upload column by oldest first, keep those uploading patches 15-12 months ago and discard the rest. Then apply a subtraction between Last and First upload, and check those that are older than one year.
I have created an example spreadsheet to illustrate the point.
With this last one, we also would count last 90 days, QoQ, YoY.
Thanks for these thoughts!
If we go for tracking specific people (=names),
An attempt to make these titles more digestive
KPI 1: @Qgil: The "Changeset Submitters" widget on https://wikimedia.biterg.io:443/goto/3da7d73ffd88c10d9aed1b37b513ba08 shows the number of Gerrit uploaders with independent or unknown affiliation per month but not per quarter.
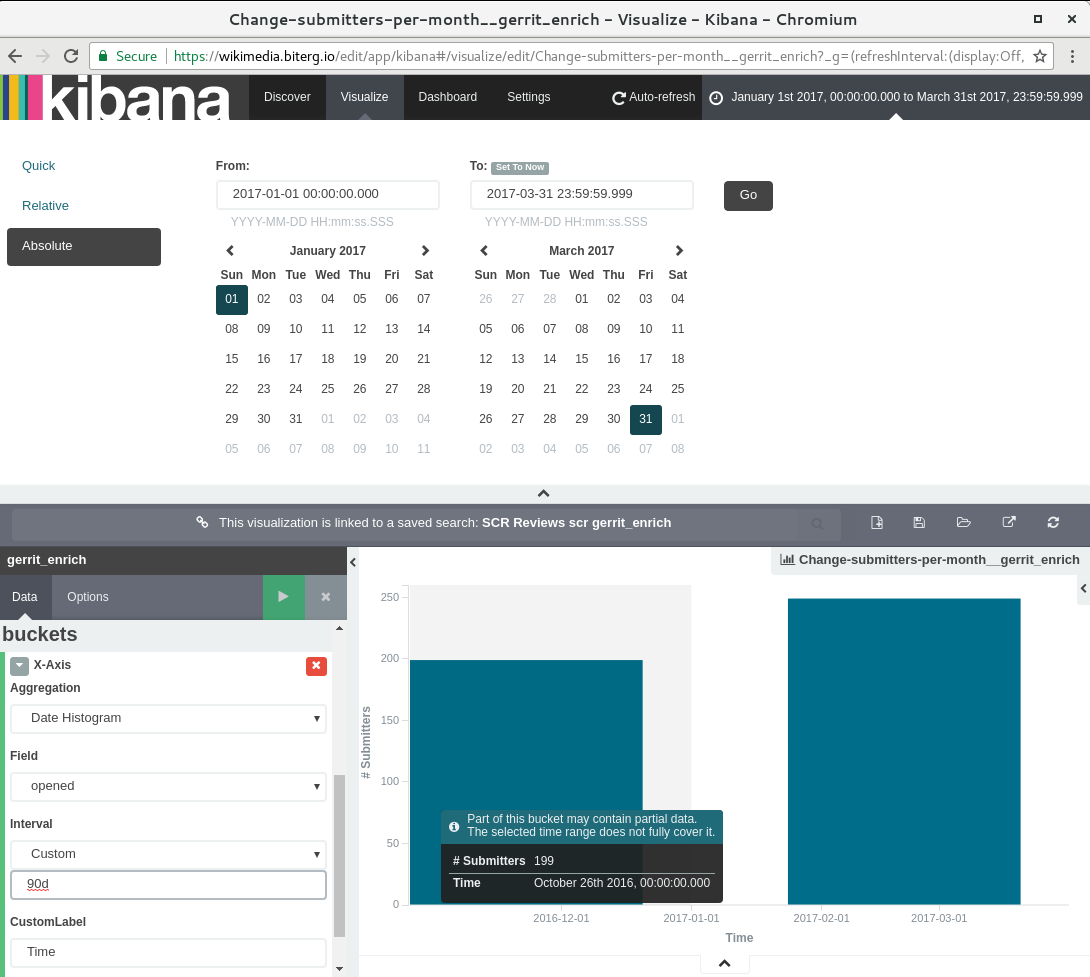
The "Interval" option in the non-public admin section offers no "Quarterly" option, and quarters do not always have the same amount of days either. An admin could create a similar widget with the (time) "Interval" field set to a "Custom" value like "91d" && setting an "absolute" timeframe (e.g. from March1 to May31) in the upper right corner, but that would require manual intervention every time (as 91d is not static). Or asking Bitergia to introduce a "Quarterly" Interval option. Any opinion?
KPI 2 and KPI 3 are still blocked on T151161.
Correction: I am wrong. When setting 90d and the timeframe 2017-01-01 00:00:00.000 to 2017-03-31 23:59:59.999 I do not get one single bucket value which covers exactly that timeframe, but two which both partially cover the timeframe. Meh. So not an option to get one single value for an entire quarter.
Sorry, the link format breaks markdown, but the link works nevertheless.
It is introeuced manually, true, but it is done once every quarter, four times a year. If the number is correct, the manual query looks doable. :)
Ah, these "147 submitters" is everybody, and the KPI is about "independent users". So I am wrong, and I will wait for news. :)
Heh. I did not see the forest for the trees. @Qgil: You are right. Thank you.
To verify, as an admin I changed the size of the "Submitters" panel from 100 to 500 entries (admin link). I went to the Q1/2017 view for Unknown/Independent authors and exported the "Submitters" panel to CSV. It does have 147 entries. Which is the number you posted. (The number of all contributors is 280 for that quarter.) Works.
KPI2: Data added to page on meta, after a hell lot of confusion. (Getting its data source on wikimedia.biterg.io into a stable condition is covered in T151161.)
KPI3:
Notes (on methodology etc):
KPI3:
As finding out for dozens of people when they were active for the last time sounds like a lot of manual work, I was wondering about a different approach instead which does not check for exactly "active after 12 months" but "active after between 12 and 15 months":
$:acko\> comm -12 C_Gerrit_Demo_Table.csv gerrit_top_developers.csv | wc -l
comm: file 2 is not in sorted order
3
$:acko\> more C_Gerrit_Demo_Table.csv | wc -l
61
100÷61×3 = 4.918% so far (Q2 2017 not finished yet), comparing who was first active in the 3 months of Q1 2016 and was also active in the 3 months of Q2 2017.
I don't feel in a good condition to audit this process leading to 4.918% (which is an interesting number). If we are going to use this process, I recommend to check it against a manual count at least once, to see whether we get the same result.
However, if we are going to count retention differently...
Good point. The better we want to count that, the more complicated it gets to count.
IF newDevelopers = users uploading a first patch to Gerrit in the past 3 months
IF lostDevelopers = newDevelopers who have not registered any activity in Gerrit for more than 12 months
THEN retainedDevelopers = newDevelopers with Gerrit activity registered in the past 3-12 months.
ALSO newDevelopers active in Gerrit after 12 months would become oldDevelopers, being removed from the calculation above.
(((Idea: imagine that code review would count as an activity for retention too, not only patch upload.)))
I don't know how to count this automatically, but I guess there is a way to count that manually.
- Also, someone active in GCI in January 2016 and active in next GCI in January 2017 will not be listed as retained.
According to the definition above, a GCi repeater would not count as retained (more than 12 months since first contribution), but they would still count as oldDeveloper. Fair enough, I would say, since that person is not really a newcomer anymore.
I don't know how to count this automatically, but I guess there is a way to count that manually.
That's what I'd like to avoid: Having to look at every single entity individually & manually. No matter which approach to take there will always be deviations, depending on cohorts (currently: one quarter from >1 year ago as one single chunk) and chosen "time control points" (currently: "after one year span", "compare to last three months").
So I wondered if the "implicit assumption that people are active every quarter" is a statistically relevant problem or rather negligible. The "New Authors" widget data goes back to 2011 (when Gerrit was introduced, hence many early entries are only new to Gerrit but not new to Wikimedia). Taking a random quarter:
I see three options:
OK, the good thing about deadlines is that they force us to make decisions. Since the raw data will be there anyway, we can pick one system, and if we are not happy we can pick a different one later on.
The KPI was
KPI 3: New volunteers active 1 year after their first code upload
Then I propose that we go for the simplest approach:
From the new volunteers who uploaded their first patch during Quarter A in Year B, how many did upload a patch during Quarter A in Year B+1.
For instance, in the next quarterly check-in in a couple of weeks:
From the new volunteers during April-June 2016, which percentage has been active in April June 2017.
All the better if the YoY values corresponding to previous quarters are there as well, in order to see whether there is a possible trend.
What do you think?
Cool with me.
For clarification, that means we will not measure "activity >=12 months after", but measure activity in a timeframe within 9 and 15 months. Which turns "New volunteers active 1 year after their first code upload" into "New volunteers active on average 1 year (±3months) after their first code upload". Just saying.
Data:
Data added (diff) to https://meta.wikimedia.org/wiki/Technical_Collaboration/Metrics#Onboarding_New_Developers
(Clueless question: Is the QoQ/MoM the absolute difference between two percentage values (e.g. 3.77% retention in 2016Q4, 4.92% retention in 2017Q1, hence "+1.15%") or the relative difference (e.g. 4.92% is "+30.50%" more than 3.77%)? I strongly assumed the latter in my on-wiki edit.)
Yes. :)
Data:
OK, so it looks like we have a relatively stable trend around ~5% a year after. Since the Wikimedia Hackathon 2017 we are talking about a goal of 10% retention. It looks like the challenge is served. :)
(Clueless question: Is the QoQ/MoM the absolute difference between two percentage values (e.g. 3.77% retention in 2016Q4, 4.92% retention in 2017Q1, hence "+1.15%") or the relative difference (e.g. 4.92% is "+30.50%" more than 3.77%)? I strongly assumed the latter in my on-wiki edit.)
After checking the first seriously looking page I found in the Internet, the correct answer in your example seems to be the latter indeed, +30.50%.
Took a while to grasp... but quite interesting stuff and so well documented!
Questions/comments about KPI3:
We check if a volunteer who uploaded their first patch during Quarter A in Year B also uploaded a patch during Quarter A in Year B+1. First patch could have happened at first day of quarter A in year B and last patch at last day of quarter A in year B+1 (means: ~15 months difference) or other way round (~9 months difference). So people who have been active for exactly 12 months are always included in results.
In any case, I'm wondering if we want to also see "New volunteers active for one year after their first contribution" and what is their activity pattern like. Meaning compare numbers of a quarter with the three subsequent ones. Could be useful in the context of T167085.
I interpret that as "New volunteers active at least once in each of the three calendar quarters after the quarter of their first contribution".
That could already be calculated by performing several iterations of the steps outlined in T160430#3383647 - basically: comm -12 NewDevelopersQuarter1.csv AllDevelopersQuarter2.csv > WhoWeRetainedInQuarter2.csv, then comm -12 WhoWeRetainedInQuarter2.csv AllDevelopersQuarter3.csv > WhoWeRetainedInQuarter3.csv and so on and so on.
- Might be this a very superficial point but I'm wondering -- when we say retained and active, what do we mean? If someone made a one line commit after a year, would that imply retention?
Yes. :)
Is there anything missing in this task? Since it is a team goal, a summary in the description is welcomed.
Been wondering myself. :)
https://meta.wikimedia.org/w/index.php?title=Technical_Collaboration/Metrics&oldid=16967767#Onboarding_New_Developers lists five metrics:
So that last item is blurry to me. Apart from that this task is resolved indeed (thanks for the ping).
Talked to Quim - the KPIs have been defined and they are measurable.
(For some KPIs the actual data is still missing, but that's out of scope for this task.)
Hence closing as resolved.
I'm pretty late here, but just to clarify, the 3 KPIs are the ones listed in T160430#3275660, and it's just about contributing patches, and no measurement on whether those patches were merged or even reviewed?
@Legoktm yes, this is intended. Technical Collaboration's direct responsibility is to recruit and onboard new developers, which is reflected in new patches from new contributors. We have no direct control over code review processes (a lesson that we have learned after a good couple of years trying hard), and therefore we decided to count patches uploaded as opposed to code review review success / patches merged.
Then again, we are co-responsible of code review efficiency together with the related developer teams and volunteer reviewers. We take that efficiency into account when measuring new developer retention. New developers will stay or leave based on many factors, being an important one how satisfied are they about how their patches were handled.
Posting update steps for KPI3 here (as URLs changed and to clarify admin steps in case someone else performs this) for 2017Q3:
$:acko\> comm -12 C_Gerrit_Demo_Table.csv gerrit_top_developers.csv
Mbch331
MGChecker
$:acko\> more C_Gerrit_Demo_Table.csv | wc -l
39
100÷39×2 = 5.128% for Q3 2017, comparing who was first active in the 3 months of Q2 2016 and was also active in the 3 months of Q3 2017.