Page MenuHomePhabricator

some labvirt servers are at full CPU capacity
Closed, ResolvedPublic

Description

I have noticed CI jobs running on integration-slave-docker-1003 to take twice longer than on other instances. The usual suspect is the underlying Compute node being CPU starved.

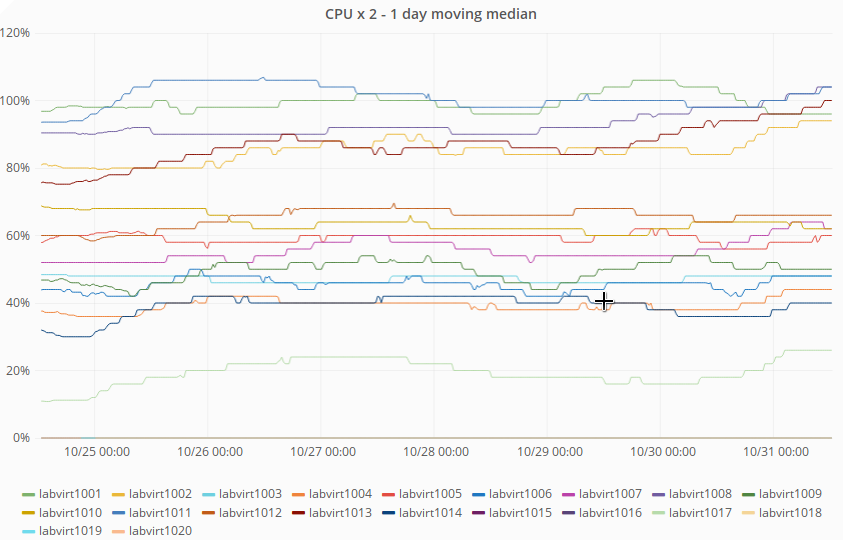
Looking at the https://grafana.wikimedia.org/dashboard/db/labs-capacity-planning?panelId=91&fullscreen&orgId=1 graph of CPU usage (7 days), five of the labvirt have very high CPU usage:

labvirt1001
labvirt1002
labvirt1008
labvirt1011
labvirt1013

labvirt_cpu_usage.png (540×843 px, 79 KB)

NOTE: labvirt have hyperthreading activated, Diamond aggreate the CPU usage and divide that by the total number of CPU including the HT one. The graph multiply the value by two to more or less take in account hyper threading.

Event Timeline

There are a few instances having steal CPU (Kernel reports that the host could not allocate requests CPU time because of other instances) https://grafana-labs.wikimedia.org/dashboard/db/top-instances?panelId=4&fullscreen&orgId=1

Looking at instances CPU usage, there might be a few worth investigating to recover some capacity:

For system usage, there are a few with high usage, probably indicating a process went wild on them:
https://grafana-labs.wikimedia.org/dashboard/db/top-instances?panelId=6&fullscreen&orgId=1

The top ten instances per CPU usage are all tools-webgrid-lighttpd-*. I have no idea what those are for though, maybe that is "normal" behavior though:
https://grafana-labs.wikimedia.org/dashboard/db/top-instances?panelId=5&fullscreen&orgId=1

Thank you @hashar, this is valuable insight. I'm going to mark this to be talked about in our weekly meeting. We have at least a few short term actionables I think here:

  • Some rebalancing may need to happen and it's a very manually process atm
  • We have labvirt1015 that is hopefully going to be pooled
  • We have two new labvirts at the beginning of the order process
  • We may need to reassess our CPU overcommit in the same way we did for RAM

There are a few instances having steal CPU (Kernel reports that the host could not allocate requests CPU time because of other instances) https://grafana-labs.wikimedia.org/dashboard/db/top-instances?panelId=4&fullscreen&orgId=1

Looking at instances CPU usage, there might be a few worth investigating to recover some capacity:

For system usage, there are a few with high usage, probably indicating a process went wild on them:
https://grafana-labs.wikimedia.org/dashboard/db/top-instances?panelId=6&fullscreen&orgId=1

The top ten instances per CPU usage are all tools-webgrid-lighttpd-*. I have no idea what those are for though, maybe that is "normal" behavior though:
https://grafana-labs.wikimedia.org/dashboard/db/top-instances?panelId=5&fullscreen&orgId=1

Most of these links are blank for me, what am I doing wrong?

Most of these links are blank for me, what am I doing wrong?

The graphs take a while to generate :( There should be some gif on the top right indicating it is busy retrieving the data points from graphite.

Top ten instances per steal CPU

InstanceSteal CPU %
extdist-01.extdist.eqiad.wmflabs13%
deployment-ms-fe02.deployment-prep.eqiad.wmflabs9%
ragesossbot.globaleducation.eqiad.wmflabs8%
deployment-changeprop.deployment-prep.eqiad.wmflabs8%
wikistats-kraken.wikistats.eqiad.wmflabs8%
wikistats-cowgirl.wikistats.eqiad.wmflabs8%
deployment-cumin.deployment-prep.eqiad.wmflabs8%
andrew-hiera-test.puppet.eqiad.wmflabs7%
swift-stretch-ms-be02.swift.eqiad.wmflabs7%
wmde-wikidiff2-unpatched.wikidiff2-wmde-dev.eqiad.wmflabs7%

The instances are most probably fine, it is just that the underlying Compute node can't allocate them the CPU slice they are requesting (read: the labvirt is too busy).

https://grafana-labs.wikimedia.org/dashboard/db/top-instances?panelId=5&fullscreen&orgId=1 Top ten instances per user CPU

InstanceUser CPU %
tools-webgrid-lighttpd-1425.tools.eqiad.wmflabs100%
tools-webgrid-lighttpd-1422.tools.eqiad.wmflabs100%
tools-webgrid-lighttpd-1418.tools.eqiad.wmflabs100%
tools-webgrid-lighttpd-1412.tools.eqiad.wmflabs100%
tools-webgrid-lighttpd-1410.tools.eqiad.wmflabs100%
tools-webgrid-lighttpd-1408.tools.eqiad.wmflabs100%
tools-webgrid-lighttpd-1407.tools.eqiad.wmflabs100%
tools-webgrid-lighttpd-1402.tools.eqiad.wmflabs100%
tools-webgrid-lighttpd-1426.tools.eqiad.wmflabs99%
tools-webgrid-lighttpd-1421.tools.eqiad.wmflabs99%

Mentioned in SAL (#wikimedia-releng) [2017-11-03T13:30:00Z] <hashar> Unpool integration-slave-docker-1002 and integration-slave-docker-1003 . They are slow CPU wise, most probably due to the underlying labvirt being CPU starved. - T179378

The single labvirt that is most loaded is labvirt1011. Its hosting a fair amount of Toolforge and Beta Cluster VMs:

$ nova list --host=labvirt1011 --all | grep '^|' | awk '{if(NR>1) print $6, $4}' | sort
deployment-prep deployment-mediawiki04
deployment-prep deployment-mira
deployment-prep deployment-ores-redis-01
deployment-prep deployment-parsoid09
deployment-prep deployment-poolcounter04
deployment-prep deployment-puppetmaster02
deployment-prep deployment-sca04
discourse-wam discourse-wam
etcd etcd04
etcd etcd05
getstarted webservices
hat-imagescalers k8s-test-builder
language language-mleb-stable
mw-extension-ids ids-testing
ores ores-web-05
ores ores-worker-05
pagemigration pagemigration-vagrant
phabricator phab-tin
privpol-captcha captcha-ai-03
privpol-captcha captcha-static-02
privpol-captcha captcha-web-11
reading-web-staging nomad
reading-web-staging reading
recommendation-api tool
scrumbugz test1
social-tools social-tools2
thumbor packaging
toolsbeta toolsbeta-grid-exec-1
toolsbeta toolsbeta-grid-puppetmaster
tools tools-bastion-02
tools tools-docker-registry-02
tools tools-exec-1406
tools tools-exec-1421
tools tools-exec-1436
tools tools-exec-1437
tools tools-static-10
tools tools-webgrid-generic-1404
tools tools-webgrid-lighttpd-1409
tools tools-webgrid-lighttpd-1411
tools tools-webgrid-lighttpd-1418
tools tools-webgrid-lighttpd-1420
tools tools-webgrid-lighttpd-1425
tools tools-worker-1005
tools tools-worker-1011
tools tools-worker-1014
tools tools-worker-1015
tools tools-worker-1017
tools tools-worker-1018
tools tools-worker-1023
tools tools-worker-1025
tools tools-worker-1027
utrs utrs-production
video encoding01
visualeditor visualeditor-test
xtools xtools-dev02

Mentioned in SAL (#wikimedia-releng) [2017-11-06T22:29:29Z] <hashar> killed stuck npm Docker containers on integration-slave-docker-1002 (due to T176747 ). Pooled the instance back, the slowness it experienced is probably not related to labvirt CPU usage ( T179378 )

The Toolforge nodes are generally bunched up a little on certain labvirts. It might be a good idea to rebalance them a bit across the pool:

$ nova list --tenant=tools --fields=OS-EXT-SRV-ATTR:host,name| grep '^|' | awk '{if(NR>1) print $4}' | sort | uniq -c | sort -k2
     13 labvirt1001
     10 labvirt1002
      3 labvirt1003
      9 labvirt1004
     11 labvirt1005
      5 labvirt1006
      4 labvirt1007
      8 labvirt1008
     12 labvirt1009
      7 labvirt1010
     22 labvirt1011
     20 labvirt1012
     18 labvirt1013
      5 labvirt1014
      1 labvirt1017

Point in time snapshot of VM distribution across all labvirts:

$ nova list --all --fields=OS-EXT-SRV-ATTR:host| grep '^|' | awk '{if(NR>1) print $4}' | sort | uniq -c | sort -k2
     19 labvirt1001
     41 labvirt1002
     42 labvirt1003
     51 labvirt1004
     46 labvirt1005
     38 labvirt1006
     44 labvirt1007
     55 labvirt1008
     52 labvirt1009
     55 labvirt1010
     55 labvirt1011
     45 labvirt1012
     61 labvirt1013
     59 labvirt1014
     20 labvirt1015
     50 labvirt1017

Note that labvirt1015 is currently being stress tested for a new CPU (T171473), so the 20 VMs there are temporary. Ignoring those, we have 714 VMs running which works out to 44.6 VMs per labvirt once we repool labvirt1015 (and ignoring actual usage and resource consumption). We should probably take a close look at any labvirt running more VMs than that and see if we can move some off to other nodes. We have a couple more labvirts on order (or nearly on order) that hopefully will help out a bit too when they arrive and join the pool in the coming months. Note that naive allocation by VM count isn't a magic solution however. labvirt1001 has the fewest number of VMs, but also currently has the fourth highest CPU load in the reports.

Mentioned in SAL (#wikimedia-releng) [2017-11-24T08:16:06Z] <hashar> pooling integration-slave-docker-1003 again | T179378

While looking at Grafana for some other unrelated task, I eventually found toolforge has a bunch of process stuck at 100% CPU. Mostly due to tools.jembot. Filled as T182070: tools-webgrid-lighttpd have ~ 90 procs stuck at 100% CPU time (mostly tools.jembot)

Mentioned in SAL (#wikimedia-releng) [2018-02-09T09:48:00Z] <hashar> Deleting integration-slave-docker-1003 and recreating it. It is running on an overloaded labvirt machine. | T179378 T186856

The labvirt have HyperThreading enabled. Instructions from multiple programs ends up multiplexed which provided a speed boost. At the operating system level each CPU is shown as two CPUS. Hence a server having 24 CPU would be reflected as having 48 CPU.

Diamond collects the CPU usage from the system, does a sum and divide it by the number of CPU.

So if you 24 busy process, diamond reports a 50% CPU usage. With hyper threading the server is able to run slightly more programs which is shown whenever the CPU usage goes past 50%. But one sure thing, it would never reach 100% and probably ceil around 70%.

On https://grafana.wikimedia.org/dashboard/db/labs-capacity-planning the CPU guest is thus misleading. A server at 50% CPU is probably overloaded. I have added a graph that multiply the CPU usage per 2 to better reflect the business. A better indicator might be load / physical CPU. Eg a load of 24 on 24 real CPU is fine, but a load of 30 would indicate overloading.

Andrew claimed this task.

I think this is under control now. I've opened T193272 about the misreporting issue.