Page MenuHomePhabricator

[Post-mortem] Kafka Jumbo cluster cannot accept connections
Closed, ResolvedPublic

Description

Incident documentation: https://wikitech.wikimedia.org/wiki/Incident_documentation/20190402-0401KafkaJumbo

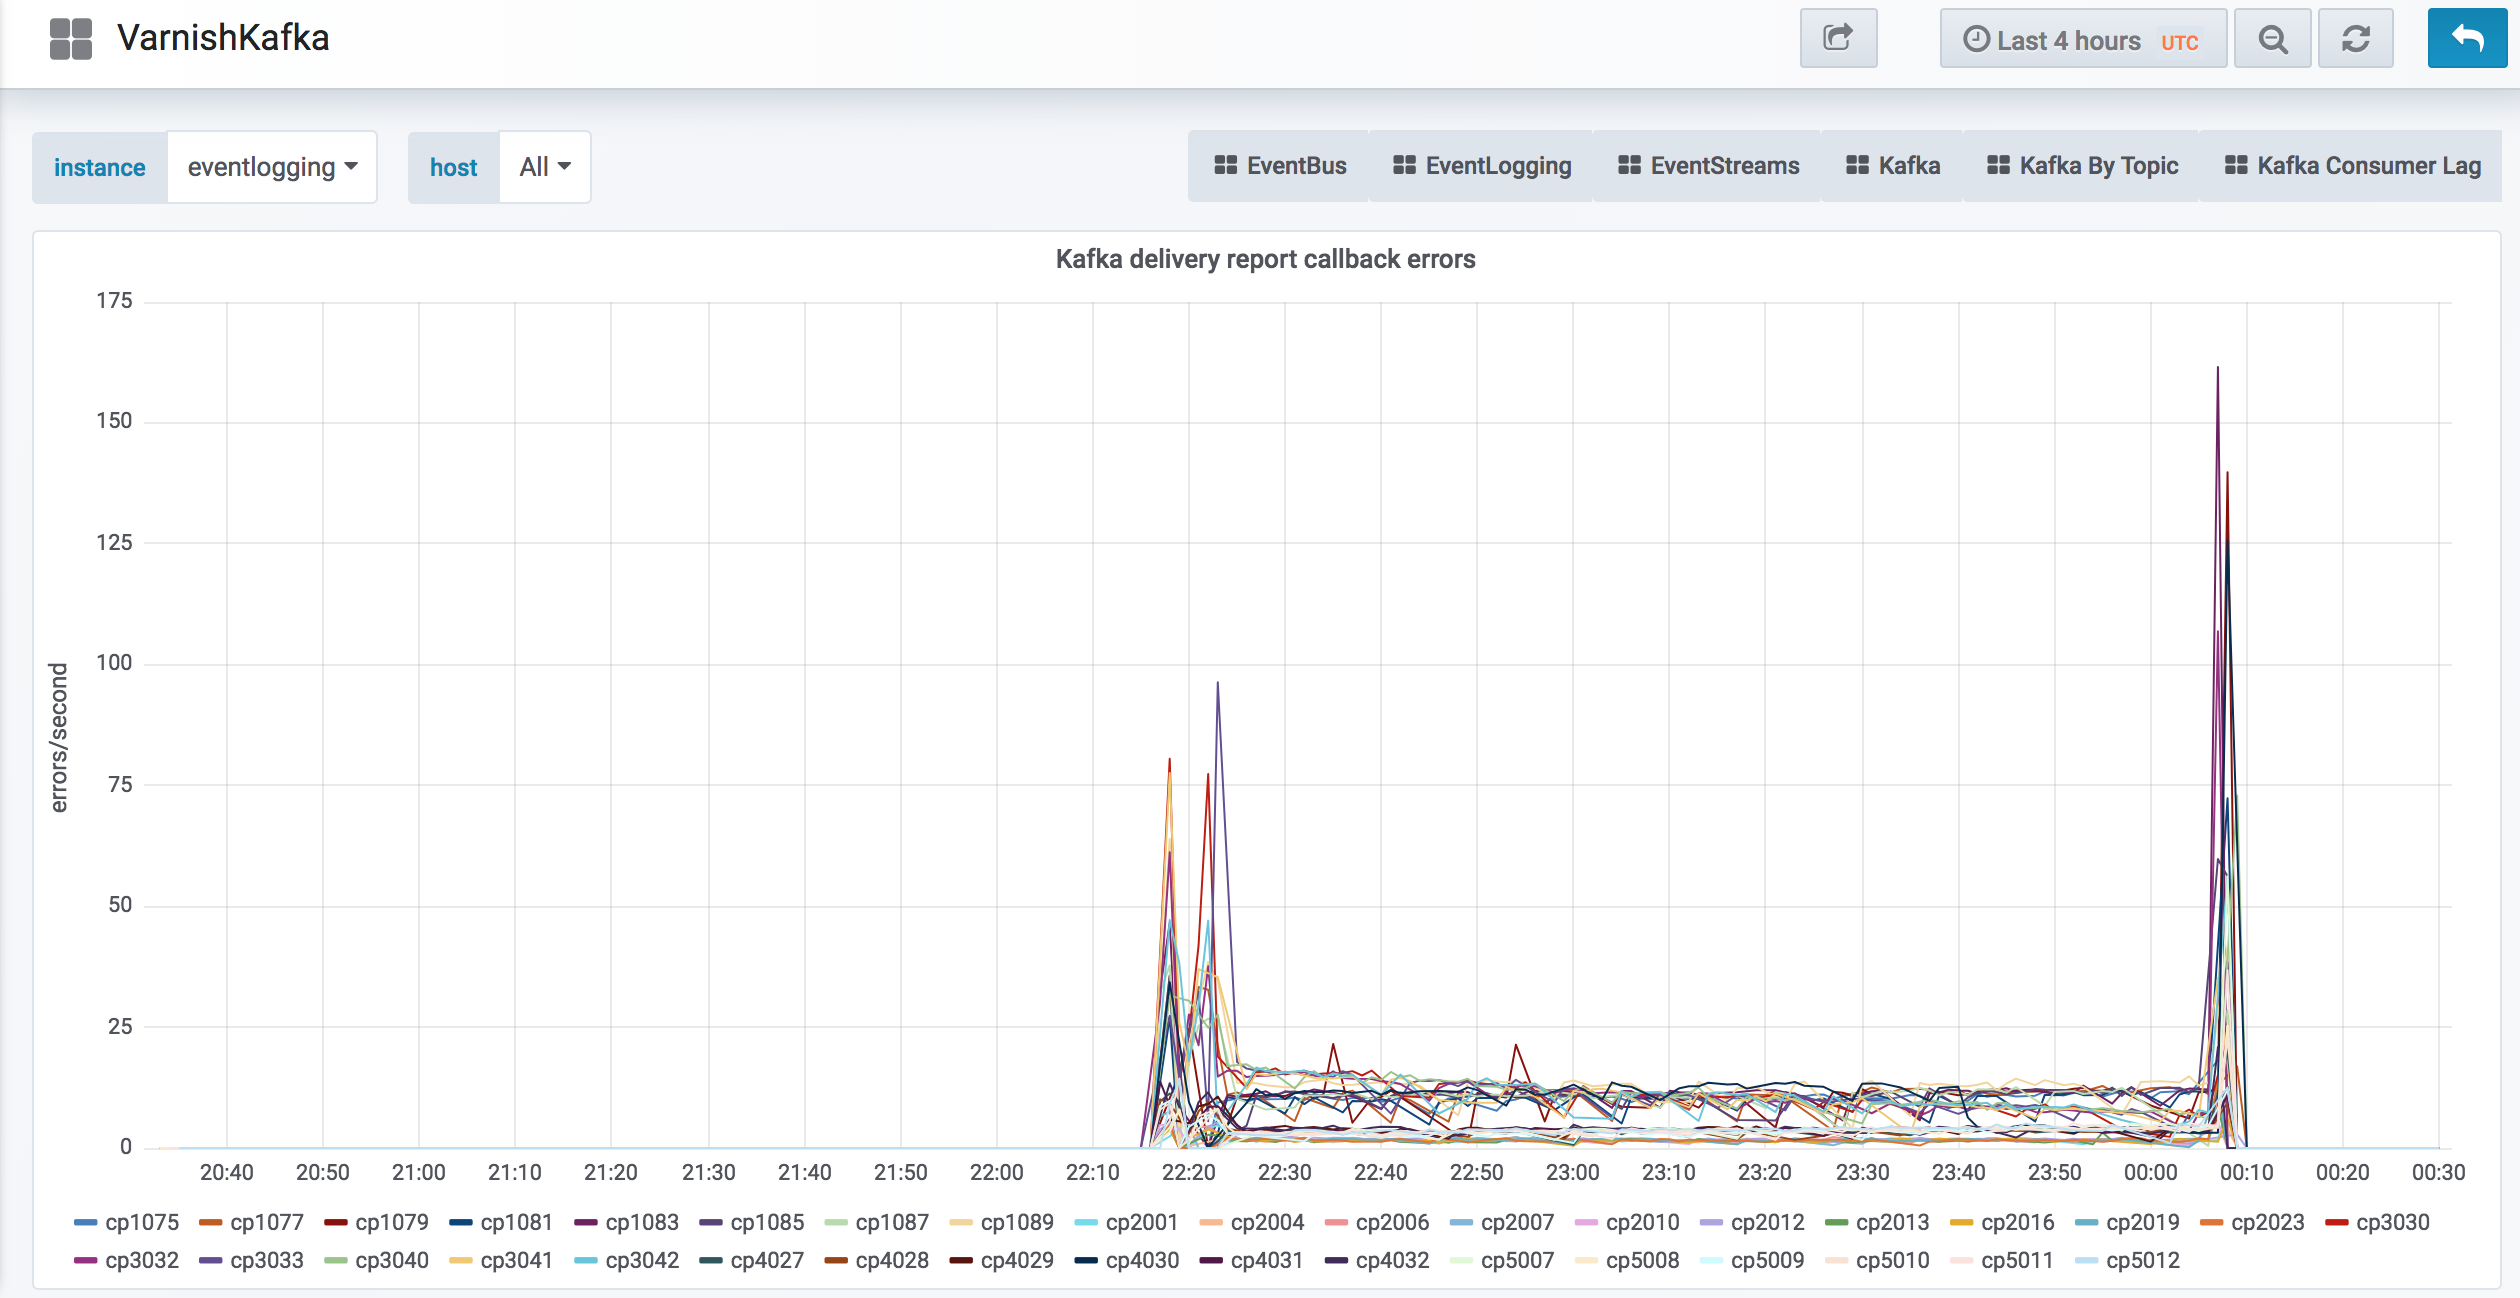
Tons of callback errors on varnishkafka: https://grafana.wikimedia.org/d/000000253/varnishkafka?orgId=1&var-instance=eventlogging&var-host=All&from=1554074545652&to=1554160945652

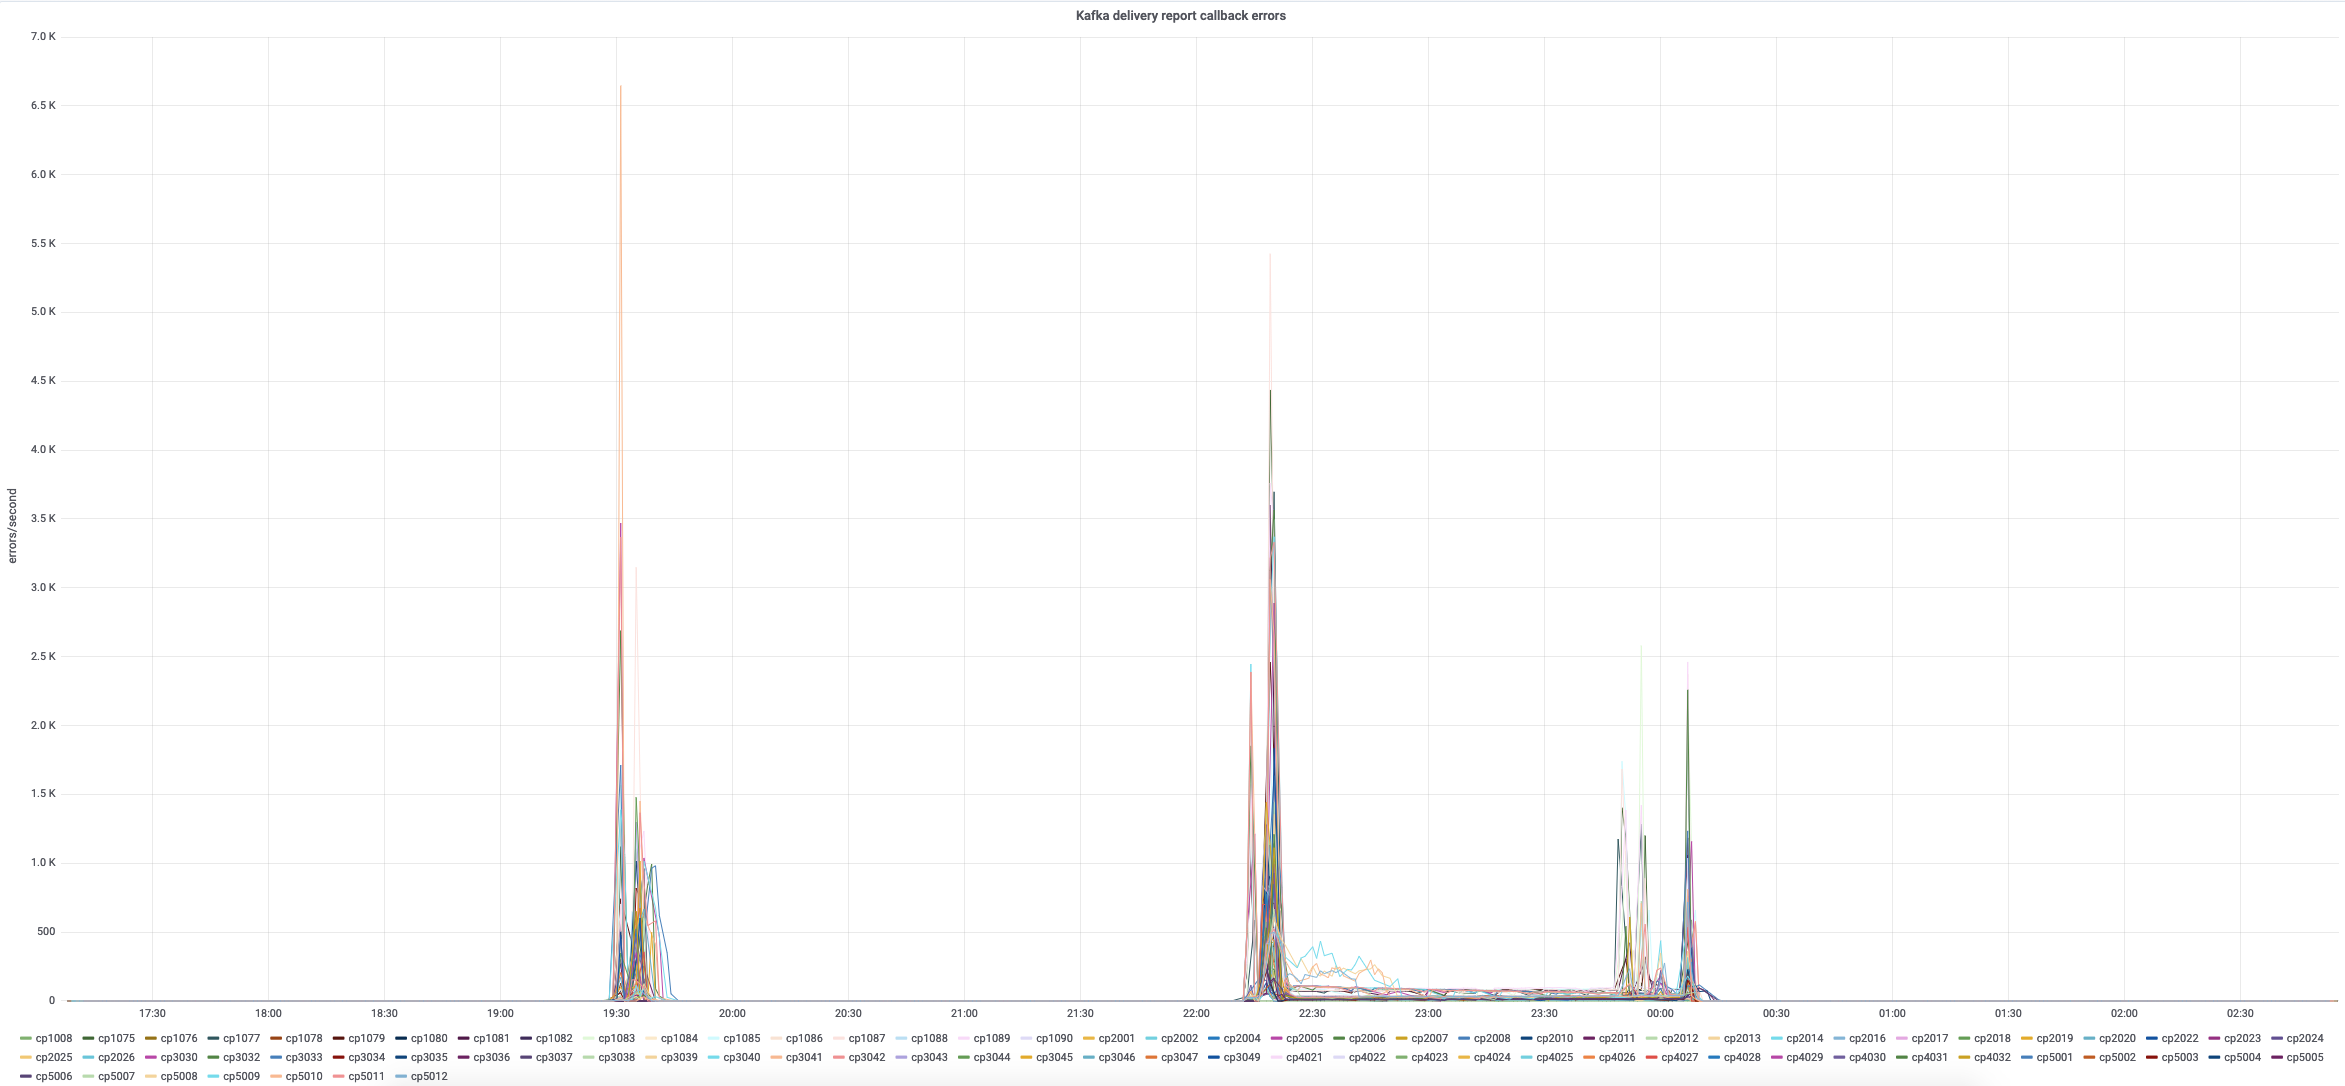
See call back errors in varnishkafka while incident is going on:

Screen Shot 2019-04-02 at 8.33.03 AM.png (1×2 px, 593 KB)

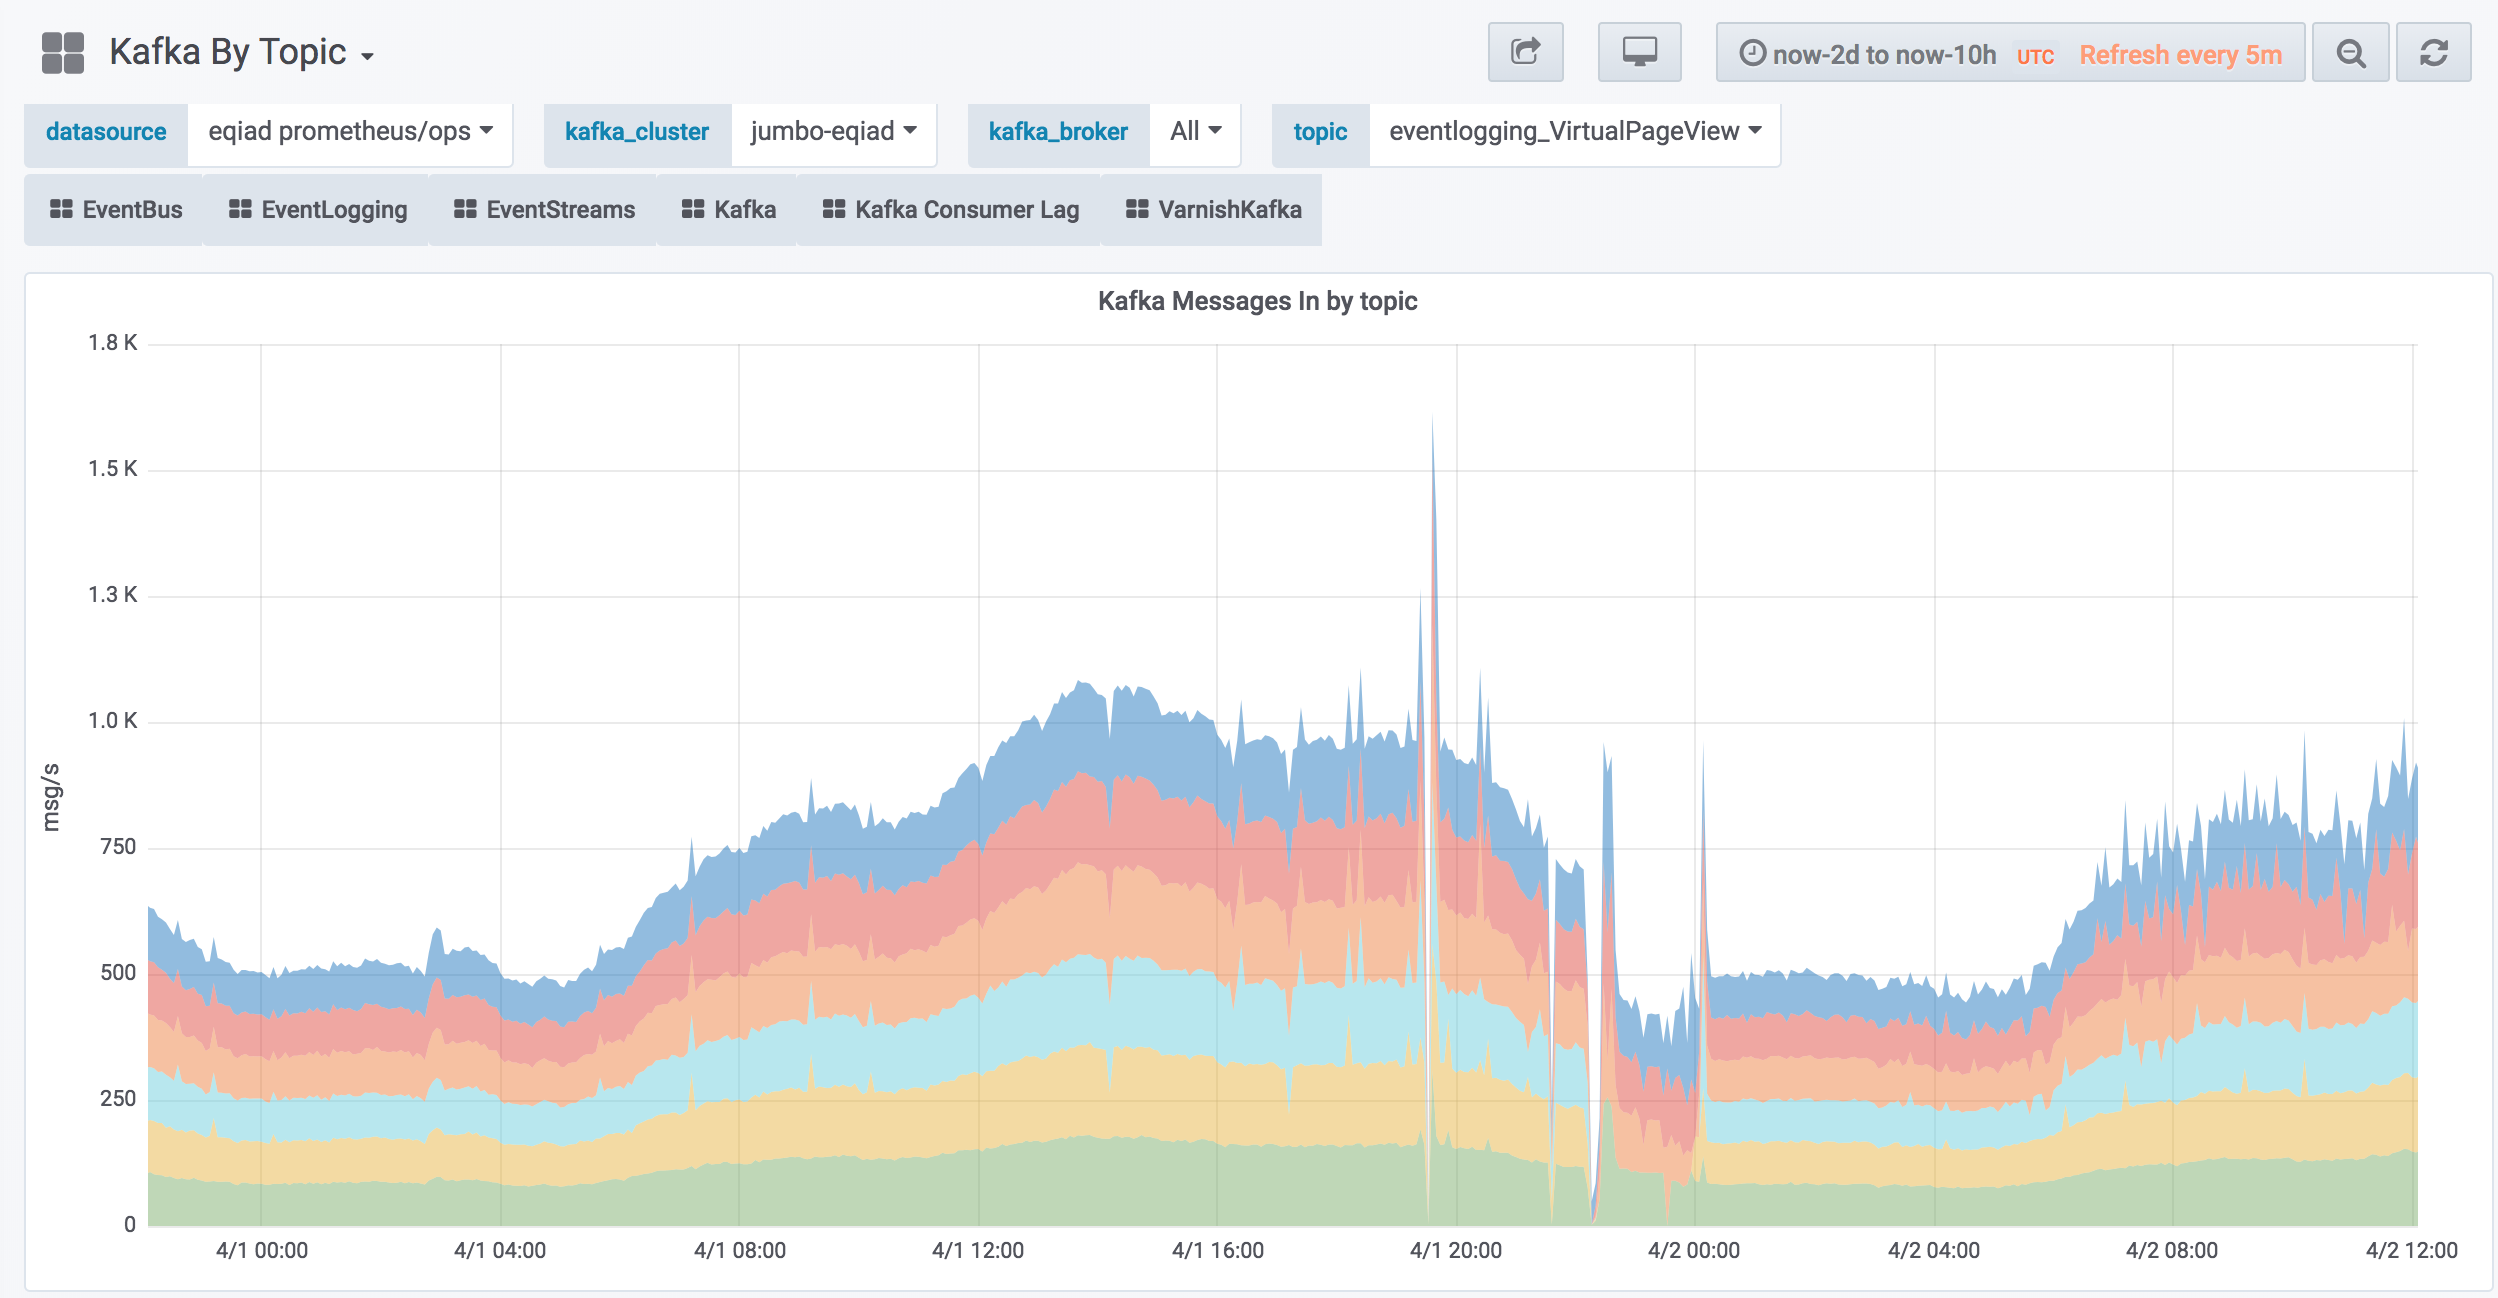
See how two brokers "disappear" from a topic while incident is going on:

Screen Shot 2019-04-02 at 3.06.16 PM.png (1×2 px, 523 KB)

Event Timeline

Alarms at 3:21 PST: icinga-wm> PROBLEM - Varnishkafka Eventlogging Delivery Errors per second on icinga1001 is CRITICAL: CRITICAL: 37.50% of data above the critical threshold [5.0] https://grafana.wikimedia.org/dashboard/db/varnishkafka?panelId=20&fullscreen&orgId=1&var-instance=eventlogging&var-host=All

Possibly related, mjolnir in the analytics cluster started reading via spark KafkaRDD mjolnir.msearch-prod-response around 22:11:23 and died around 22:17:49 with a variety of SocketTimeoutException coming from spark's KafkaRDD. This was actually a much smaller run than many times before, typically this reads datasets more than an order of magnitude larger, but this time around it was only run against kowiki, zhwiki and jawiki which are (relatively) smaller.

Outage starts at 22:12 UTC April 1st, it starts recovering at 00:07 April 2nd after a rolling restart of kafka jumbo and mirrormaker

eqiad.cirrussearch.page-index-update should be unrelated, this is a job that runs every monday and generally goes to a consumer lag of ~5M and then back down. Producing messages is throttled to 1400 messages/sec with very small (~100byte of plaintext, less because compression is turned on) messages. This can be further throttled if necessary.

Right, we need to quantify the amount of time varnishkafka just received errors from posts cause those will be lost records.

The first error I see in broker logs on kafka-jumbo1001 is:

[2019-04-01 19:29:25,322] WARN [ReplicaFetcher replicaId=1001, leaderId=1006, fetcherId=6] Error in response for fetch request (type=FetchRequest, replicaId=1001, maxWait=500, minBytes=1, maxBytes=10485760, fetchData={webrequest_upload-11=(offset=52139221538, logStartOffset=51364918388, maxBytes=4194304)}, isolationLevel=READ_UNCOMMITTED, toForget=, metadata=(sessionId=601949277, epoch=40834301)) (kafka.server.ReplicaFetcherThread)
java.io.IOException: Connection to 1006 was disconnected before the response was read
        at org.apache.kafka.clients.NetworkClientUtils.sendAndReceive(NetworkClientUtils.java:97)
        at kafka.server.ReplicaFetcherBlockingSend.sendRequest(ReplicaFetcherBlockingSend.scala:96)
        at kafka.server.ReplicaFetcherThread.fetch(ReplicaFetcherThread.scala:220)
        at kafka.server.ReplicaFetcherThread.fetch(ReplicaFetcherThread.scala:43)
        at kafka.server.AbstractFetcherThread.processFetchRequest(AbstractFetcherThread.scala:146)
        at kafka.server.AbstractFetcherThread.doWork(AbstractFetcherThread.scala:111)
        at kafka.utils.ShutdownableThread.run(ShutdownableThread.scala:82)

followed by a series of messages about the same thing but about connecting to all other brokers, except for 1002, which is also in Row A with 1001.

I looked also on 1003, which is the only broker in Row B, but I see the same failures for all brokers. On 1004, I see failures to all brokers except for 1005, which is also in the same row as 1004 (Row C). I didn't check 1006 logs yet (gotta sleep...)

Could there be a brief network partition here?

I can see two events:

  1. ~19:28->~19:44 UTC
  1. ~22:13->~00:10 UTC (this one seems a bit more complex, probably multiple occurrences in the same timeframe)

The first one seems to have no alarmed, I guess because of icinga settings in puppet (even if from what I can read it should have done something, taking a note to verify).

From the kafka in/out metrics is interesting to see how the two events seems to start in the same way (drop in traffic and then recover), but only the latter is more dramatic showing brokers having a bad time after the drop:

Screen Shot 2019-04-02 at 8.47.23 AM.png (476×2 px, 205 KB)

Screen Shot 2019-04-02 at 9.27.49 AM.png (1×2 px, 224 KB)

Most likely related to those timelines is two runs of mjolnir's feature collection: 19:14-19:34 and later 21:35-22:20. These use KafkaRDD against a topic with 35 partitions, mjolnir.msearch-prod-response. KafkaRDD is perhaps different from most consumers in that it takes a starting and ending offset, and reads everything in between. No throttling appears to be available in KafkaRDD, rather it depends on server quotas to throttle the responses.

first run: https://grafana.wikimedia.org/d/000000234/kafka-by-topic?orgId=1&from=1554145020338&to=1554148801396&var-datasource=eqiad%20prometheus%2Fops&var-kafka_cluster=jumbo-eqiad&var-kafka_broker=All&var-topic=mjolnir.msearch-prod-response

second run: https://grafana.wikimedia.org/d/000000234/kafka-by-topic?orgId=1&from=1554152844857&to=1554158206059&var-datasource=eqiad%20prometheus%2Fops&var-kafka_cluster=jumbo-eqiad&var-kafka_broker=All&var-topic=mjolnir.msearch-prod-response

Ok so my current theory is that the TX bandwidth of the 1G interfaces was temporary saturated multiple times, leading to timeouts due to the high traffic consumed. Let's re-analyze the the graphs with the new info provided by Erik.

[19:28 -> 19:44] the first run was a testing one, and caused some impact for only 10 minutes after it was stopped (as it is clearly indicated by the varnishkafka/kafka graphs).

[22:11 -> 22:20] the second run caused the same impact, but probably something more since after 22:20 (when the consumer stopped) two brokers stopped serving traffic, 1002/1003. They were not partition leaders anymore, as it can be seen from the related graph.

[22:20 -> 23:28] metrics kept the same trend up to ~23:30, when the first restart of 1001 happened. Varnishkafka was still showing up timeouts, but a constant volume, not related to the peaks reached at 22:20. During this timeframe under replicated partitions was zero, and it spiked as soon as the first restart hit. Very interesting to notice that 1004 (acting as Kafka Controller) showed a offline count of several partitions, and I suspect it is the reason why varnishkafka was still returning timeouts. Also, as far as I know, Varnishkafka relies on the min required acks set in the brokers to mark an event as produced. We should default IIRC to 1, so if two partitions are down then we should have delivery errors.

[23:28] (from SAL) restart kafka on kafka-jumbo1001

[23:36] (from SAL) restart kafka on kafka-jumbo1002

[23:47] (from SAL) restarting kafka on kafka-jumbo1003

[23:54] (from SAL) restarting kafka on kafka-jumbo1004

[23:55 -> 00:06] offline partition count down to zero, during this timeframe brokers show some recovery and load starts to be spread more.

[00:10] Varnishkafka is happy again.

Very interesting, it should confirm what Erik reported. There are various OOMs related to fetching from topic mjolnir.msearch-prod-response during the timeframes that the KafkaRDD fetcher was acting.

1001:

elukey@kafka-jumbo1001:~$ grep -i java.lang.OutOfMemoryError -B 1 /var/log/kafka/server.log
[2019-04-01 19:30:51,012] ERROR [KafkaApi-1001] Error when handling request {replica_id=-1,max_wait_time=0,min_bytes=0,topics=[{topic=mjolnir.msearch-prod-response,partitions=[{partition=21,fetch_offset=736719,max_bytes=40000000}]}]} (kafka.server.KafkaApis)
java.lang.OutOfMemoryError: Java heap space
--
[2019-04-01 22:13:51,641] ERROR [KafkaApi-1001] Error when handling request {replica_id=-1,max_wait_time=0,min_bytes=0,topics=[{topic=mjolnir.msearch-prod-response,partitions=[{partition=33,fetch_offset=743555,max_bytes=40000000}]}]} (kafka.server.KafkaApis)
java.lang.OutOfMemoryError: Java heap space
--
[2019-04-01 22:17:10,133] ERROR [KafkaApi-1001] Error when handling request {replica_id=-1,max_wait_time=0,min_bytes=0,topics=[{topic=mjolnir.msearch-prod-response,partitions=[{partition=21,fetch_offset=740326,max_bytes=40000000}]}]} (kafka.server.KafkaApis)
java.lang.OutOfMemoryError: Java heap space
--
[2019-04-01 22:17:39,838] ERROR [KafkaApi-1001] Error when handling request {replica_id=-1,max_wait_time=0,min_bytes=0,topics=[{topic=mjolnir.msearch-prod-response,partitions=[{partition=9,fetch_offset=741650,max_bytes=40000000}]}]} (kafka.server.KafkaApis)
java.lang.OutOfMemoryError: Java heap space
--
[2019-04-01 22:17:58,938] ERROR [KafkaApi-1001] Error when handling request {replica_id=-1,max_wait_time=0,min_bytes=0,topics=[{topic=mjolnir.msearch-prod-response,partitions=[{partition=21,fetch_offset=740326,max_bytes=40000000}]}]} (kafka.server.KafkaApis)
java.lang.OutOfMemoryError: Java heap space
--
[2019-04-01 22:18:19,096] ERROR [KafkaApi-1001] Error when handling request {replica_id=-1,max_wait_time=0,min_bytes=0,topics=[{topic=mjolnir.msearch-prod-response,partitions=[{partition=9,fetch_offset=741650,max_bytes=40000000}]}]} (kafka.server.KafkaApis)
java.lang.OutOfMemoryError: Java heap space

1002:

elukey@kafka-jumbo1002:~$ grep -i java.lang.OutOfMemoryError -B 1 /var/log/kafka/server.log
[2019-04-01 19:30:47,787] ERROR [KafkaApi-1002] Error when handling request {replica_id=-1,max_wait_time=0,min_bytes=0,topics=[{topic=mjolnir.msearch-prod-response,partitions=[{partition=31,fetch_offset=737558,max_bytes=40000000}]}]} (kafka.server.KafkaApis)
java.lang.OutOfMemoryError: Java heap space
--
[2019-04-01 22:13:53,421] ERROR [KafkaApi-1002] Error when handling request {replica_id=-1,max_wait_time=0,min_bytes=0,topics=[{topic=mjolnir.msearch-prod-response,partitions=[{partition=31,fetch_offset=741283,max_bytes=40000000}]}]} (kafka.server.KafkaApis)
java.lang.OutOfMemoryError: Java heap space
--
[2019-04-01 22:16:43,938] ERROR [KafkaApi-1002] Error when handling request {replica_id=-1,max_wait_time=0,min_bytes=0,topics=[{topic=mjolnir.msearch-prod-response,partitions=[{partition=25,fetch_offset=740868,max_bytes=40000000}]}]} (kafka.server.KafkaApis)
java.lang.OutOfMemoryError: Java heap space
--
[2019-04-01 22:16:46,739] ERROR [KafkaApi-1002] Error when handling request {replica_id=-1,max_wait_time=0,min_bytes=0,topics=[{topic=mjolnir.msearch-prod-response,partitions=[{partition=19,fetch_offset=740854,max_bytes=40000000}]}]} (kafka.server.KafkaApis)
java.lang.OutOfMemoryError: Java heap space
--
[2019-04-01 22:17:03,816] ERROR [KafkaApi-1002] Error when handling request {replica_id=-1,max_wait_time=0,min_bytes=0,topics=[{topic=mjolnir.msearch-prod-response,partitions=[{partition=13,fetch_offset=741361,max_bytes=40000000}]}]} (kafka.server.KafkaApis)
java.lang.OutOfMemoryError: Java heap space
--
[2019-04-01 22:17:03,819] ERROR [ThrottledRequestReaper-Produce]: Error due to (kafka.server.ClientQuotaManager$ThrottledRequestReaper)
java.lang.OutOfMemoryError: Java heap space
--
[2019-04-01 22:17:03,820] WARN [ReplicaFetcher replicaId=1002, leaderId=1004, fetcherId=7] Error in response for fetch request (type=FetchRequest, replicaId=1002, maxWait=500, minBytes=1, maxBytes=10485760, fetchData={webrequest_upload-10=(offset=52153177721, logStartOffset=51378135923, maxBytes=4194304)}, isolationLevel=READ_UNCOMMITTED, toForget=, metadata=(sessionId=394970027, epoch=117)) (kafka.server.ReplicaFetcherThread)
java.lang.OutOfMemoryError: Java heap space
--
[2019-04-01 22:17:03,820] WARN [ReplicaFetcher replicaId=1002, leaderId=1004, fetcherId=1] Error in response for fetch request (type=FetchRequest, replicaId=1002, maxWait=500, minBytes=1, maxBytes=10485760, fetchData={webrequest_upload-16=(offset=52154227544, logStartOffset=51378348531, maxBytes=4194304)}, isolationLevel=READ_UNCOMMITTED, toForget=, metadata=(sessionId=1984645935, epoch=115)) (kafka.server.ReplicaFetcherThread)
java.lang.OutOfMemoryError: Java heap space
--
[2019-04-01 22:17:07,496] ERROR [KafkaApi-1002] Error when handling request {replica_id=-1,max_wait_time=0,min_bytes=0,topics=[{topic=mjolnir.msearch-prod-response,partitions=[{partition=7,fetch_offset=740662,max_bytes=40000000}]}]} (kafka.server.KafkaApis)
java.lang.OutOfMemoryError: Java heap space
--
[2019-04-01 22:17:11,528] ERROR [KafkaApi-1002] Error when handling request {replica_id=-1,max_wait_time=0,min_bytes=0,topics=[{topic=mjolnir.msearch-prod-response,partitions=[{partition=1,fetch_offset=742286,max_bytes=40000000}]}]} (kafka.server.KafkaApis)
java.lang.OutOfMemoryError: Java heap space
[2019-04-01 22:17:18,611] ERROR [ThrottledRequestReaper-Request]: Error due to (kafka.server.ClientQuotaManager$ThrottledRequestReaper)
java.lang.OutOfMemoryError: Java heap space
--
[2019-04-01 22:17:18,613] WARN [ReplicaFetcher replicaId=1002, leaderId=1004, fetcherId=6] Error in response for fetch request (type=FetchRequest, replicaId=1002, maxWait=500, minBytes=1, maxBytes=10485760, fetchData={webrequest_text-11=(offset=92375856018, logStartOffset=90673253992, maxBytes=4194304)}, isolationLevel=READ_UNCOMMITTED, toForget=, metadata=(sessionId=665170819, epoch=127)) (kafka.server.ReplicaFetcherThread)
java.lang.OutOfMemoryError: Java heap space
[2019-04-01 22:17:18,613] WARN [ReplicaFetcher replicaId=1002, leaderId=1004, fetcherId=8] Error in response for fetch request (type=FetchRequest, replicaId=1002, maxWait=500, minBytes=1, maxBytes=10485760, fetchData={}, isolationLevel=READ_UNCOMMITTED, toForget=, metadata=(sessionId=2057059417, epoch=81)) (kafka.server.ReplicaFetcherThread)
java.lang.OutOfMemoryError: Java heap space
[2019-04-01 22:17:18,628] ERROR Processor got uncaught exception. (kafka.network.Processor)
java.lang.OutOfMemoryError: Java heap space
[2019-04-01 22:17:18,628] ERROR Processor got uncaught exception. (kafka.network.Processor)
java.lang.OutOfMemoryError: Java heap space
[2019-04-01 22:17:18,628] ERROR Uncaught exception in scheduled task 'kafka-delete-logs' (kafka.utils.KafkaScheduler)
java.lang.OutOfMemoryError: Java heap space
[2019-04-01 22:17:19,448] ERROR [KafkaApi-1002] Error when handling request {replica_id=-1,max_wait_time=0,min_bytes=0,topics=[{topic=mjolnir.msearch-prod-response,partitions=[{partition=31,fetch_offset=741283,max_bytes=40000000}]}]} (kafka.server.KafkaApis)
java.lang.OutOfMemoryError: Java heap space
--
[2019-04-01 22:17:26,444] ERROR [KafkaApi-1002] Error when handling request {replica_id=-1,max_wait_time=0,min_bytes=0,topics=[{topic=mjolnir.msearch-prod-response,partitions=[{partition=1,fetch_offset=742286,max_bytes=40000000}]}]} (kafka.server.KafkaApis)
java.lang.OutOfMemoryError: Java heap space
[2019-04-01 22:17:26,446] WARN [ReplicaFetcher replicaId=1002, leaderId=1004, fetcherId=0] Error in response for fetch request (type=FetchRequest, replicaId=1002, maxWait=500, minBytes=1, maxBytes=10485760, fetchData={webrequest_text-5=(offset=92375862524, logStartOffset=90673349972, maxBytes=4194304)}, isolationLevel=READ_UNCOMMITTED, toForget=, metadata=(sessionId=1311833483, epoch=145)) (kafka.server.ReplicaFetcherThread)
java.lang.OutOfMemoryError: Java heap space
[2019-04-01 22:17:26,459] ERROR Error occurred (kafka.network.Acceptor)
java.lang.OutOfMemoryError: Java heap space
[2019-04-01 22:17:30,677] ERROR [ExpirationReaper-1002-Heartbeat]: Error due to (kafka.server.DelayedOperationPurgatory$ExpiredOperationReaper)
java.lang.OutOfMemoryError: Java heap space
[2019-04-01 22:17:30,677] ERROR Error occurred (kafka.network.Acceptor)
java.lang.OutOfMemoryError: Java heap space
--
[2019-04-01 22:17:30,677] ERROR [KafkaApi-1002] Error when handling request {replica_id=-1,max_wait_time=0,min_bytes=0,topics=[{topic=mjolnir.msearch-prod-response,partitions=[{partition=31,fetch_offset=741283,max_bytes=40000000}]}]} (kafka.server.KafkaApis)
java.lang.OutOfMemoryError: Java heap space

1003:

elukey@kafka-jumbo1003:~$ grep -i java.lang.OutOfMemoryError -B 1 /var/log/kafka/server.log
[2019-04-01 19:30:57,987] ERROR [KafkaApi-1003] Error when handling request {replica_id=-1,max_wait_time=0,min_bytes=0,topics=[{topic=mjolnir.msearch-prod-response,partitions=[{partition=34,fetch_offset=737354,max_bytes=40000000}]}]} (kafka.server.KafkaApis)
java.lang.OutOfMemoryError: Java heap space
--
[2019-04-01 19:31:19,134] ERROR [KafkaApi-1003] Error when handling request {replica_id=-1,max_wait_time=0,min_bytes=0,topics=[{topic=mjolnir.msearch-prod-response,partitions=[{partition=22,fetch_offset=736853,max_bytes=40000000}]}]} (kafka.server.KafkaApis)
java.lang.OutOfMemoryError: Java heap space
--
[2019-04-01 19:31:21,973] ERROR [KafkaApi-1003] Error when handling request {replica_id=-1,max_wait_time=0,min_bytes=0,topics=[{topic=mjolnir.msearch-prod-response,partitions=[{partition=34,fetch_offset=737354,max_bytes=40000000}]}]} (kafka.server.KafkaApis)
java.lang.OutOfMemoryError: Java heap space
--
[2019-04-01 19:31:24,922] ERROR [KafkaApi-1003] Error when handling request {replica_id=-1,max_wait_time=0,min_bytes=0,topics=[{topic=mjolnir.msearch-prod-response,partitions=[{partition=16,fetch_offset=736899,max_bytes=40000000}]}]} (kafka.server.KafkaApis)
java.lang.OutOfMemoryError: Java heap space
--
[2019-04-01 19:31:27,411] ERROR [KafkaApi-1003] Error when handling request {replica_id=-1,max_wait_time=0,min_bytes=0,topics=[{topic=mjolnir.msearch-prod-response,partitions=[{partition=28,fetch_offset=738183,max_bytes=40000000}]}]} (kafka.server.KafkaApis)
java.lang.OutOfMemoryError: Java heap space
[2019-04-01 19:31:29,978] ERROR [KafkaApi-1003] Error when handling request {replica_id=-1,max_wait_time=0,min_bytes=0,topics=[{topic=mjolnir.msearch-prod-response,partitions=[{partition=4,fetch_offset=736062,max_bytes=40000000}]}]} (kafka.server.KafkaApis)
java.lang.OutOfMemoryError: Java heap space
--
[2019-04-01 19:31:34,954] ERROR [KafkaApi-1003] Error when handling request {replica_id=-1,max_wait_time=0,min_bytes=0,topics=[{topic=mjolnir.msearch-prod-response,partitions=[{partition=22,fetch_offset=736853,max_bytes=40000000}]}]} (kafka.server.KafkaApis)
java.lang.OutOfMemoryError: Java heap space
--
[2019-04-01 19:31:37,802] ERROR [KafkaApi-1003] Error when handling request {replica_id=-1,max_wait_time=0,min_bytes=0,topics=[{topic=mjolnir.msearch-prod-response,partitions=[{partition=28,fetch_offset=738183,max_bytes=40000000}]}]} (kafka.server.KafkaApis)
java.lang.OutOfMemoryError: Java heap space
--
[2019-04-01 19:31:40,341] ERROR [KafkaApi-1003] Error when handling request {replica_id=-1,max_wait_time=0,min_bytes=0,topics=[{topic=mjolnir.msearch-prod-response,partitions=[{partition=16,fetch_offset=736899,max_bytes=40000000}]}]} (kafka.server.KafkaApis)
java.lang.OutOfMemoryError: Java heap space
--
[2019-04-01 19:31:43,816] ERROR [KafkaApi-1003] Error when handling request {replica_id=-1,max_wait_time=0,min_bytes=0,topics=[{topic=mjolnir.msearch-prod-response,partitions=[{partition=28,fetch_offset=738183,max_bytes=40000000}]}]} (kafka.server.KafkaApis)
java.lang.OutOfMemoryError: Java heap space
--
[2019-04-01 19:31:46,275] ERROR [KafkaApi-1003] Error when handling request {replica_id=-1,max_wait_time=0,min_bytes=0,topics=[{topic=mjolnir.msearch-prod-response,partitions=[{partition=16,fetch_offset=736899,max_bytes=40000000}]}]} (kafka.server.KafkaApis)
java.lang.OutOfMemoryError: Java heap space
--
[2019-04-01 22:13:53,669] ERROR [KafkaApi-1003] Error when handling request {replica_id=-1,max_wait_time=0,min_bytes=0,topics=[{topic=mjolnir.msearch-prod-response,partitions=[{partition=34,fetch_offset=741043,max_bytes=40000000}]}]} (kafka.server.KafkaApis)
java.lang.OutOfMemoryError: Java heap space
--
[2019-04-01 22:16:12,783] ERROR [KafkaApi-1003] Error when handling request {replica_id=-1,max_wait_time=0,min_bytes=0,topics=[{topic=mjolnir.msearch-prod-response,partitions=[{partition=10,fetch_offset=740327,max_bytes=40000000}]}]} (kafka.server.KafkaApis)
java.lang.OutOfMemoryError: Java heap space
--
[2019-04-01 22:17:21,485] WARN [ReplicaFetcher replicaId=1003, leaderId=1006, fetcherId=6] Error in response for fetch request (type=FetchRequest, replicaId=1003, maxWait=500, minBytes=1, maxBytes=10485760, fetchData={}, isolationLevel=READ_UNCOMMITTED, toForget=, metadata=(sessionId=547792293, epoch=28)) (kafka.server.ReplicaFetcherThread)
java.lang.OutOfMemoryError: Java heap space
--
[2019-04-01 22:17:21,485] WARN [ReplicaFetcher replicaId=1003, leaderId=1005, fetcherId=5] Error in response for fetch request (type=FetchRequest, replicaId=1003, maxWait=500, minBytes=1, maxBytes=10485760, fetchData={eventlogging_VirtualPageView-8=(offset=768230853, logStartOffset=732026206, maxBytes=4194304)}, isolationLevel=READ_UNCOMMITTED, toForget=, metadata=(sessionId=650733406, epoch=1)) (kafka.server.ReplicaFetcherThread)
java.lang.OutOfMemoryError: Java heap space
--
[2019-04-01 22:17:21,486] WARN [ReplicaFetcher replicaId=1003, leaderId=1006, fetcherId=9] Error in response for fetch request (type=FetchRequest, replicaId=1003, maxWait=500, minBytes=1, maxBytes=10485760, fetchData={}, isolationLevel=READ_UNCOMMITTED, toForget=, metadata=(sessionId=368566558, epoch=42)) (kafka.server.ReplicaFetcherThread)
java.lang.OutOfMemoryError: Java heap space
--
[2019-04-01 22:17:21,486] WARN [ReplicaFetcher replicaId=1003, leaderId=1004, fetcherId=9] Error in response for fetch request (type=FetchRequest, replicaId=1003, maxWait=500, minBytes=1, maxBytes=10485760, fetchData={}, isolationLevel=READ_UNCOMMITTED, toForget=, metadata=(sessionId=1837019346, epoch=59)) (kafka.server.ReplicaFetcherThread)
java.lang.OutOfMemoryError: Java heap space
--
[2019-04-01 22:17:21,487] WARN [ReplicaFetcher replicaId=1003, leaderId=1006, fetcherId=8] Error in response for fetch request (type=FetchRequest, replicaId=1003, maxWait=500, minBytes=1, maxBytes=10485760, fetchData={}, isolationLevel=READ_UNCOMMITTED, toForget=, metadata=(sessionId=789833845, epoch=27)) (kafka.server.ReplicaFetcherThread)
java.lang.OutOfMemoryError: Java heap space
--
[2019-04-01 22:17:21,485] WARN [ReplicaFetcher replicaId=1003, leaderId=1002, fetcherId=2] Error in response for fetch request (type=FetchRequest, replicaId=1003, maxWait=500, minBytes=1, maxBytes=10485760, fetchData={webrequest_text-7=(offset=92371489375, logStartOffset=90669356903, maxBytes=4194304)}, isolationLevel=READ_UNCOMMITTED, toForget=, metadata=(sessionId=76200138, epoch=1)) (kafka.server.ReplicaFetcherThread)
java.lang.OutOfMemoryError: Java heap space
--
[2019-04-01 22:17:21,486] ERROR [KafkaApi-1003] Error when handling request {replica_id=-1,max_wait_time=0,min_bytes=0,topics=[{topic=mjolnir.msearch-prod-response,partitions=[{partition=28,fetch_offset=741793,max_bytes=40000000}]}]} (kafka.server.KafkaApis)
java.lang.OutOfMemoryError: Java heap space
[2019-04-01 22:17:21,486] WARN [ReplicaFetcher replicaId=1003, leaderId=1004, fetcherId=7] Error in response for fetch request (type=FetchRequest, replicaId=1003, maxWait=500, minBytes=1, maxBytes=10485760, fetchData={webrequest_upload-10=(offset=52153172013, logStartOffset=51378135923, maxBytes=4194304), webrequest_upload-22=(offset=52151768064, logStartOffset=51377827670, maxBytes=4194304)}, isolationLevel=READ_UNCOMMITTED, toForget=, metadata=(sessionId=1834037452, epoch=114)) (kafka.server.ReplicaFetcherThread)
java.lang.OutOfMemoryError: Java heap space
--
[2019-04-01 22:17:21,486] WARN [ReplicaFetcher replicaId=1003, leaderId=1004, fetcherId=3] Error in response for fetch request (type=FetchRequest, replicaId=1003, maxWait=500, minBytes=1, maxBytes=10485760, fetchData={}, isolationLevel=READ_UNCOMMITTED, toForget=, metadata=(sessionId=872142338, epoch=81)) (kafka.server.ReplicaFetcherThread)
java.lang.OutOfMemoryError: Java heap space
--
[2019-04-01 22:17:21,494] WARN [ReplicaFetcher replicaId=1003, leaderId=1004, fetcherId=10] Error in response for fetch request (type=FetchRequest, replicaId=1003, maxWait=500, minBytes=1, maxBytes=10485760, fetchData={eventlogging-valid-mixed-4=(offset=361625658, logStartOffset=350210131, maxBytes=4194304)}, isolationLevel=READ_UNCOMMITTED, toForget=, metadata=(sessionId=335298300, epoch=116)) (kafka.server.ReplicaFetcherThread)
java.lang.OutOfMemoryError: Java heap space
--
[2019-04-01 22:17:21,494] WARN [ReplicaFetcher replicaId=1003, leaderId=1004, fetcherId=1] Error in response for fetch request (type=FetchRequest, replicaId=1003, maxWait=500, minBytes=1, maxBytes=10485760, fetchData={webrequest_upload-4=(offset=52153307132, logStartOffset=51378072308, maxBytes=4194304)}, isolationLevel=READ_UNCOMMITTED, toForget=, metadata=(sessionId=698869159, epoch=145)) (kafka.server.ReplicaFetcherThread)
java.lang.OutOfMemoryError: Java heap space
[2019-04-01 22:17:21,494] WARN [ReplicaFetcher replicaId=1003, leaderId=1001, fetcherId=9] Error in response for fetch request (type=FetchRequest, replicaId=1003, maxWait=500, minBytes=1, maxBytes=10485760, fetchData={webrequest_upload-20=(offset=52152632770, logStartOffset=51378952729, maxBytes=4194304)}, isolationLevel=READ_UNCOMMITTED, toForget=, metadata=(sessionId=592336905, epoch=1)) (kafka.server.ReplicaFetcherThread)
java.lang.OutOfMemoryError: Java heap space
--
[2019-04-01 22:17:21,494] WARN [ReplicaFetcher replicaId=1003, leaderId=1005, fetcherId=3] Error in response for fetch request (type=FetchRequest, replicaId=1003, maxWait=500, minBytes=1, maxBytes=10485760, fetchData={webrequest_text-8=(offset=92374435202, logStartOffset=90669538780, maxBytes=4194304)}, isolationLevel=READ_UNCOMMITTED, toForget=, metadata=(sessionId=910892589, epoch=1)) (kafka.server.ReplicaFetcherThread)
java.lang.OutOfMemoryError: Java heap space
--
[2019-04-01 22:17:21,516] ERROR [ExpirationReaper-1003-Fetch]: Error due to (kafka.server.DelayedOperationPurgatory$ExpiredOperationReaper)
java.lang.OutOfMemoryError: Java heap space
[2019-04-01 22:17:21,516] ERROR [ExpirationReaper-1003-Heartbeat]: Error due to (kafka.server.DelayedOperationPurgatory$ExpiredOperationReaper)
java.lang.OutOfMemoryError: Java heap space
--
[2019-04-01 22:17:21,516] ERROR [ExpirationReaper-1003-Rebalance]: Error due to (kafka.server.DelayedOperationPurgatory$ExpiredOperationReaper)
java.lang.OutOfMemoryError: Java heap space
[2019-04-01 22:17:21,516] ERROR [ThrottledRequestReaper-Fetch]: Error due to (kafka.server.ClientQuotaManager$ThrottledRequestReaper)
java.lang.OutOfMemoryError: Java heap space
[2019-04-01 22:17:21,517] ERROR Exception while processing disconnection of 10.64.16.99:9092-10.64.0.176:37072-427211 (kafka.network.Processor)
java.lang.OutOfMemoryError: Java heap space
[2019-04-01 22:17:21,516] ERROR Processor got uncaught exception. (kafka.network.Processor)
java.lang.OutOfMemoryError: Java heap space

1004:

elukey@kafka-jumbo1004:~$ grep -i java.lang.OutOfMemoryError -B 1 /var/log/kafka/server.log
[2019-04-01 19:30:29,766] ERROR [KafkaApi-1004] Error when handling request {replica_id=-1,max_wait_time=0,min_bytes=0,topics=[{topic=mjolnir.msearch-prod-response,partitions=[{partition=23,fetch_offset=738658,max_bytes=40000000}]}]} (kafka.server.KafkaApis)
java.lang.OutOfMemoryError: Java heap space

1005:

[2019-04-01 19:30:50,912] ERROR [KafkaApi-1005] Error when handling request {replica_id=-1,max_wait_time=0,min_bytes=0,topics=[{topic=mjolnir.msearch-prod-response,partitions=[{partition=26,fetch_offset=737773,max_bytes=40000000}]}]} (kafka.server.KafkaApis)
java.lang.OutOfMemoryError: Java heap space
--
[2019-04-01 22:13:52,181] ERROR [KafkaApi-1005] Error when handling request {replica_id=-1,max_wait_time=0,min_bytes=0,topics=[{topic=mjolnir.msearch-prod-response,partitions=[{partition=32,fetch_offset=740966,max_bytes=40000000}]}]} (kafka.server.KafkaApis)
java.lang.OutOfMemoryError: Java heap space
--
[2019-04-01 22:17:28,155] ERROR [KafkaApi-1005] Error when handling request {replica_id=-1,max_wait_time=0,min_bytes=0,topics=[{topic=mjolnir.msearch-prod-response,partitions=[{partition=20,fetch_offset=742595,max_bytes=40000000}]}]} (kafka.server.KafkaApis)
java.lang.OutOfMemoryError: Java heap space
--
[2019-04-01 22:17:30,552] ERROR [KafkaApi-1005] Error when handling request {replica_id=-1,max_wait_time=0,min_bytes=0,topics=[{topic=mjolnir.msearch-prod-response,partitions=[{partition=14,fetch_offset=740576,max_bytes=40000000}]}]} (kafka.server.KafkaApis)
java.lang.OutOfMemoryError: Java heap space
--
[2019-04-01 22:17:33,475] ERROR [KafkaApi-1005] Error when handling request {replica_id=-1,max_wait_time=0,min_bytes=0,topics=[{topic=mjolnir.msearch-prod-response,partitions=[{partition=8,fetch_offset=741653,max_bytes=40000000}]}]} (kafka.server.KafkaApis)
java.lang.OutOfMemoryError: Java heap space
--
[2019-04-01 22:17:37,856] ERROR [KafkaApi-1005] Error when handling request {replica_id=-1,max_wait_time=0,min_bytes=0,topics=[{topic=mjolnir.msearch-prod-response,partitions=[{partition=26,fetch_offset=741344,max_bytes=40000000}]}]} (kafka.server.KafkaApis)
java.lang.OutOfMemoryError: Java heap space
--
[2019-04-01 22:17:41,262] ERROR [KafkaApi-1005] Error when handling request {replica_id=-1,max_wait_time=0,min_bytes=0,topics=[{topic=mjolnir.msearch-prod-response,partitions=[{partition=32,fetch_offset=740966,max_bytes=40000000}]}]} (kafka.server.KafkaApis)
java.lang.OutOfMemoryError: Java heap space
--
[2019-04-01 22:17:43,809] ERROR [KafkaApi-1005] Error when handling request {replica_id=-1,max_wait_time=0,min_bytes=0,topics=[{topic=mjolnir.msearch-prod-response,partitions=[{partition=20,fetch_offset=742595,max_bytes=40000000}]}]} (kafka.server.KafkaApis)
java.lang.OutOfMemoryError: Java heap space
--
[2019-04-01 22:17:46,273] ERROR [KafkaApi-1005] Error when handling request {replica_id=-1,max_wait_time=0,min_bytes=0,topics=[{topic=mjolnir.msearch-prod-response,partitions=[{partition=14,fetch_offset=740576,max_bytes=40000000}]}]} (kafka.server.KafkaApis)
java.lang.OutOfMemoryError: Java heap space
--
[2019-04-01 22:17:48,914] ERROR [KafkaApi-1005] Error when handling request {replica_id=-1,max_wait_time=0,min_bytes=0,topics=[{topic=mjolnir.msearch-prod-response,partitions=[{partition=8,fetch_offset=741653,max_bytes=40000000}]}]} (kafka.server.KafkaApis)
java.lang.OutOfMemoryError: Java heap space
--
[2019-04-01 22:17:51,177] ERROR [KafkaApi-1005] Error when handling request {replica_id=-1,max_wait_time=0,min_bytes=0,topics=[{topic=mjolnir.msearch-prod-response,partitions=[{partition=26,fetch_offset=741344,max_bytes=40000000}]}]} (kafka.server.KafkaApis)
java.lang.OutOfMemoryError: Java heap space

1006:

elukey@kafka-jumbo1006:~$ grep -i java.lang.OutOfMemoryError -B 1 /var/log/kafka/server.log
[None]
elukey renamed this task from jumbo kafka cluster cannot accept connections to [Post-mortem] Kafka Jumbo cluster cannot accept connections.Apr 2 2019, 9:47 AM
elukey triaged this task as Medium priority.
elukey added a project: Analytics-Kanban.
elukey added a subscriber: mobrovac.

Mentioned in SAL (#wikimedia-operations) [2019-04-02T10:08:22Z] <elukey> manually purge varnishkafka graphite alert's URL as attempt to avoid a flapping alert - T219842

Mentioned in SAL (#wikimedia-analytics) [2019-04-02T10:14:14Z] <elukey> restart eventlogging's mysql consumers on eventlog1002 - T219842

While I don't want to stop investigative work from happening, is someone planning on writing this up at https://wikitech.wikimedia.org/wiki/Incident_documentation ?

While I don't want to stop investigative work from happening, is someone planning on writing this up at https://wikitech.wikimedia.org/wiki/Incident_documentation ?

To keep archives happy - I was discussing this with Chris on IRC, we are going to publish an incident report for sure! :)

Eventlogging data sent by Varnishkafka was of course impacted as well:

https://grafana.wikimedia.org/d/000000253/varnishkafka?panelId=20&fullscreen&orgId=1&var-instance=eventlogging&var-host=All&from=1554156581626&to=1554164506733

It was not impacted in the 19:28->~19:44 time window (where webrequest was).

Very interesting:

java.lang.OutOfMemoryError: Java heap space
        at java.nio.HeapByteBuffer.<init>(HeapByteBuffer.java:57)
        at java.nio.ByteBuffer.allocate(ByteBuffer.java:335)
        at org.apache.kafka.common.record.AbstractRecords.downConvert(AbstractRecords.java:101)    
        at org.apache.kafka.common.record.FileRecords.downConvert(FileRecords.java:242)                       
        at kafka.server.KafkaApis$$anonfun$kafka$server$KafkaApis$$convertedPartitionData$1$1$$anonfun$apply$4.apply(KafkaApis.scala:557)
        at kafka.server.KafkaApis$$anonfun$kafka$server$KafkaApis$$convertedPartitionData$1$1$$anonfun$apply$4.apply(KafkaApis.scala:555)
        at scala.Option.map(Option.scala:146)
        at kafka.server.KafkaApis$$anonfun$kafka$server$KafkaApis$$convertedPartitionData$1$1.apply(KafkaApis.scala:555)
        at kafka.server.KafkaApis$$anonfun$kafka$server$KafkaApis$$convertedPartitionData$1$1.apply(KafkaApis.scala:545)
        at scala.Option.flatMap(Option.scala:171)
        at kafka.server.KafkaApis.kafka$server$KafkaApis$$convertedPartitionData$1(KafkaApis.scala:545)
        at kafka.server.KafkaApis$$anonfun$kafka$server$KafkaApis$$createResponse$2$1.apply(KafkaApis.scala:586)
        at kafka.server.KafkaApis$$anonfun$kafka$server$KafkaApis$$createResponse$2$1.apply(KafkaApis.scala:582)
        at scala.collection.Iterator$class.foreach(Iterator.scala:891)
        at scala.collection.AbstractIterator.foreach(Iterator.scala:1334)
        at scala.collection.IterableLike$class.foreach(IterableLike.scala:72)
        at scala.collection.AbstractIterable.foreach(Iterable.scala:54)
        at kafka.server.KafkaApis.kafka$server$KafkaApis$$createResponse$2(KafkaApis.scala:582)
        at kafka.server.KafkaApis$$anonfun$kafka$server$KafkaApis$$fetchResponseCallback$1$2.apply(KafkaApis.scala:603)
        at kafka.server.KafkaApis$$anonfun$kafka$server$KafkaApis$$fetchResponseCallback$1$2.apply(KafkaApis.scala:603)
        at kafka.server.KafkaApis$$anonfun$sendResponseMaybeThrottle$1.apply$mcVI$sp(KafkaApis.scala:2228)
        at kafka.server.ClientRequestQuotaManager.maybeRecordAndThrottle(ClientRequestQuotaManager.scala:54)
        at kafka.server.KafkaApis.sendResponseMaybeThrottle(KafkaApis.scala:2227)
        at kafka.server.KafkaApis.kafka$server$KafkaApis$$fetchResponseCallback$1(KafkaApis.scala:603)
        at kafka.server.KafkaApis$$anonfun$kafka$server$KafkaApis$$processResponseCallback$1$1.apply$mcVI$sp(KafkaApis.scala:621)
        at kafka.server.ClientQuotaManager.maybeRecordAndThrottle(ClientQuotaManager.scala:176)
        at kafka.server.KafkaApis.kafka$server$KafkaApis$$processResponseCallback$1(KafkaApis.scala:620)
        at kafka.server.KafkaApis$$anonfun$handleFetchRequest$4.apply(KafkaApis.scala:637)
        at kafka.server.KafkaApis$$anonfun$handleFetchRequest$4.apply(KafkaApis.scala:637)
        at kafka.server.ReplicaManager.fetchMessages(ReplicaManager.scala:840)
        at kafka.server.KafkaApis.handleFetchRequest(KafkaApis.scala:629)
        at kafka.server.KafkaApis.handle(KafkaApis.scala:112)

The OOMs have in their stacktrace signs of Kafka partitions being converted, so I am wondering if the extra pressure was caused by the KafkaRDD client being old..

The OOMs have in their stacktrace signs of Kafka partitions being converted,

Can you explain this a bit?

The KafkaRDD implementation is indeed old, for whatever reason they never implemented 0.10+ for python, so pyspark uses the 0.8 api.

The OOMs have in their stacktrace signs of Kafka partitions being converted,

Can you explain this a bit?

Sure! What I was trying to say is that Kafka, to support old clients following old kafka protocol specs, need to convert on the fly partition's data before emitting it. This means, I think, more usage of the Heap and a likely OOM if the consumer is greedy and tries to pull a lot of data.

As a followup I've started rewriting mjolnir's usage of KafkaRDD to instead use the kafka-python library we use elsewhere (that supports the full current protocol). I'm not sure though, should client side throttling of reads be part of the update, or does it look like the root cause here was the OOM's caused by downgrading the records to the 0.8 compatible version?

@EBernhardson while having client quotas might be something we want to look at but the priority on our end (I think) should be to see if there is a setting in kafka to not accept "older" protocol connections as from luca's troubleshooting seems the conversion among protocols is the root cause of the OOMs

Trying to assess the data loss for webrequest upload. We have refined the hour 22 with a higher threshold, so I executed the following queries:

select substr(dt, 12, 5) as minute, count(*)  from webrequest where webrequest_source='upload' and year=2019 and month=4 and day=1 and (hour=18 or hour=19 or hour=20) group by substr(dt, 12, 5) order by minute limit 200;

select substr(dt, 12, 5) as minute, count(*)  from webrequest where webrequest_source='upload' and year=2019 and month=4 and day=1 and (hour=21 or hour=22 or hour=23) group by substr(dt, 12, 5) order by minute limit 200;

select substr(dt, 12, 5) as minute, count(*)  from webrequest where webrequest_source='upload' and year=2019 and month=4 and day=2 and hour=00 group by substr(dt, 12, 5) order by minute limit 200;

The intent was to group number of requests landed to Kafka and group their count by minute. These are the interesting bits:

19:15	2419240
19:16	2430943
19:17	2431184
19:18	2442969
19:19	2459031
19:20	2462175
19:21	2436623
19:22	2445800
19:23	2444202
19:24	2426503
19:25	2428125
19:26	2446914
19:27	2438145
19:28	2356491
19:29	1785956     <=============
19:30	2195735
19:31	2314247
19:32	2358862
19:33	2279158
19:34	2343046
19:35	2383533
19:36	2411476
19:37	2409328
19:38	2426264
19:39	2413804
19:40	2424570
19:41	2420369
19:42	2411204
19:43	2399167
19:44	2426796
19:45	2434981
21:50	1875470
21:51	1871650
21:52	1858812
21:53	1853846
21:54	1859506
21:55	1855496
21:56	1852868
21:57	1837458
21:58	1831104
21:59	1814925
22:00	1799444
22:01	1775813
22:02	1793169
22:03	1771776
22:04	1770142
22:05	1748399
22:06	1741401
22:07	1729986
22:08	1752347
22:09	1744588
22:10	1742729
22:11	1596775    <==============
22:12	940385      <==============
22:13	871611      <==============
22:14	1000716    <==============
22:15	1179108     <==============
22:16	1210943     <==============
22:17	1502035      <==============
22:18	1605365
22:19	1628680
22:20	1643520
22:21	1634755
22:22	1649634
22:23	1644900
22:24	1641887
22:25	1637894
22:26	1639733
22:27	1649218
22:28	1640572
22:29	1634634
22:30	1633748
22:31	1629227
22:32	1619159
22:33	1602754
22:34	1605825
22:35	1603303
22:36	1606719
22:37	1605139
22:38	1612410
22:39	1608878
22:40	1584580
22:41	1588343
22:42	1569479
22:43	1570394
22:44	1548758
22:45	1560362
22:46	1548676
22:47	1562032
22:48	1551898
22:49	1563161
22:50	1581057
22:51	1569724
22:52	1545217
22:53	1556944
22:54	1550715
22:55	1573204
22:56	1540154
22:57	1553260
22:58	1545842
22:59	1528666
23:00	1523499
23:01	1509909
23:02	1506325
23:03	1508439
23:04	1506983
23:05	1502805
23:06	1487522
23:07	1492191
23:08	1508652
23:09	1494541
23:10	1499356
23:11	1490464
23:12	1503679
23:13	1480568
23:14	1488236
23:15	1473075
23:16	1463256
23:17	1462131
23:18	1474425
23:19	1475334
23:20	1481570
23:21	1478035
23:22	1482042
23:23	1477306
23:24	1487614
23:25	1473982
23:26	1464421
23:27	1457676
23:28	1459803
23:29	1457177
23:30	1463739
23:31	1460789
23:32	1445781
23:33	1455185
23:34	1445469
23:35	1459110
23:36	1449040
23:37	1437042
23:38	1440389
23:39	1441869
23:40	1456222
23:41	1451030
23:42	1422285
23:43	1448291
23:44	1437454
23:45	1419830
23:46	1406138
23:47	1410467
23:48	1385055
23:49	1412486
23:50	1399409
23:51	1428960
23:52	1422146
23:53	1397499
23:54	1270737
23:55	1391301
23:56	1422545
23:57	1421193
23:58	1429917
23:59	1432384
00:00	1425073
00:01	1420022
00:02	1434380
00:03	1438276
00:04	1440921
00:05	1443584
00:06	1445700
00:07	1454559
00:08	1445574
00:09	1451519
00:10	1463048
00:11	1477091
00:12	1480916
00:13	1468046
00:14	1458306
00:15	1466187
00:16	1453570
00:17	1462661
00:18	1458685
00:19	1471500
00:20	1484269

Now for text:

19:21	5180607
19:22	5160837
19:23	5214087
19:24	5200381
19:25	5174572
19:26	5226006
19:27	5192289
19:28	4843832  <=======
19:29	1810308  <=======
19:30	4530043  <=======
19:31	3239163  <=======
19:32	4061366  <=======
19:33	4520524  <=======
19:34	4598843  <=======
19:35	4342754  <=======
19:36	5008963
19:37	5039814
19:38	5086566
19:39	5085608
19:40	5105877
21:40	4070770
21:41	4060746
21:42	4054487
21:43	4022028
21:44	4019680
21:45	4015483
21:46	3978061
21:47	3985091
21:48	3944017
21:49	3941497
21:50	3998801
21:51	3964099
21:52	3940359
21:53	3950531
21:54	3929903
21:55	3928995
21:56	3917504
21:57	3875873
21:58	3835025
21:59	3835692
22:00	3805283
22:01	3784494
22:02	3784879
22:03	3755248
22:04	3743575
22:05	3738118
22:06	3731844
22:07	3736056
22:08	3763520
22:09	3771431
22:10	3763541
22:11	3368688
22:12	922343      <========
22:13	1591422    <========
22:14	1993920    <========
22:15	1764617    <========
22:16	1548214    <========
22:17	2309848    <========
22:18	3064919    <========
22:19	3459716
22:20	3510909
22:21	3499772
22:22	3511755
22:23	3513969
22:24	3529297
22:25	3520837
22:26	3517232
22:27	3516900
22:28	3486134
22:29	3465769
22:30	3473458
22:31	3461901
22:32	3431695
22:33	3404139
22:34	3408074
22:35	3411092
22:36	3403083
22:37	3491599
22:38	3632350
22:39	3531597
22:40	3483267
22:41	3451808
22:42	3442420
22:43	3408056
22:44	3394712
22:45	3400072
22:46	3394444
22:47	3392683
22:48	3372910
22:49	3362145
22:50	3374379
22:51	3381480
22:52	3351067
22:53	3370542
22:54	3420659
22:55	3461647
22:56	3424143
22:57	3360418
22:58	3304679
22:59	3293221
23:00	3284592
23:01	3277662
23:02	3282577
23:03	3275544
23:04	3257659
23:05	3248706
23:06	3258166
23:07	3270064
23:08	3306196
23:09	3272338
23:10	3264822
23:11	3244204
23:12	3271814
23:13	3244025
23:14	3236187
23:15	3255606
23:16	3241303
23:17	3236851
23:18	3225940
23:19	3214896
23:20	3214856
23:21	3209556
23:22	3230562
23:23	3250684
23:24	3248697
23:25	3253694
23:26	3248492
23:27	3223473
23:28	3210310
23:29	3209685
23:30	3200441
23:31	3196229
23:32	3178000
23:33	3162749
23:34	3169987
23:35	3168993
23:36	3163786
23:37	3183572
23:38	3198867
23:39	3200369
23:40	3201922
23:41	3198794
23:42	3220750
23:43	3174458
23:44	3163284
23:45	3169945
23:46	3120224
23:47	2892801
23:48	2799172
23:49	2739535
23:50	2895980
23:51	3074432
23:52	3099412
23:53	2801206
23:54	2845483
23:55	3078672
23:56	3162598
23:57	3185638
23:58	3177801
23:59	3165109
00:00	3202369
00:01	3189672
00:02	3244891
00:03	3226870
00:04	3226144
00:05	3230042
00:06	3228851
00:07	3307593
00:08	3335088
00:09	3337810
00:10	3331551
00:11	3344304
00:12	3342865
00:13	3320260
00:14	3324786
00:15	3328413
00:16	3311804
00:17	3303015
00:18	3307147

Checking from what oozie's data loss email report:

text 2019-04-01-19 -> 921 requests (0.0% of total) have incomplete records. 8647914 requests (2.815% of valid ones) were lost.

text 2019-04-01-22 -> 673 requests (0.0% of total) have incomplete records. 21196187 requests (9.766% of valid ones) were lost.
upload 2019-04-01-22 -> 0 requests (0.0% of total) have incomplete records. 6668097 requests (6.629% of valid ones) were lost.

text 2019-04-01-23 -> 497 requests (0.0% of total) have incomplete records. 7958942 requests (4.011% of valid ones) were lost.
upload 2019-04-01-23 -> 0 requests (0.0% of total) have incomplete records. 2877023 requests (3.189% of valid ones) were lost.

@Nuria I don't think that we lost so much data as outlined in the incident report: we had loss but not all the brokers were down, that is a good news for us!

@elukey on webrequest I would expect partial data loss. On eventlogging however I would expect total loss for ~1hr as the brokers on eqiad were at somepoint all not receiving connections

From eventlogging event.navigationtiming data (see no data for hour 23 on 2019/04/01)

2019-04-01T22 22:01 500
2019-04-01T22 22:00 525
2019-04-01T22 22:16 8
2019-04-02T00 00:21 476
2019-04-02T00 00:59 526
2019-04-02T00 00:58 514
2019-04-02T00 00:57 492
2019-04-02T00 00:56 537

From eventlogging event.navigationtiming data (see no data for hour 23 on 2018/04/01)

2019-04-01T22 22:01 500
2019-04-01T22 22:00 525
2019-04-01T22 22:16 8
2019-04-02T00 00:21 476
2019-04-02T00 00:59 526
2019-04-02T00 00:58 514
2019-04-02T00 00:57 492
2019-04-02T00 00:56 537

Ah ok so you meant the topics related to each single schema, that makes sense since they have only one partition (so I guess it is easier to loose data if brokers are in trouble). What I meant with eventlogging data is the eventlogging-client-side topic:

https://grafana.wikimedia.org/d/000000234/kafka-by-topic?from=1554140031687&to=1554185183750&orgId=1&var-datasource=eqiad%20prometheus%2Fops&var-kafka_cluster=jumbo-eqiad&var-kafka_broker=All&var-topic=eventlogging-client-side

I am wondering if re-running the eventlogging processors on the data, now that we have everything working properly, could add more data to the single schema topics (like navigation timing).

https://wikitech.wikimedia.org/wiki/Analytics/Systems/EventLogging/Backfilling#Backfilling_a_kafka_topic -> Never done it so I'd wait @Ottomata 's opinion before proceeding :)

@EBernhardson tried yesterday a modified version of his job to see if the problem was resolved. While the first run was ongoing, Icinga alerted about Varnishkafka delivery errors. I started to investigate and didn't find anything suspicious from the Kafka point of view, but after reviewing Varnishkafka metrics I found something strange in TLS latencies, namely kafka-jumbo1005 was showing seconds of min/avg/max TLS latencies. After checking varnishkafka's logs on the caching hosts that alarmed, I found out that all the timeouts were due to contacting jumbo 1005.

The msg_size and msg_count metrics in the Varnishkafka dashboard were also off (the first two graphs on the top), since they were showing for example several megabytes for each cp host. I took a look again to librdkafka's statistics and their meaning and I have renamed the title of the first two graphs in:

  • Number of messages in the producer's queue
  • Total size of messages in the producer's queue

In my opinion this is clearer and tells us a better story - for some reason the caching nodes were accumulating a big backlog of messages (remember that librdkafka's producer is async, sending an event to kafka simply means putting it into a send queue) and that was matching with spikes in TLS latencies.

I checked kafka graphs and one struck me: the brokers preferred replica imbalance count (maintained by the Broker acting as Controller) was showing ~15 partitions, so I have issued a preferred-replica-election to see if anything needed to be done after the outage. And the magic happened:

https://grafana.wikimedia.org/d/000000253/varnishkafka?orgId=1&from=1554288117481&to=1554323699224

Erik re-tried his job and everything went fine, no issue this time.

Joseph brought also up a good point that probably turning kafka in/out graphs from stacked to simple line would have shown an imbalance, and he was right:

Screen Shot 2019-04-04 at 9.23.25 AM.png (1×2 px, 209 KB)

vs

Screen Shot 2019-04-04 at 9.24.13 AM.png (1×2 px, 196 KB)

I took the liberty of adding non-stacked graphs to the kafka dashboard: https://grafana.wikimedia.org/d/000000027/kafka?refresh=5m&orgId=1&from=now-24h&to=now

Follow up questions on my mind:

  • It took a simple imbalance of partition leaders to cause a big variation in the behavior of latency sensitive Kafka producers like Varnishkafka.
  • Are we hitting any limit in bandwidth usage? Possibly tx? I started ifstat in tmux on each kafka-jumbo host to get per-second values and see if we have spikes here and there. Maybe 1G NICs are not enough and we'd need 10G ?
  • Related to the above - if it is not bandwidth, maybe we reached a point in which 6 brokers are not enough to sustain all the traffic that we are handling in Jumbo?

@elukey Nice, so the unbalanced partitios were putting too much pressure on kafka when erik's consumer was active and thus the varnishkafka producers were enquqeing too many messages and eventually timing out.

FWIW here's network traffic on kafka-jumbo1005 for the same timeframe as elukey's graphs:
https://grafana.wikimedia.org/d/000000377/host-overview?refresh=5m&orgId=1&var-server=kafka-jumbo1005&var-datasource=eqiad%20prometheus%2Fops&var-cluster=kafka_jumbo&from=1554288117481&to=1554323699224&panelId=8&fullscreen

It does look like there is some headroom on the network links: 80MByte/sec =~ 0.64 Gigabit/sec. I'm not sure that the numbers here, which come from the kernel, include framing overhead and such -- but even if they don't, we can expect a theoretical 116MByte/sec (no Ethernet jumbo frames, and using TCP)**.

But you'd want to upgrade these systems to 10G (or add more of them) before the input grows by another 20-30%.

**: https://www.cablefree.net/wireless-technology/maximum-throughput-gigabit-ethernet/

Some info from ifstat (I have isolated occurrences of tx bandwidth >= 600000 Kbps)

elukey@kafka-jumbo1001:~$  cat ifstat.log | awk '{print $1" "$3}' | egrep '[0-9][0-9]:[0-9][0-9]:[0-9][0-9]\ [6789][0-9]{5}'
14:05:46 632704.3
16:20:30 629088.6
16:20:47 603600.4
17:20:34 612584.2
18:40:49 600464.4
elukey@kafka-jumbo1002:~$  cat ifstat.log | awk '{print $1" "$3}' | egrep '[0-9][0-9]:[0-9][0-9]:[0-9][0-9]\ [6789][0-9]{5}'
13:11:01 644088.4
13:12:33 607817.1
13:12:39 656682.8
13:12:42 604656.3
14:11:52 603080.4
14:11:57 620543.1
14:12:12 624919.0
14:12:18 638037.0
14:14:32 601021.2
15:00:34 626689.3
15:12:38 637987.9
15:12:40 718790.1     <=========
15:21:15 622496.3
16:11:02 614094.3
16:11:29 603539.2
16:11:37 601896.0
16:12:16 630261.1
16:12:23 635297.8
16:12:24 620043.6
16:12:33 600684.1
17:20:46 617687.7
19:10:39 600021.8
20:05:30 600534.0
20:11:02 602346.1
20:20:34 611835.2
elukey@kafka-jumbo1003:~$  cat ifstat.log | awk '{print $1" "$3}' | egrep '[0-9][0-9]:[0-9][0-9]:[0-9][0-9]\ [6789][0-9]{5}'
08:21:45 683320.2
08:21:46 651289.5
12:21:33 636653.0
13:20:55 603877.7
13:21:13 612583.9
14:05:26 619636.9
14:05:33 610348.7
14:05:35 639012.4
14:21:54 604466.3
14:22:20 633133.2
15:05:34 646739.1
15:20:54 707982.4
15:21:25 624481.9
15:21:45 601293.2
16:05:28 647263.7
16:20:41 605067.9
16:21:34 610198.2
17:05:28 606227.3
17:05:36 620695.0
17:11:27 637107.5
18:40:34 605707.7
18:41:40 622810.6
19:05:30 617019.8
19:21:07 627580.9
19:21:40 636294.3
19:21:44 622521.3
19:22:00 605131.5
20:05:24 628037.9
20:21:55 617896.5
21:05:25 671992.1
21:21:43 611194.2
22:05:28 615253.9
03:05:27 607627.5
elukey@kafka-jumbo1004:~$  cat ifstat.log | awk '{print $1" "$3}' | egrep '[0-9][0-9]:[0-9][0-9]:[0-9][0-9]\ [6789][0-9]{5}'
09:20:35 603652.0
12:01:29 603013.6
12:11:27 602002.9
12:21:19 619217.5
13:01:04 617516.1
13:05:46 605085.1
13:05:49 606640.4
13:06:02 621135.1
13:12:00 624325.7
13:20:56 667463.9
13:51:45 603387.9
13:51:58 600114.1
14:05:29 637962.8
14:05:30 637790.0
14:05:36 620309.1
14:05:38 615665.3
14:05:39 625381.8
14:05:41 608139.2
14:05:44 610666.0
14:05:45 602236.3
14:05:46 632438.9
14:05:47 614234.1
14:05:48 623752.8
14:05:51 646204.7
14:05:52 615011.9
14:05:53 627598.8
14:05:55 610755.8
14:21:13 618100.7
14:21:16 600016.6
14:21:30 614927.5
15:05:30 625578.7
15:05:32 675560.2
15:05:37 602068.7
15:05:42 613848.1
15:10:52 619398.7
15:10:55 603836.4
15:10:57 626943.6
15:10:59 616543.6
15:11:09 614354.9
15:11:17 602830.3
15:11:21 611260.0
15:11:32 604005.9
15:11:53 631741.6
15:20:45 615573.7
15:21:19 658733.5
15:21:41 629970.2
15:22:04 622677.4
15:40:46 605031.8
16:05:26 671102.5
16:05:28 654116.5
16:05:29 615440.4
16:05:30 607354.1
16:05:31 606574.3
16:05:36 632130.4
16:05:37 627740.3
16:05:39 631759.0
16:05:41 607700.2
16:05:43 602839.0
16:05:46 630359.1
16:05:50 650551.2
16:05:51 601702.3
16:05:52 622521.0
16:05:53 647530.4
16:05:56 614249.6
16:05:57 635313.7
16:21:41 702128.2
16:21:48 643637.8
16:21:49 747767.9
16:21:50 649471.7
17:01:13 619636.6
17:05:35 628194.8
17:05:36 625778.3
17:05:38 659420.9
17:05:40 665940.9
17:05:41 607094.4
17:05:42 616505.4
17:05:43 650122.7
17:05:44 629648.4
17:05:45 622563.7
17:05:46 657761.6
17:05:47 658860.6
17:05:49 668011.0
17:05:53 623338.0
17:05:54 636396.0
17:05:56 629900.7
17:05:57 602351.9
17:21:49 611907.8
17:21:51 805023.7
17:41:28 605192.9
18:06:49 603669.0
18:06:51 605556.0
18:06:52 625566.7
18:06:53 624363.9
18:06:54 602173.2
18:06:55 641067.4
18:06:57 605224.0
18:06:58 612399.2
18:07:02 607571.1
18:07:04 638016.6
18:10:40 603249.0
18:21:55 631235.3
19:05:24 632115.9
19:05:26 651883.4
19:05:27 669015.5
19:05:30 633261.5
19:05:32 609170.1
19:05:33 627920.6
19:05:35 626383.1
19:05:36 642468.7
19:05:39 642322.8
19:05:40 629751.7
19:05:41 628185.3
19:05:42 619408.9
19:05:43 656581.0
19:05:44 627587.4
19:05:45 627022.4
19:20:38 652072.4
19:21:20 663525.2
19:21:57 703041.0
19:22:00 621878.5
19:22:01 810537.6
19:22:02 688187.3
19:31:13 615371.0
20:05:26 645786.7
20:05:30 603704.5
20:05:33 654045.2
20:05:34 629664.7
20:05:35 605671.7
20:05:38 625053.5
20:05:40 612488.2
20:05:41 627469.7
20:05:44 643640.7
20:05:45 613051.4
20:05:46 612066.3
20:05:47 606894.0
20:05:48 610274.5
20:05:49 606192.8
20:05:51 619731.1
20:05:52 601789.7
20:20:32 620207.7
20:21:47 666764.4
20:21:48 765245.4     <=========
20:21:49 885008.4     <=========
20:21:50 682260.6     <=========
21:05:34 628015.8
21:05:37 617071.2
21:05:46 609258.0
21:21:38 673286.6
21:21:46 669772.9
21:21:48 688112.6
07:05:27 629602.1
08:05:33 631650.8
08:05:35 617612.4
08:05:36 613044.2
elukey@kafka-jumbo1005:~$  cat ifstat.log | awk '{print $1" "$3}' | egrep '[0-9][0-9]:[0-9][0-9]:[0-9][0-9]\ [6789][0-9]{5}'
11:05:31 610314.4
14:05:32 632673.3
14:05:38 602617.4
14:05:43 623252.3
16:05:35 602959.3
16:05:36 622550.6
16:05:40 601443.9
16:05:47 608641.7
16:05:51 616080.5
19:05:37 618580.7
20:05:31 616129.6
20:05:45 606264.1
20:05:51 600930.6
elukey@kafka-jumbo1006:~$  cat ifstat.log | awk '{print $1" "$3}' | egrep '[0-9][0-9]:[0-9][0-9]:[0-9][0-9]\ [6789][0-9]{5}'
08:05:26 607874.3
10:05:40 630108.4
11:05:27 639295.4
13:05:33 628809.9
13:05:35 639011.7
13:05:45 619026.6
13:06:02 647855.9
14:05:25 629274.9
14:05:26 677129.2
14:05:28 606822.7
14:05:29 695572.4     <=========
15:05:26 680237.2
15:05:28 645120.6
15:05:29 637053.3
15:05:30 633277.7
15:05:42 611080.8
15:05:50 600370.3
15:06:02 601221.2
15:33:24 622068.5
16:05:26 615934.0
16:05:27 616469.3
16:05:38 616981.8
16:05:39 632261.3
16:05:49 626636.5
16:05:50 624248.9
16:05:59 617789.6
16:06:00 642420.3
17:05:27 612151.6
17:05:28 632681.7
17:05:29 625081.0
17:05:31 623197.0
18:06:43 606826.1
19:05:25 687014.6     <=========
19:05:26 600877.7
19:05:27 618728.8
19:05:32 603733.3
19:05:33 608222.6
19:05:37 607782.4
19:05:43 601964.8
19:05:45 601405.4
19:05:47 610100.9
20:05:26 685654.3
20:05:38 640079.2
21:05:23 601035.4
21:05:24 621619.9
21:05:26 672578.6
22:05:24 616946.1
22:05:25 622107.8
22:05:26 637960.1
02:05:27 643328.3
03:05:28 646809.0
04:05:26 619643.5
08:05:27 615152.6
08:05:28 653073.0

In my opinion we either need to use 10G or increase the number of jumbo brokers. Probably both is a good way to go :) @Ottomata

But you'd want to upgrade these systems to 10G (or add more of them) before the input grows by another 20-30%.

T214080: Rewrite Avro schemas (ApiAction, CirrusSearchRequestSet) as JSONSchema and produce to EventGate will increase traffic to kafka jumbo by about 6% too. Interesting! 10G is a good idea in general. Was network our bottleneck for this outage? It sounds like maybe it wasn't? If not then adding a couple more brokers next FY is probably a a good idea. We could order those with 10G and then eventually replace the others with 10G when they phase out?

I haven't got any proof of tx bandwidth saturated so cannot say it for sure, buuut I have the suspicion that it might have for bursts of few seconds (that we cannot detect with our current 5 mins metrics). I'd prefer to add 10G everywhere if possible asap if the SRE team agrees, it should be a matter of adding a 10G card + moving the host in the right rack (network equipment's availability needs to be checked of course).

Atm I am seeing only one broker with very high tx bandwidth usage:

elukey@kafka-jumbo1004:~$  cat ifstat.log | awk '{print $1" "$3}' | egrep '[0-9][0-9]:[0-9][0-9]:[0-9][0-9]\ [89][0-9]{5}'
17:21:51 805023.7
19:22:01 810537.6
20:21:49 885008.4
17:22:00 879897.9
15:21:53 827064.7
17:21:55 827993.5

Those are 1s bursts, similar to what I was seeing with memcached. Latency sensitive clients (like Varnishkafka) probably get affected by them, and those are an indicator that we need to do something asap in my opinion..

Actually, this makes sense. I think Erik's job was consuming a fixed interval from the past. Since all those messages are available at once, Kafka will try to serve them up as fast as possible. If are actively within 80% of nic saturation, then it could have been a bottleneck during Erik's job. Also, large amounts historical message consumption will cause heavy disk IO, which would not have helped the situation.

Added request for more brokers to our hardware asks for next year

Ottomata moved this task from Next Up to Done on the Analytics-Kanban board.
Ottomata added a subscriber: Ottomata.