If you’ve ever experienced the pride of seeing your name on MediaWiki's contributor list, you've been involved in our deployment process (whether you knew it or not).
The Wikimedia deployment process — 🚂🌈 The Train — pushed over 13,000 developer changes to production in 2021 . That's more than a change per hour for every single hour of the year—24 hours per day, seven days per week!

As you deploy more software to production, you may begin to wonder: is anything I've been working on going to be deployed this week? What's the status of production? Where can I find data about any of this?
🤔 Current train info
Bryan Davis (@bd808) created the versions toolforge tool in 2017. The versions tool is a dashboard showing the current status of Wikimedia's more than 900 wikis.
Other places to find info about the current deployment:
- Deployment calendar – shows upcoming deployments happening this week and next
- Current deployment task – an indispensable tool created by @Majavah that always points to this week's train
📈 Past train data
There's an aphorism in management: you can't manage what you can't measure. For years the train chugged along steadily, but it's only recently that we've begun to collect data on its chuggings.
The train stats project started in early 2021 and contains train data going back to March 2016.
Now we're able to talk about our deployments informed by the data. Release-Engineering-Team partnered with Research late last year to explore the data we have.
We're able to see metrics like Lead time and Cycle time
We measured product delivery lead time as the time it takes to go from code committed to code running in production.
– Accelerate (pg. 14, 15)
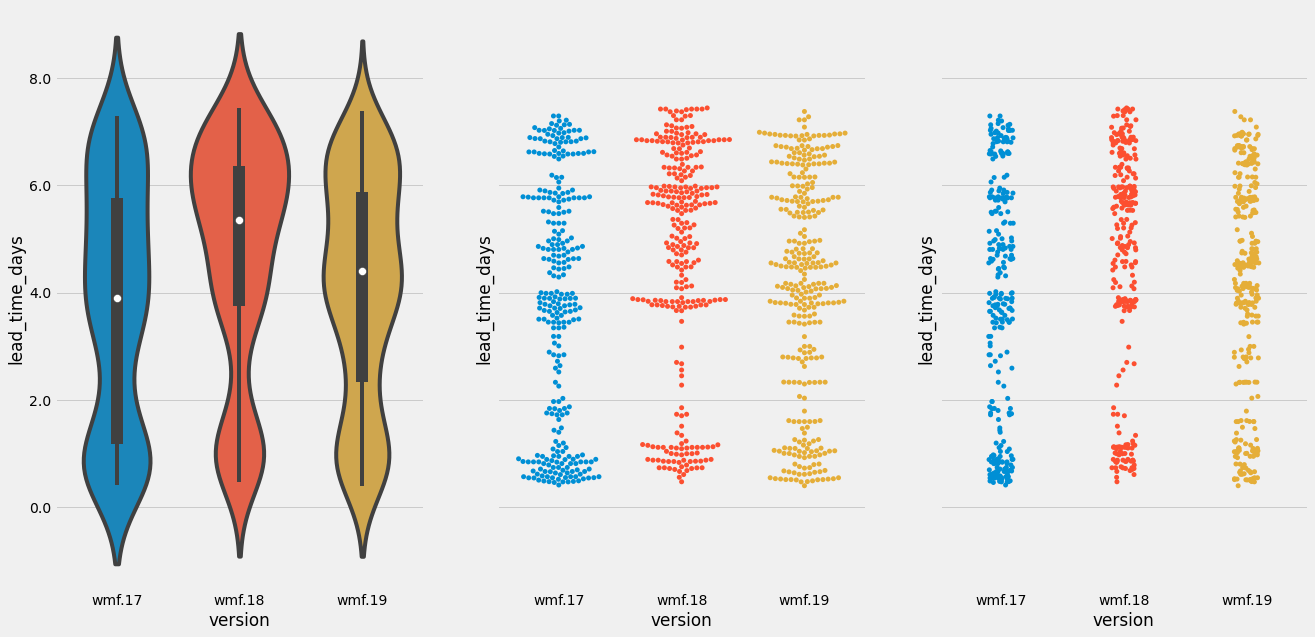
Our lead time — the time to go from commit in mainline to production — is always less than a week. In the scatter plots above, we can see some evidence of work-life balance: not many patches land two days before deployment — that's the weekend!
For the software delivery process, the most important global metric is cycle time. This is the time between deciding that a feature needs to be implemented and having that feature released to users.
– Continuous Delivery (pg 138)
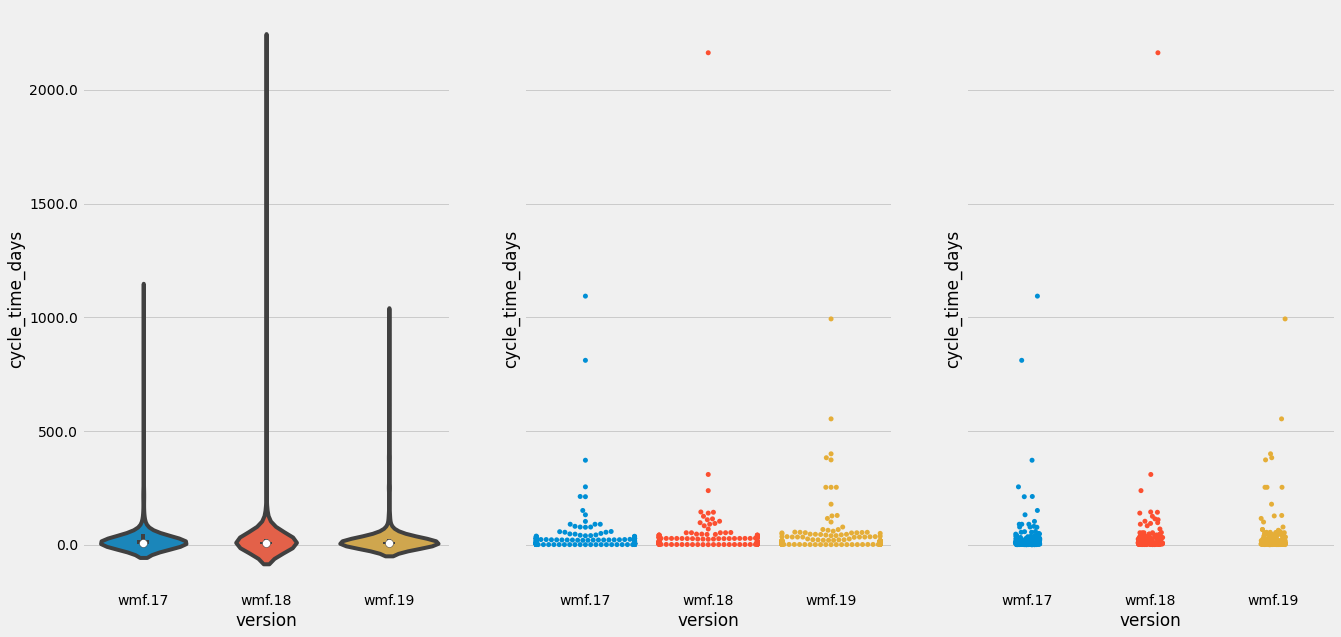
Our cycle time — the time between a patch requesting code review and its deployment — varies. Some trains have massive outliers. In the chart above, for example, you can see one train that had a patch that was five years old!
It is now possible to see what we on Release Engineering had long suspected: the number of patches for each train has slowly been ticking up over time:

Also shown above: as the number of patches continues to rise, the number of comments per patch — that is, code-review comments per patch — has dropped.
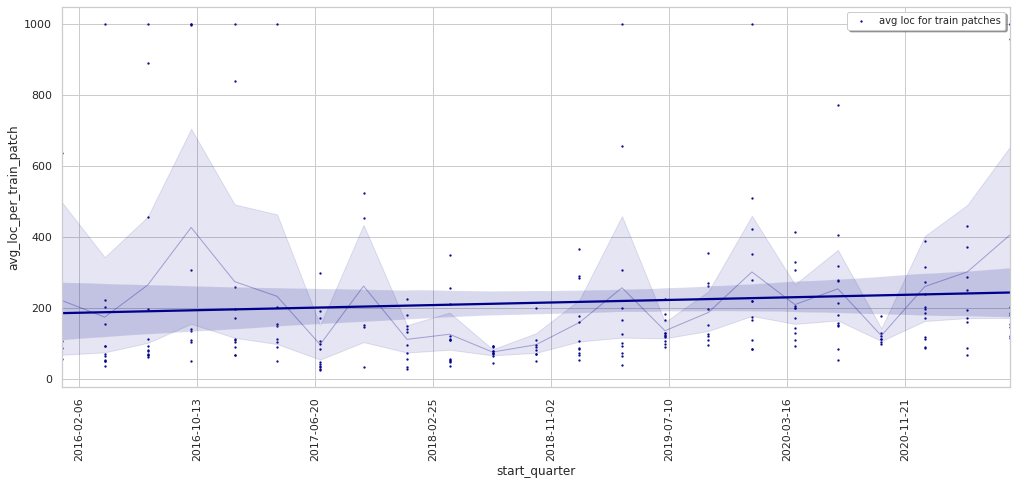
The data also show that the average number of lines of code per patch is slightly going up:
🔥 Train derailment
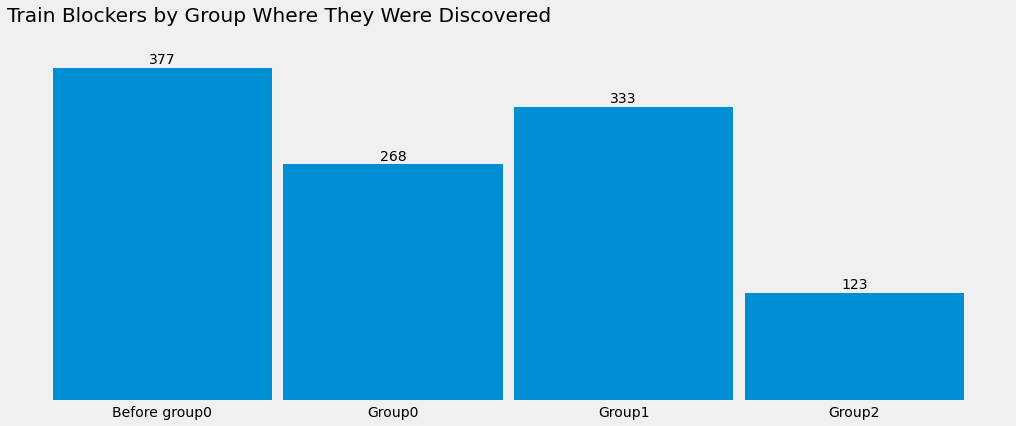
The train-stats repo has data on blockers and delays. Most trains have a small number of blockers and deploy without fanfare. Other trains are plagued by problems that explode into an endless number of blockers — cascading into a series of psychological torments, haunting deployers like the train-equivalent of ringwraiths. Trainwraiths, let’s say.

The shape of the histogram of this data shows that blockers per train follows a power law — most trains have a few blockers:
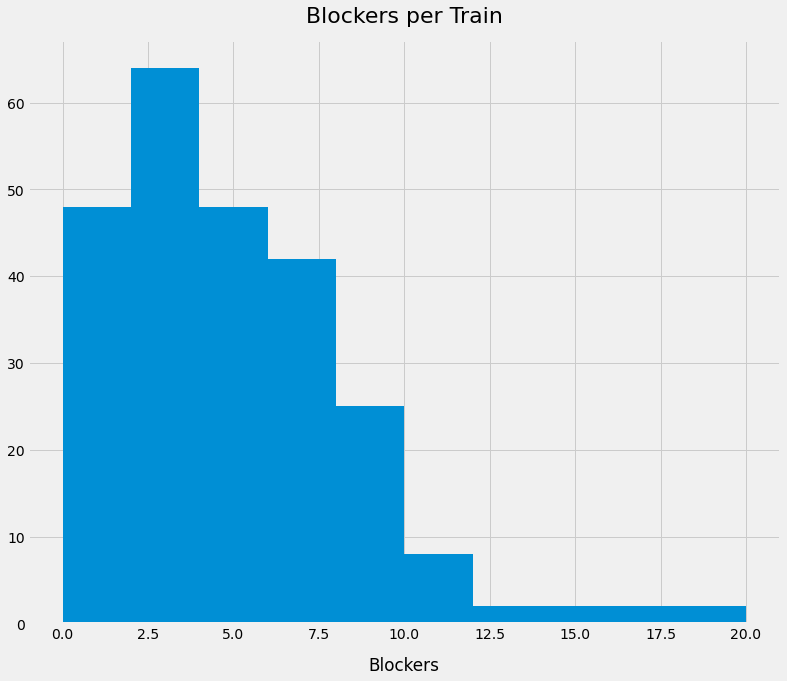
Surprisingly, most of our blockers happen before we even start a train. Bugs from the previous week that we couldn't justify halting everything to fix, but need to be fixed before we lay down more code on top.
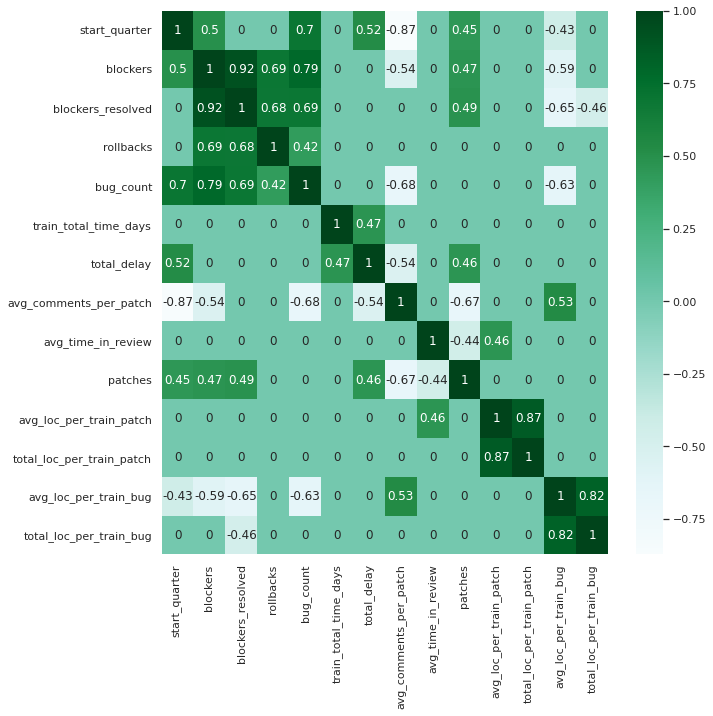
The data also let us correlate train characteristics with failure signals. Here we see that the number of patches (“patches”) per train (trending ↑) positively correlates with blockers, and lines of code review (“loc_per_train_bug”) per patch (trending ↓) negatively correlates with blockers — more patches and less code review are both correlated with more blockers:
Contrast this with Facebook's view of train risk. In a 2016 paper entitled "Development and Deployment at Facebook," Facebook's researchers documented how their Release Engineering team quantified deployment risk:
Inputs affecting the amount of oversight exercised over new code are the size of the change and the amount of discussion about it during code reviews; higher levels for either of these indicate higher risk.
– Development and Deployment at Facebook (emphasis added)
In other words, to Facebook, more code, and more discussion about code, means riskier code. Our preliminary data seem to only partially support this: more code is riskier, but more discussion seems to lessen our risk.
🧭 Explore on your own
This train data is open for anyone to explore. You can download the sqlite database that contains all train data from our gitlab repo, or play with it live on our datasette install.
There are a few Jupyter notebooks that explore the data:
- Miriam Redi's excellent exploration (where most of the charts in this post came from), and a presentation of her analysis.
- My ham-fisted attempts at data science
An audacious dream for the future of this data is to build a model to quantify exactly how risky a patchset is. We keep data on everything from bugs to rollbacks. Perhaps in future a model will help us roll out code faster and safer.
Thanks to @Miriam, @bd808, and @brennen for reading early drafts of this post: it'd be wronger without their input 💖.
- Projects
- None
- Subscribers
- Jdlrobson, Nikerabbit, dcaro and 5 others
- Tokens
Event Timeline
Awesome work!
It would be interesting to see some numbers on comments/reviews and risk, specially if there's a non-linear relationship, as I suspect that patches without reviews (or 1 approval without comments) are the riskier, and patches that have a lot of discussion/disagreement, to be risky too, the sweet spot being in-between.
That would make the statement "more discussion seems to lessen our risk" a bit more nuanced, and get closer then to the Facebook statement, as, after a few comments, having more discussion would correlate with increased risk.
I'm saying that because the amount of comments per patch at wikimedia is very low (3-4 by the likes of the graph) and afaik there's no strong policy to avoid self-merging.
It would be interesting to see some numbers on comments/reviews and risk
That would be interesting, agreed :) I'm also curious about what happens when you analyze patches that contain modifications to test files – are those more or less likely to be linked to bugs or train blockers. I would assume they are less likely to be problematic, and might be a better focus than looking at number of comments.
I'm saying that because the amount of comments per patch at wikimedia is very low (3-4 by the likes of the graph) and afaik there's no strong policy to avoid self-merging.
Hmm, that's not how I experienced onboarding to code review processes (thinking specifically of this document https://www.mediawiki.org/wiki/Gerrit/Privilege_policy#Merging_without_review) or how I perceive most teams to operate, but now I am curious. My understanding is that self-merge for production deployed code various isn't allowed / strongly discouraged, and grounds for revoking +2 rights.
Our lead time — the time to go from commit in mainline to production — is always less than a week.
Does this mean the average/median lead time? There surely are individual commits where it is more than a week. I am also assuming "production" means deployed to group2, is that correct?
This is the actual time for each individual commit from merge until deployment to anywhere in production (so group0).
This is the case because once per week we cut a new deployment branch composed of HEAD of all 190ish repos that make up a deployment, so *at most* it'll be 8 days from merge until the next deployment. (More details on the tech blog post "How We Deploy Code")
You're correct that it's a simplification to say "always", but it's correct to a first approximation.
Exceptions and caveats:
- We skip trains some weeks
- "commit in mainline" really means commit in whatever branch gerrit marks as HEAD this the mainline branch for almost all our repos, but I'm aware of one exception
- This is only true of repos we branch for the train, not those repos' submodules. The VisualEditor extension, as an example, has the VisualEditor repo as a submodule. Once mediawiki/extensions/visualeditor bumps the visualeditor submodule pointer: that change is live within a week, but that's at the discretion of VisualEditor authors rather than an automatic result of the train.
That's a great thought and I tinkered with this a bit on the repo. Open to thoughts about where to take it from here.
That is awesome!
So there's a few metrics there that are interesting (to me at least xd):
- Number of patches without review (given what @kostajh shows, that all patches should be reviewed), there's some info there in the graphs, but it's hard to visualize, a number instead might be better to see the magnitude of them (or a % of the total, or both xd).
- Distribution of comments for patches on each deploy (to compare failed and non-failed deploys, see if the distribution is different, and in what manner).
- If it's possible to link patches with blockers directly, would be interesting to see the distribution of comments for those vs the ones that did not create a blocker.
Pretty curious also about the test files.
ps. this stats are already great, and I'm in no way demanding you to get this data, it's just my personal ramblings/thoughts.
Very interesting and well presented. Thanks for digging into this data! Big plus one to @kostaj idea around correlating train blockers to changes without test. It would be good to have some data to chew on with that regard.