Project description
ve-graph is a module within the Graph extension that aims to bring graph editing tools to VisualEditor in order to bridge the gap between users and Vega, the visualization engine powering graphs in MediaWiki pages. Before, the only way for users to create and maintain graphs would be to directly alter their specification in raw wikitext, which was not only hard to grasp for beginners but also very prone to user errors. Those errors would simply render the graph unusable without offering any kind of feedback to the user as to what went wrong.
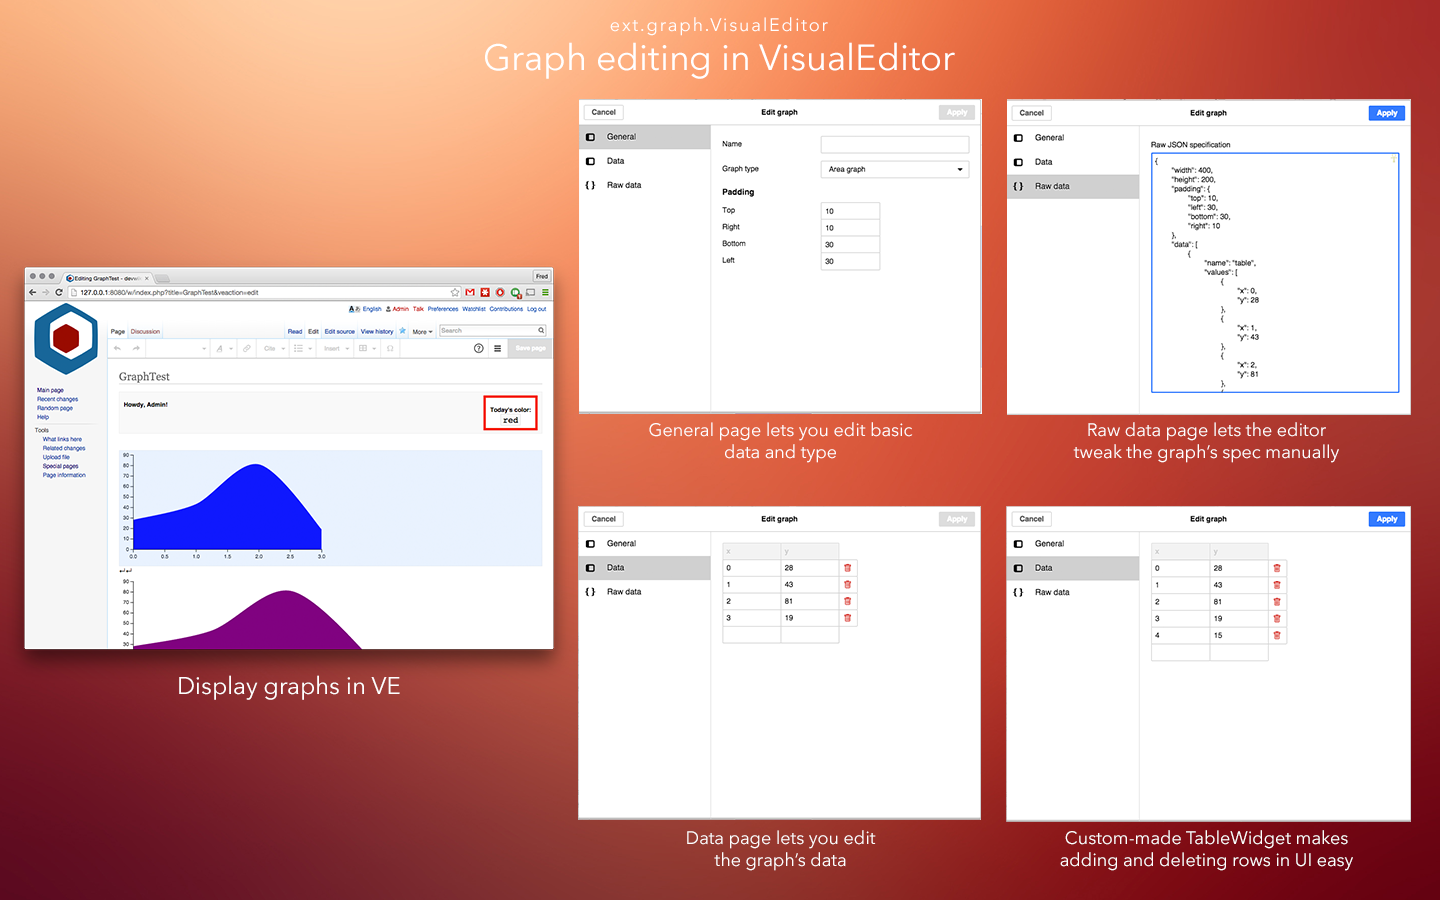
With ve-graph, it is now possible to display graphs within VisualEditor and open up a UI to edit graph types, data and padding. The UI also offers a way to edit the raw JSON specification within VE without having to switch to the classic wikitext editor, in case more advanced users want to tweak settings not supported by the UI. This first step serves as a stepping stone for many possibilities with graph editing within VisualEditor, and there are a lot of ways in which ve-graph can be improved and expanded.
Furthermore, to support my work in ve-graph, I developed a new custom widget for VE, TableWidget. This new tool allows developers to easily create independent and editable tables of data organized in RowWidgets. It is easy to hook callbacks onto these tables to listen to any data changes, as well as inject data into tables through the API, without cluttering up code with dozens of cached input widgets.
Missing features
ve-graph is the kind of project that will never truly be finished, so there can be a lot to talk about here. Here is a personal list of recommandations that would be really-nice-to-haves in VisualEditor:
- Create a graph from scratch using predefined graph templates
- Edit graph colors
- Edit axis and data entry captions (particularly useful for bar charts)
- Add pie chart and world map support
Known bugs
Demo server link
The project is for the most part already merged into MediaWiki. https://www.mediawiki.org/wiki/Extension:Graph/Demo is a good place to see graphs in action.
Resource links
- On Phabricator: Graph-VisualEditor
- On Gerrit: All my commits on Gerrit