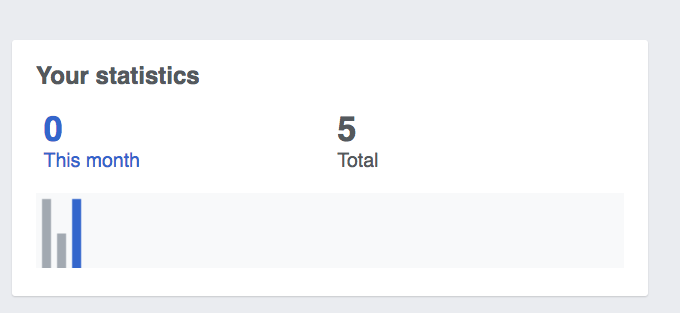
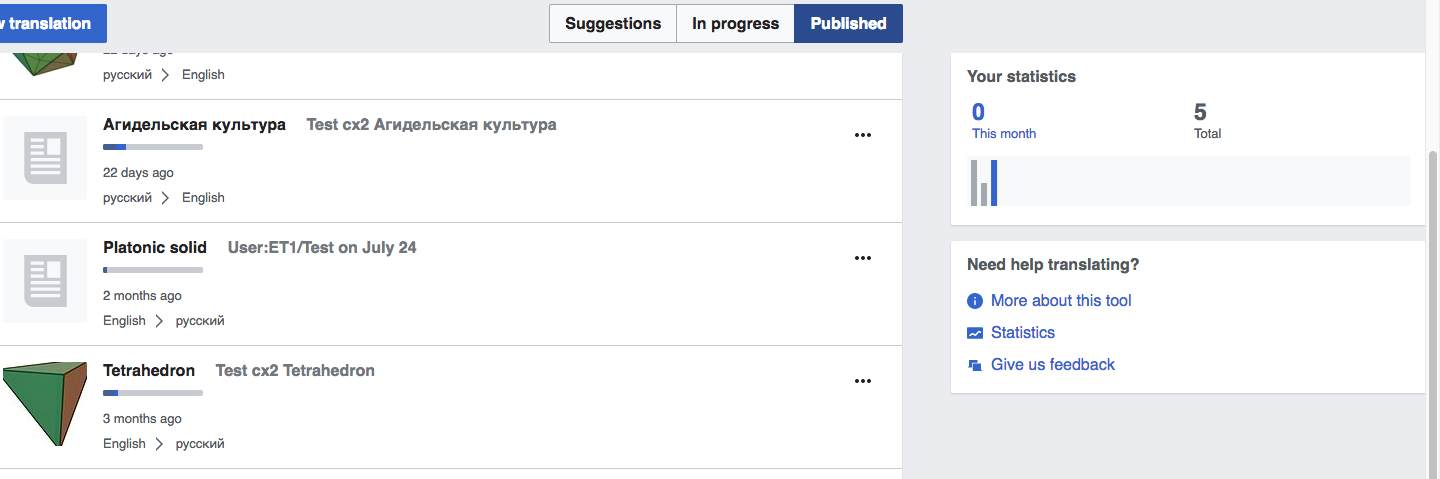
The Translation dashboard shows a bar chart to represent the user progress translating. When there are few bars these become too wide, to the point that it makes it hard to identify it as a chart:
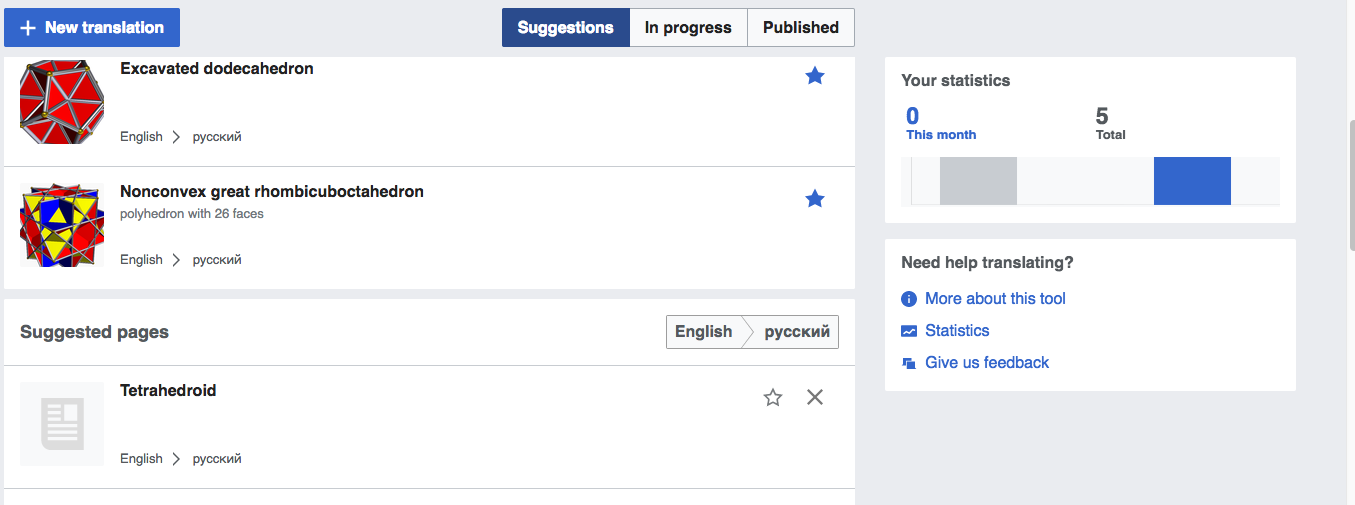
A proposal for bars to work better:
- The bars should be about 6px wide with a 3px wide separation between them.
- We don't need to show all months. If there is little room we show the bars representing the recent months, and include as much as they fit. It is ok to just show a year (12 bars) or 1.5 years (18 bars) of activity, if having a fixed maximum number of bars makes things simpler.
- The vertical axis should be slightly higher than the tallest bar for bars to reach the very top of the graph. If there is only one bar representing 1 translation, the vertical axis can go up to 5.
- The blue number should describe the blue bar. This seems to be a bug in the example screenshot, where the last month activity seems to be zero according to the label but does not look like zero according to the graph.