Repeat T179426: Identify typical time to first user interaction (in particular, generate a histogram analogous to T179426#3741859), now that we have more precise data available from the new instrumentaton (T180036). The purpose is to facilitate decisionmaking on T176211: Page Previews could load less JS on pageload.
Description
Description
| Status | Subtype | Assigned | Task | ||
|---|---|---|---|---|---|
| Resolved | • Gilles | T175916 Investigate 2017-08-29 page load time increase | |||
| Resolved | Jdlrobson | T176211 Page Previews could load less JS on pageload | |||
| Resolved | • Tbayer | T186016 Analyze time to first link interaction |
Event Timeline
Comment Actions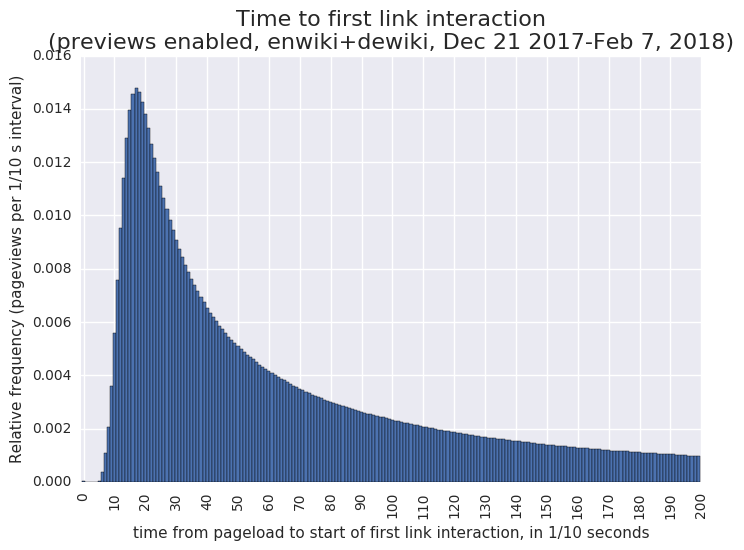
Here is an initial histogram (covering the first 20 seconds, may still need some tweaks). I'll do a cumulative one too like last time.
Data via
SELECT timetostart_bucket, COUNT(*) AS pageviews FROM (
  SELECT pagetoken, ROUND(MIN(timetointeractionstart)/100) AS timetostart_bucket FROM (
    SELECT
    event.pagetoken AS pagetoken,
    event.timestamp - event.totalInteractionTime AS timetointeractionstart
    FROM event.popups
    WHERE ((month = 12 AND day >= 21) OR (month = 1) OR (month = 2 AND day <=14) )
    AND event.action != 'pageLoaded') AS linkinteractions
  GROUP by pagetoken) AS timetostartminima
GROUP BY timetostart_bucket
ORDER BY timetostart_bucket LIMIT 10000
Comment Actions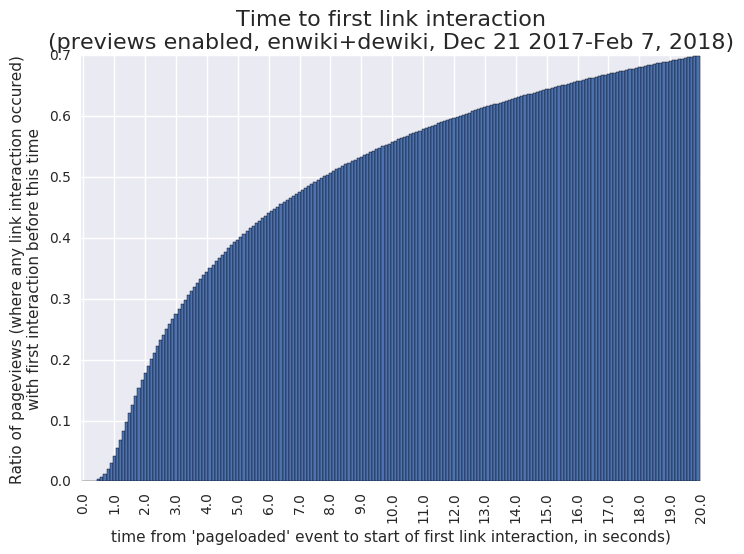
Here is the cumulative version of the above chart:
NB: frequencies refer to the set of all pageviews where a link interaction occurred, not including pageviews without any link interaction. If that's of interest too, I can produce the same charts with the y-axis changed to that baseline.
Comment Actions
That's really the origin of performance.now(), which (as documented in the schema and discussed earlier at T180036 etc.) provides the end time recorded for the link interaction, from which we subtract the interaction duration to get the start time. The x-axis legend was adapted from T179426#3741809 etc.; should have updated the wording for precision. That said, now I'm curious about the size of the difference - will check the distribution of timestamps (i..e. performance.now()values) for the schema's pageLoaded event too.
Comment Actions
Just popping in to drop this link to a detailed explanation of the time origin of HighResTimeStamps: https://developer.mozilla.org/en-US/docs/Web/API/DOMHighResTimeStamp#The_time_origin
Comment Actions
Tilman said he wants to write a comment and resolve this task but looks like this is done.
Comment Actions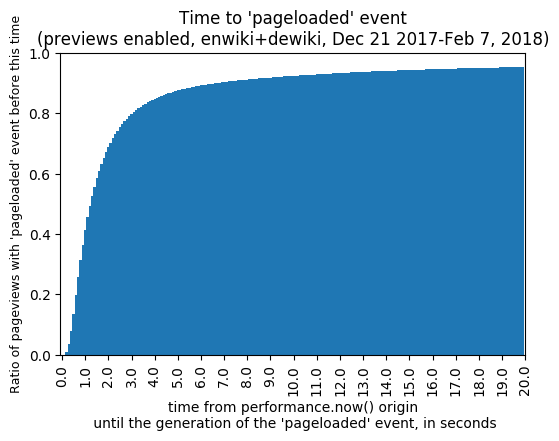

Following up here:
To recap, the purpose of this analysis was to aid decisionmaking about T176211: Page Previews could load less JS on pageload, which was achieved (see T176211#4024686 etc. - that change was deployed last year).
As discussed above, this data refers to the time from the performance.now() origin to the first hover, and we should distinguish between that and other definitions of "pageload", in particular the schema's own pageLoaded event. Above I had mused (T186016#4003680) that it would be interesting to know how much after that origin time the pageLoaded event occurs, and a couple of weeks later @Gilles made what looks like another related comment at T176211#4061121. Overall the performance.now()based data was still seen as good enough for last year's decision in that discussion. But since it may still be of interest in the future (perhaps also in context of T190037), here is how that distribution looks like:
Data via
SELECT timetoload_bucket, COUNT(*) AS pageviews FROM (
  SELECT ROUND(event.timestamp/100) AS timetoload_bucket
  FROM event.popups
  WHERE ((month = 12 AND day >= 21) OR (month = 1) OR (month = 2 AND day <=14) )
  AND event.action = 'pageLoaded') AS pageloads
GROUP BY timetoload_bucket
ORDER BY timetoload_bucket LIMIT 10000
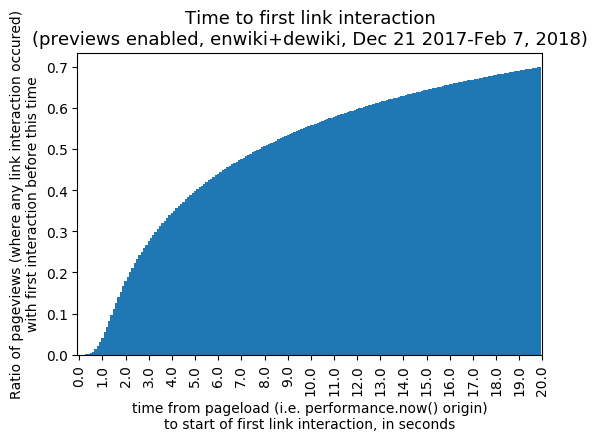
Also, here is the previous chart with the meaning of the x-axis clarified:
Comment Actions
PS: There is a detailed discussion of how various time-related fields in the Popups schema are generated at T182314#3956099 .