Background
Prior to deployment, we would like to complete the analysis of the page previews a/b test for page previews.
Acceptance criteria
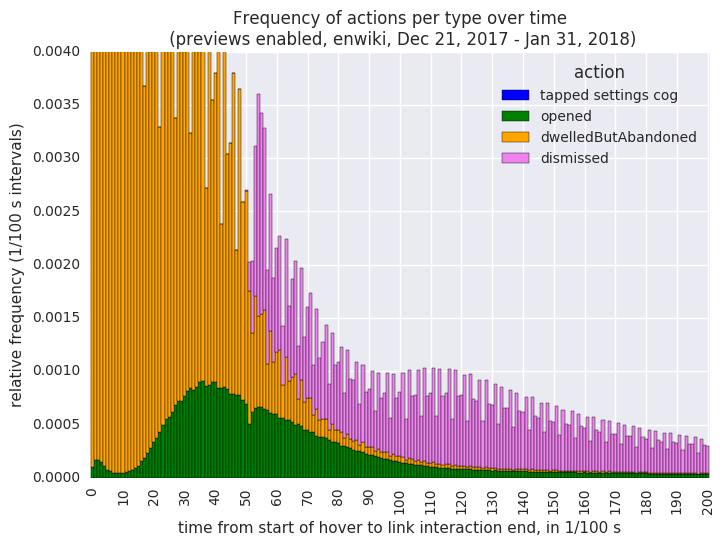
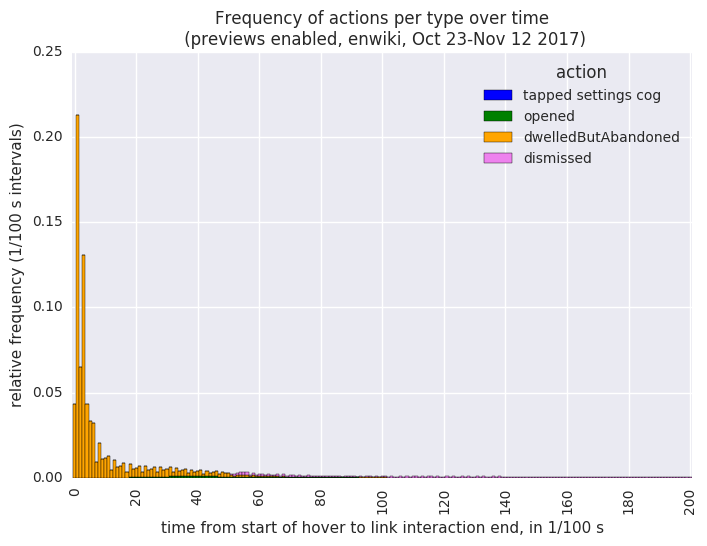
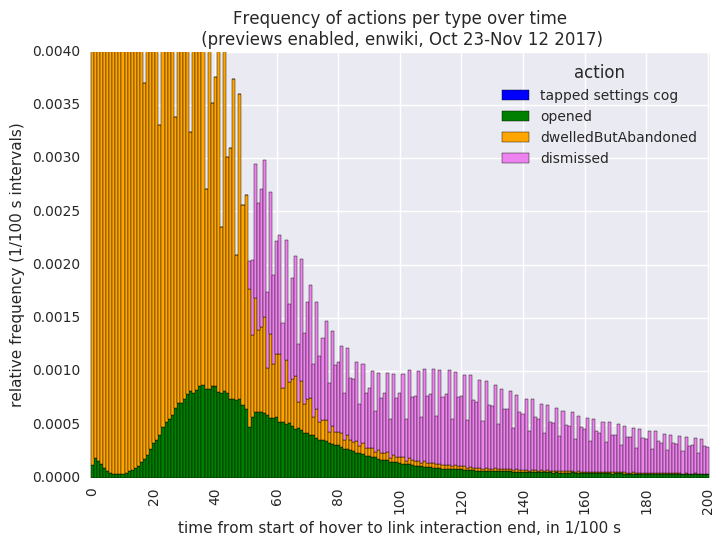
- Repeat the analysis from T139319: Analyze results of Hovercards A/B test - Hungarian/T145770: Analyze results of Hovercards A/B test - Italian and Russian for the two A/B tests on enwiki and dewiki (from October/November 2017 and December 2017-February 2018)
- Report feature performance cumulative and per-wiki:
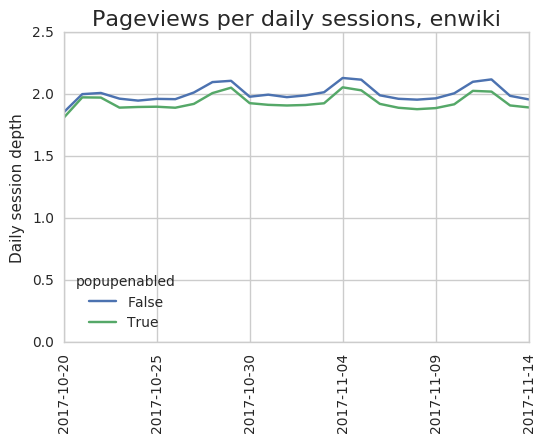
- Difference in pageviews per session --> T182314#3974663
- Difference in page interactions (pageviews + previews) per session --> T182314#4016412
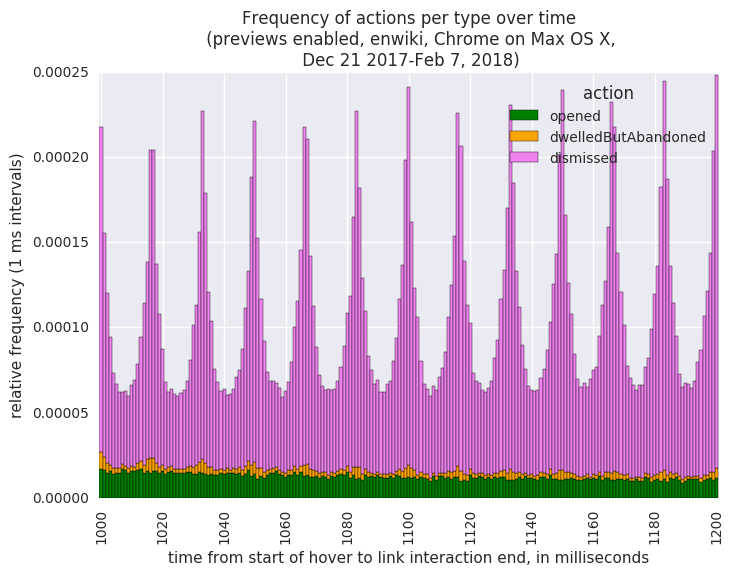
- Average cards viewed per page --> T182314#3901330
- Average cards viewed per session --> T182314#3901330
- Average number of disctinct pages interacted with per session --> T182314#4025928
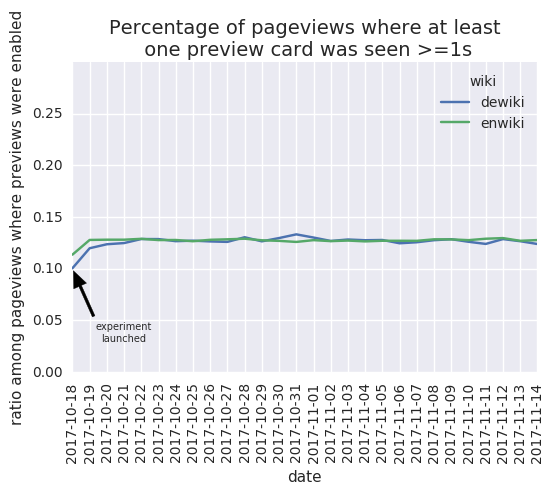
- Disable rates --> T182314#3909766 (first test), T182314#3909766 (second test)
- Usage of back button --> T144603#4010992
- Nice to have: Effects on "reading depth" (i.e time spent per page, from the ReadingDepth schema)
The main results have also been summarized at https://www.mediawiki.org/wiki/Page_Previews/2017-18_A/B_Tests .