Page MenuHomePhabricator

Analyze results of Hovercards A/B test - Hungarian
Closed, ResolvedPublic

Description

Analyze the data from the experiment launched on huwiki last month (see T134778 and Schema:Popups) regarding the following aspects:

Rate of hovercards being valuable v. disruptive

  • Do the number of links hovered per page increase or decrease?
  • --> result (with data caveat)
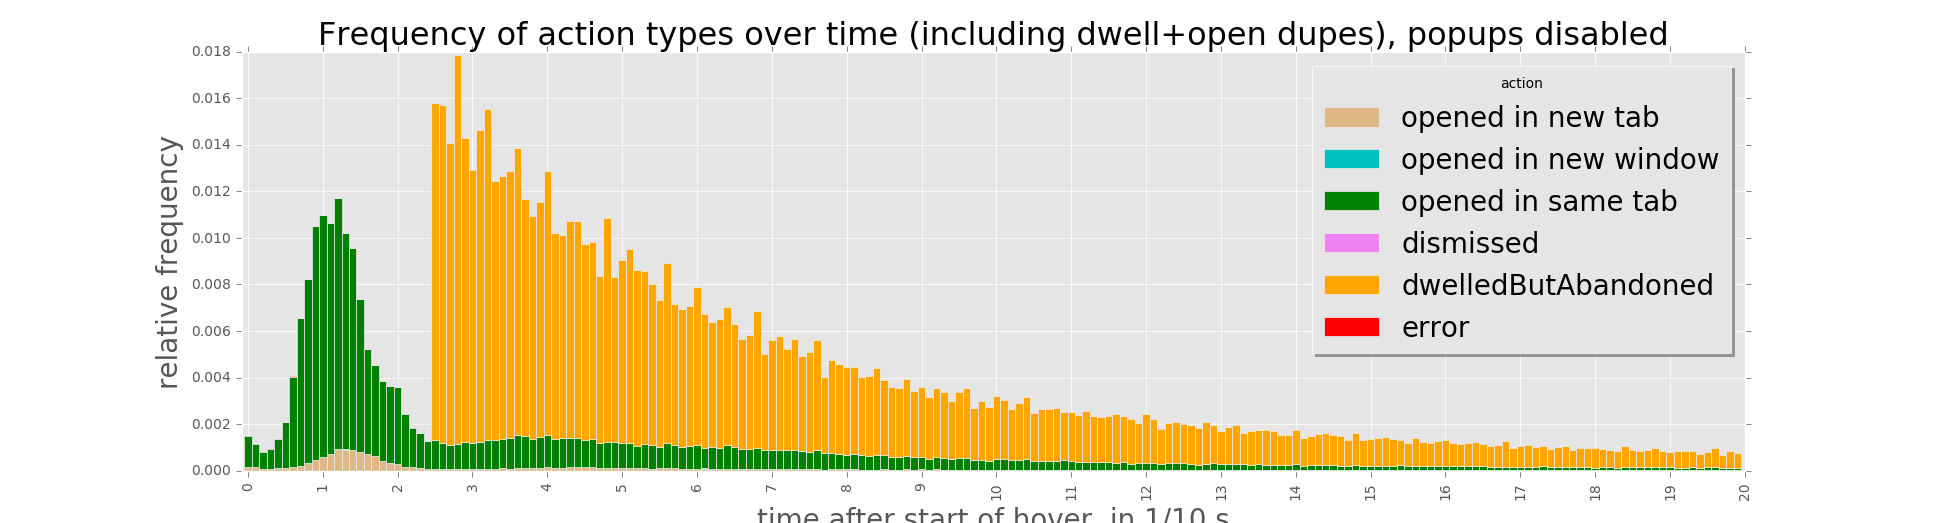
  • What is the rate of erroneous triggers? (Estimated by taking the dwelledbutAbandoned time length in control group and seeing how many are above the trigger time. Apply # of these per page to the number of hovers in experimental.)
  • --> result (with data caveat)

What % of people dislike hovercards?

  • % of sessions where people disable hovercards?
  • ^ over time
  • Distribution of # of hovers before someone disables?
  • --> result (with data caveat)

Impact on pageviews and overall engagement
(and on fundraising - being tracked at T131366)

  • What is the impact on links or hovers clicked of being in the experimental group? (one possibility to quantify this: compare the average number of clicks per page view session - i.e. the sum of all three click actions counted in the schema - divided by the number of pageLoaded events, or the number of different pageTokens recorded for all events, within a certain timespan)
  • --> result (with data caveat)
  • What is the impact on session depth (with regard to page views) of being in the experimental group? (session depth defined as e.g. the number of different pageTokens recorded for that session ID within a certain timespan. Compare averages first
  • --> result (with data caveat) about averages; perhaps compare medians too later.
  • What is the impact on the number of link interactions (as defined in the schema) per session?
  • --> result (with data caveat)
  • Same for the sum of page views (= session depth) and non-click link interactions (i.e. those that don't result in a new page view anyway), as a rough measure of overall engagement
  • --> result (with data caveat)

Are they getting in the way of people who just want the next article?

  • Calculate ratio of hovers where the reader opens the linked page after seeing the hovercard.

If 100% of the time, people continue onto article after seeing a hover, this is bad. We want to keep the ratio below 70%.
If 0% of the time people continue onto the article, that is also a sign that we are making it too hard. We want to keep this ratio above 10% of hovers where user continues onto article.

Descriptive

  • How long do people spend hovering before they click?
  • How long do people spend hovering before they dismiss the hover?

(compare also https://phabricator.wikimedia.org/T131315#2192044 for last year's instrumentation)

Diagnostic

  • Is it ever the case that “perceived” wait (amount of time before hover shows) exceeds “popup delay” (amount of time to trigger) by more than 200 ms? What % of the time?
  • ---> result (+PS)
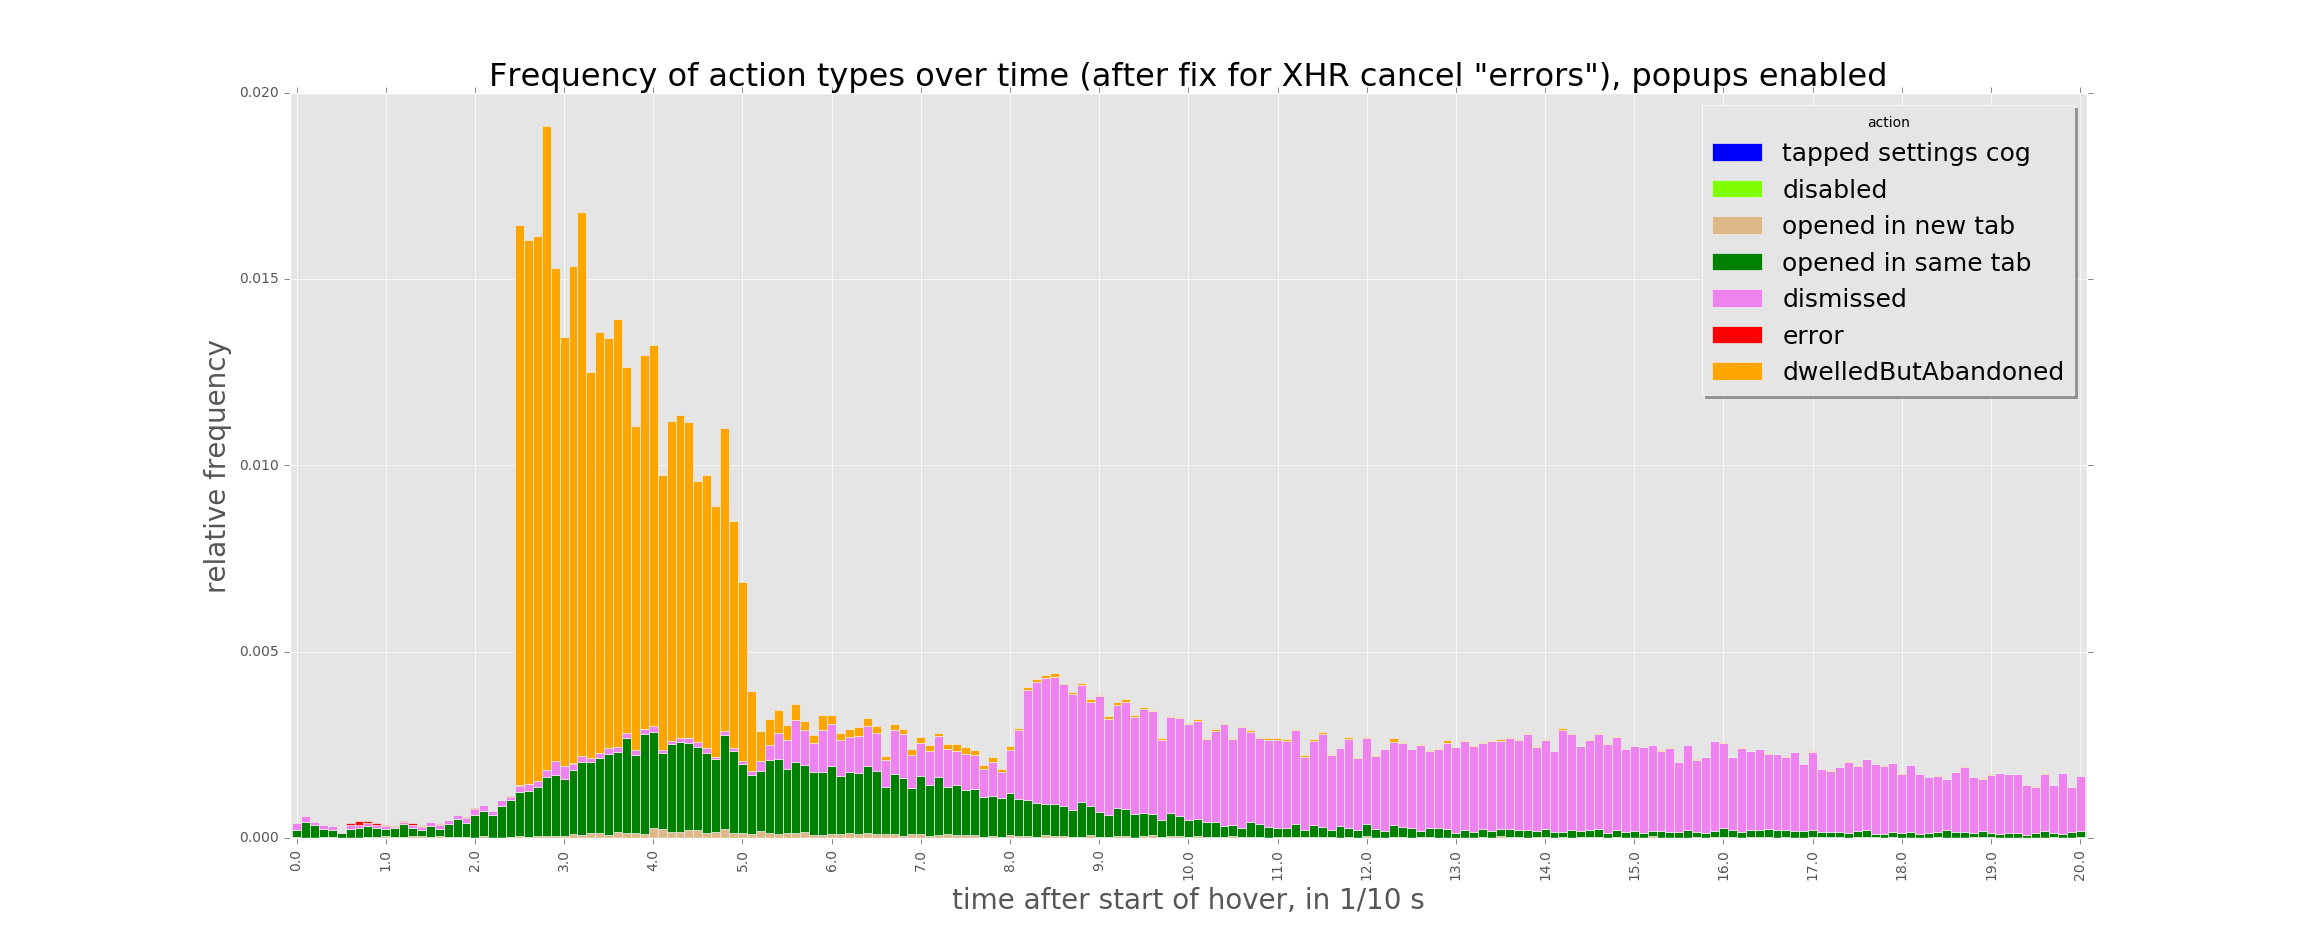
  • Frequency of error states (per hover) (comment from @dr0ptp4kt: Note well T137059. It's probably necessary to define this for a ratio above 300ms or something like that until the bugfix is built and deployed.)
  • --> result

(adapted from @JKatzWMF's notes, see also https://www.mediawiki.org/wiki/Beta_Features/Hovercards#2016_a.2Fb_tests )

Overall comment from @dr0ptp4kt: Beware T137203 in analysis of authenticated Hovercards OFF users. Probably easiest to just exclude those funnels.


Followup questions (apart from instrumentation verification/debugging work like T140485, T139319#2507540 , ... ):

  • Compare time spent per session (suitably defined, cf. notes)

Related Objects

Event Timeline

@Tbayer In evaluating the first task, we might want to dig a little deeper in two ways:

  • distinguish between hovers that last more than 500 ms and those that don't. This way we can directly compare hovers that trigger a card v. not.
  • look at time per session. We know that pageviews per session will go down, but if time goes down by less, then we can get a sense for how much longer people spend per page.

(work log)
Per discussion with @JKatzWMF yesterday, I added some other per-session metrics regarding engagement to the task description, and took a quick first look at them. The result is a bit surprising. As expected, session depth (pages viewed per session) went down with Hovercards enabled. But the average number of non-open link interactions (i.e. all those where the page link isn't clicked, i.e. those that don't result in a new pageview anyway) went down too, not up:

SELECT event_popupEnabled, 
count(DISTINCT event_pageToken)/count(DISTINCT event_sessionToken) AS page_views, 
count(DISTINCT event_linkInteractionToken)/count(DISTINCT event_sessionToken) AS link_interactions,
(count(DISTINCT event_pageToken) + count(DISTINCT event_linkInteractionToken))/count(DISTINCT event_sessionToken) AS page_views_plus_link_interactions
FROM log.Popups_15597282
WHERE wiki ='huwiki'
AND event_isAnon = 1
AND LEFT(timestamp, 8) > '20160607'
AND LEFT(timestamp, 8) < '20160707'
AND (event_action = 'pageLoaded' OR event_totalInteractionTime > 300)
AND event_action != 'opened in new tab'
AND event_action != 'opened in new window'
AND event_action != 'opened in same tab'
GROUP BY event_popupEnabled;
+--------------------+------------+-------------------+-----------------------------------+
| event_popupEnabled | page_views | link_interactions | page_views_plus_link_interactions |
+--------------------+------------+-------------------+-----------------------------------+
|                  0 |     2.6475 |            2.5657 |                            5.2132 |
|                  1 |     2.4909 |            1.8339 |                            4.3248 |
+--------------------+------------+-------------------+-----------------------------------+
2 rows in set (1 min 1.72 sec)

(all numbers are per session)

Per Adam's advice, I excluded all link interactions with interaction time <= 300 ms. (Without this, one would have seen a higher link interaction rate in the test group, as expected previously.) Now that T137059 has been fixed, we may want to repeat this query after the fix has been deployed next week. But I already checked that indeed almost all error events (i.e. also almost all of those that will be excluded by the fix) have interaction time <=300 ms. Also, such short interactions should not count as meaningful engagement anyway.

SELECT SUM(IF(event_totalInteractionTime <= 300, 1, 0))/SUM(1) FROM log.Popups_15597282 WHERE timestamp LIKE '201607%' AND wiki ='huwiki' AND event_isAnon = 1 AND event_action = 'error';
+---------------------------------------------------------+
| SUM(IF(event_totalInteractionTime <= 300, 1, 0))/SUM(1) |
+---------------------------------------------------------+
|                                                  0.9999 |
+---------------------------------------------------------+
1 row in set (4.24 sec)

I will look more into possible error sources as I'm digging more into the data (and look at other timespans, and other momenta such as the median). But I already checked some and can't see anything wrong right now. It's worth being aware that the non-open link interactions (as measured here) seem to constitute the majority of link interactions, which is a bit surprising in case of the control group:

SELECT event_popupEnabled, 
count(DISTINCT event_pageToken)/count(DISTINCT event_sessionToken) AS page_views, 
count(DISTINCT event_linkInteractionToken)/count(DISTINCT event_sessionToken) AS link_interactions,
(count(DISTINCT event_pageToken) + count(DISTINCT event_linkInteractionToken))/count(DISTINCT event_sessionToken) AS page_views_plus_link_interactions
FROM log.Popups_15597282
WHERE wiki ='huwiki'
AND event_isAnon = 1
AND LEFT(timestamp, 8) > '20160607'
AND LEFT(timestamp, 8) < '20160707'
AND (event_action = 'pageLoaded' OR event_totalInteractionTime > 300)
GROUP BY event_popupEnabled;
+--------------------+------------+-------------------+-----------------------------------+
| event_popupEnabled | page_views | link_interactions | page_views_plus_link_interactions |
+--------------------+------------+-------------------+-----------------------------------+
|                  0 |     2.6475 |            2.8828 |                            5.5304 |
|                  1 |     2.4909 |            2.1979 |                            4.6888 |
+--------------------+------------+-------------------+-----------------------------------+
2 rows in set (1 min 6.03 sec)

(compare with the non-open numbers above)

Thanks for this @Tbayer

One thing that makes me want to wait until the 'error' is fixed. When I modify the query to look for the short hovers aka, the events that are <300 and not page load events, I see something strange

SELECT 
event_popupEnabled, 
count(DISTINCT event_pageToken)/count(DISTINCT event_sessionToken) AS page_views, 
count(DISTINCT event_linkInteractionToken)/count(DISTINCT event_sessionToken) AS link_interactions_per_session,
count(DISTINCT event_linkInteractionToken)/count(DISTINCT event_pageToken) AS link_interactions_per_page,
(count(DISTINCT event_pageToken) + count(DISTINCT event_linkInteractionToken))/count(DISTINCT event_sessionToken) AS page_views_plus_link_interactions
FROM log.Popups_15597282
WHERE wiki ='huwiki'
AND event_isAnon = 1
AND LEFT(TIMESTAMP, 8) > '20160607'
AND LEFT(TIMESTAMP, 8) < '20160707'
AND (event_action != 'pageLoaded' AND event_totalInteractionTime < 301)
GROUP BY event_popupEnabled;

I see this: sorry, I use a GUI, so just grabbing the screenshot

Screenshot 2016-07-07 22.31.11.png (53×715 px, 16 KB)

It seems that either the error is not caused by what we think it is or that hovercards users have ~2x as many short link dwells as other users. I cannot think of what would cause that unless users are consistently playing around with links to see what will trigger a hover....

There is an error in my query above, however, in that I am not counting sessions or pages in which no action occurred. Too tired to fix now.

@Tbayer, just to wrap this up, reran the above to correct my error.

Roughly same results:

Screenshot 2016-07-08 09.56.18.png (48×713 px, 14 KB)

Revised query:

SELECT 
event_popupEnabled, 
count(DISTINCT event_pageToken)/count(DISTINCT event_sessionToken) AS page_views, 
count(DISTINCT event_linkInteractionToken)/count(DISTINCT event_sessionToken) AS link_interactions_per_session,
count(DISTINCT event_linkInteractionToken)/count(DISTINCT event_pageToken) AS link_interactions_per_page,
(count(DISTINCT event_pageToken) + count(DISTINCT event_linkInteractionToken))/count(DISTINCT event_sessionToken) AS page_views_plus_link_interactions
FROM log.Popups_15597282
WHERE wiki ='huwiki'
AND event_isAnon = 1
AND LEFT(TIMESTAMP, 8) > '20160607'
AND LEFT(TIMESTAMP, 8) < '20160707'
AND (event_action = 'pageLoaded' or event_totalInteractionTime < 301)
GROUP BY event_popupEnabled;

Another thing I checked is that totalInteractionTime is sent consistently both in test and control (which is obviously required for @dr0ptp4kt's recommendation to exclude events below the 300ms threshold, which the above queries are based on).

@bmansurov 's checklist at https://phabricator.wikimedia.org/T131315#2323247 cautioned earlier that this value would be sent "only when click occurs" in the control group (Hovercards disabled). But looking at the data after the experiment went live, it appears that the value is set for virtually all link interaction sessions. In other words, this probably can be excluded as a source of error, too.

SELECT event_popupEnabled, count(DISTINCT event_linkInteractionToken), count(DISTINCT event_sessionToken)
FROM log.Popups_15597282
WHERE wiki ='huwiki'
AND event_isAnon = 1
AND LEFT(timestamp, 8) > '20160607'
AND LEFT(timestamp, 8) < '20160707'
AND event_totalInteractionTime IS NULL
GROUP BY event_popupEnabled;
+--------------------+--------------------------------------------+------------------------------------+
| event_popupEnabled | count(DISTINCT event_linkInteractionToken) | count(DISTINCT event_sessionToken) |
+--------------------+--------------------------------------------+------------------------------------+
|                  0 |                                          0 |                             297781 |
|                  1 |                                          2 |                             297433 |
+--------------------+--------------------------------------------+------------------------------------+
2 rows in set (34.38 sec)

Beware dwelledButAbandoned events. In the context of event_popupEnabled = false events, all they mean is the user dwelled on the link for 250ms or more but didn't click through. In the context of event_popupEnabled = true, looking at the timing distribution curve may be interesting for analyzing how long it was before the user moused away from the link, but probably isn't typically too interesting as a measure of constructive link engagement.

As for the exclusion of events, it's specifically event_action = 'error' that ought to be excluded when looking below 300ms or 251ms. I'd actually recommend generally excluding event_action = 'error' events generally for aggregate analysis, unless there's something in Hive suggesting a lot of server side errors for the api.php calls used for Hovercards.

Beware dwelledButAbandoned events. In the context of event_popupEnabled = false events, all they mean is the user dwelled on the link for 250ms or more but didn't click through. In the context of event_popupEnabled = true, looking at the timing distribution curve may be interesting for analyzing how long it was before the user moused away from the link, but probably isn't typically too interesting as a measure of constructive link engagement.

Agreed, that's basically what I wrote above too ("such short interactions should not count as meaningful engagement anyway").

As for the exclusion of events, it's specifically event_action = 'error' that ought to be excluded when looking below 300ms or 251ms.

Well yes, I know that was your recommendation (as stated in the task) for the error frequency analysis. But for the engagement analysis, in combination with the above observation that the other (non-error) events below the threshold don't matter for that questions, it seemed best to me to exclude all of them. Makes sense?

I'd actually recommend generally excluding event_action = 'error' events generally for aggregate analysis, unless there's something in Hive suggesting a lot of server side errors for the api.php calls used for Hovercards.

Got it, but after seeing that 99.99% of error events have interaction time <=300 ms anyway (see above), I assumed that this would not affect the present analysis. I can double-check though.

@Tbayer, I believe I get the gist of the induction you've applied and the seemingly counterintuitive outcomes. That said, I figured it would be best if we talk through the different queries some more, so I set a meeting for Monday.

Another thing that is a bit strange:
I was under the impression that usually every link interaction generates only one event, with the exception of the "tapped settings cog" --> "disabled" sequence in the test condition (which is rare per JonK's earlier numbers). However, while this assumption checks out for the test condition, it is not true for the control group, where there were on average 1.07 events per interaction:

SELECT event_popupEnabled, AVG(events_per_token), COUNT(*) AS interactions FROM (
  SELECT event_popupEnabled, event_linkInteractionToken, COUNT(*) AS events_per_token 
  FROM log.Popups_15597282 
  WHERE wiki ='huwiki' AND event_isAnon = 1 
    AND LEFT(timestamp, 8) > '20160607'
    AND LEFT(timestamp, 8) < '20160707'
    AND event_linkInteractionToken IS NOT NULL
  GROUP BY event_popupEnabled, event_linkInteractionToken) AS interactions
GROUP BY event_popupEnabled;
+--------------------+-----------------------+--------------+
| event_popupEnabled | AVG(events_per_token) | interactions |
+--------------------+-----------------------+--------------+
|                  0 |                1.0712 |      1063201 |
|                  1 |                1.0017 |      1163065 |
+--------------------+-----------------------+--------------+
2 rows in set (1 min 39.44 sec)

@Tbayer, I believe I get the gist of the induction you've applied and the seemingly counterintuitive outcomes. That said, I figured it would be best if we talk through the different queries some more, so I set a meeting for Monday.

Cool, thanks for making room for this!

Another thing that is a bit strange:
I was under the impression that usually every link interaction generates only one event, with the exception of the "tapped settings cog" --> "disabled" sequence in the test condition (which is rare per JonK's earlier numbers). However, while this assumption checks out for the test condition, it is not true for the control group, where there were on average 1.07 events per interaction:

PS, this difference remains when excluding error events, and also when restricting to interaction time >300ms (i.e. the condition used in the above query whose counterintuitive result we are trying to understand):

SELECT event_popupEnabled, AVG(events_per_token), COUNT(*) AS interactions FROM (
  SELECT event_popupEnabled, event_linkInteractionToken, COUNT(*) AS events_per_token 
  FROM log.Popups_15597282 
  WHERE wiki ='huwiki' AND event_isAnon = 1 
    AND LEFT(timestamp, 8) > '20160607'
    AND LEFT(timestamp, 8) < '20160707'
    AND event_linkInteractionToken IS NOT NULL
    AND event_action != 'error'
  GROUP BY event_popupEnabled, event_linkInteractionToken) AS interactions
GROUP BY event_popupEnabled;
+--------------------+-----------------------+--------------+
| event_popupEnabled | AVG(events_per_token) | interactions |
+--------------------+-----------------------+--------------+
|                  0 |                1.0712 |      1063152 |
|                  1 |                1.0018 |       729581 |
+--------------------+-----------------------+--------------+
2 rows in set (1 min 13.11 sec)

SELECT event_popupEnabled, AVG(events_per_token), COUNT(*) AS interactions FROM (
  SELECT event_popupEnabled, event_linkInteractionToken, COUNT(*) AS events_per_token 
  FROM log.Popups_15597282 
  WHERE wiki ='huwiki' AND event_isAnon = 1 
    AND LEFT(timestamp, 8) > '20160607'
    AND LEFT(timestamp, 8) < '20160707'
    AND event_linkInteractionToken IS NOT NULL
    AND event_totalInteractionTime > 300
  GROUP BY event_popupEnabled, event_linkInteractionToken) AS interactions
GROUP BY event_popupEnabled;
+--------------------+-----------------------+--------------+
| event_popupEnabled | AVG(events_per_token) | interactions |
+--------------------+-----------------------+--------------+
|                  0 |                1.0550 |       858523 |
|                  1 |                1.0017 |       653742 |
+--------------------+-----------------------+--------------+
2 rows in set (1 min 17.63 sec)

PPS, worth being aware that almost all error events occur in the test group:

SELECT event_popupEnabled AS popupEnabled, COUNT(*) AS error_events 
FROM log.Popups_15597282 
WHERE wiki ='huwiki' AND event_isAnon = 1 
AND LEFT(timestamp, 8) > '20160607'
AND LEFT(timestamp, 8) < '20160707'
AND event_action = 'error'
GROUP BY popupEnabled;
+--------------+--------------+
| popupEnabled | error_events |
+--------------+--------------+
|            0 |           49 |
|            1 |       434221 |
+--------------+--------------+
2 rows in set (24.41 sec)

@Tbayer In evaluating the first task, we might want to dig a little deeper in two ways:

[...]

  • look at time per session. We know that pageviews per session will go down, but if time goes down by less, then we can get a sense for how much longer people spend per page.

(already discussed in person last week, recording here for later, after we have understood the above issues a bit better:)

Regarding suitable definitions of "time per session": Simply looking at the first and last event per (browser) session probably won't yield valid results for this question. One option might be to use the "activity session" concept and length definition from
https://meta.wikimedia.org/wiki/Research:Activity_session#Session_length . (NB about terminology: a session in the Popups schema here would roughly correspond to a "user" there, and would be split into several "activity sessions" whose lengths one could add up.)

Also, regarding an alternative idea brought up here last week: The schema doesn't give us anything on sessions per user.

@Tbayer, I spoke with @dr0ptp4kt and he clarified that the reason I was seeing so many more events <300ms in the hover bucket is that the control bucket was not tracking <250ms dwellButAbandoned events and the hover bucket erroneously was. My concern has been explained away!!

Generally, it's the error events that show up in a great concentration below 250ms for the event_popupEnabled = true (Hovercards ON) case - most, if not all of those are unintended and the next train deployment should fix the bug that introduced those in the first place (see T137059: Do not log errors when they are actually client-initiated XHR cancellations).

The following gives a coarse grained sense of the events split between >= 250 ms and below 250ms. Merely as a note, the query doesn't attempt to de-duplicate events (which we sometimes see in event logging anyway) or re-entry back to the same page or anything like that. It's just simple counting.

select
event_isAnon,
event_popupEnabled,
event_action,
event_totalInteractionTime >= 250 as twofifty_and_up,
count(*)
from Popups_15597282
where
wiki = 'huwiki'
and timestamp > '20160711'
and timestamp < '20160712'
group by event_isAnon,
event_popupEnabled,
event_action,
twofifty_and_up;
event_isAnonevent_popupEnabledevent_actiontwofifty_and_upcount(*)
00dwelledButAbandoned1590
00opened in new tab052
00opened in new tab177
00opened in same tab0144
00opened in same tab1193
00pageLoadedNULL1043
01dismissed01
01dismissed1126
01dwelledButAbandoned1107
01error0149
01error12
01opened in new tab11
01opened in same tab018
01opened in same tab1105
01pageLoadedNULL754
10dismissed112
10dwelledButAbandoned128235
10error04
10opened in new tab0253
10opened in new tab1464
10opened in same tab04972
10opened in same tab17168
10pageLoadedNULL26865
11dismissed073
11dismissed113592
11dwelledButAbandoned17140
11error013859
11error133
11opened in new tab019
11opened in new tab1249
11opened in same tab0265
11opened in same tab13675
11pageLoadedNULL24271

Generally, it's the error events that show up in a great concentration below 250ms for the event_popupEnabled = true (Hovercards ON) case

Thanks for this data - it confirms the earlier observations that almost all error events happened in the test group (Hovercards ON) and that 99.99% of errors happen within the first 300ms .

Another thing that is a bit strange:
I was under the impression that usually every link interaction generates only one event, with the exception of the "tapped settings cog" --> "disabled" sequence in the test condition (which is rare per JonK's earlier numbers). However, while this assumption checks out for the test condition, it is not true for the control group, where there were on average 1.07 events per interaction:
...

@dr0ptp4kt and I discussed this issue on Monday and resolved to check two possible causes:

  1. a manifestation of a general EventLogging issue whereby the same event is registered several times (i.e. results in several rows in the table, with all fields identical except perhaps id and uuid).
  2. extraneous dwelledButAbandoned events.

I first checked 1. Per the query below, this can be ruled out as the main cause for the issue here. (However, it confirms that such duplicate events exist, forming up to 0.88% of events per day in case of this query. I already did some investigation of this some weeks ago in case of other EL schemas, and plan to file a general bug about it.)

SELECT dupesperday.popupEnabled, dupesperday.yearmonthday, ROUND(100*dupes/totalevents,2) AS dupes_percentage FROM
        (SELECT popupEnabled, yearmonthday, SUM(copies-1) AS dupes FROM
                (SELECT event_popupEnabled AS popupEnabled, LEFT(timestamp, 8) AS yearmonthday,
                timestamp, userAgent,
                event_linkInteractionToken, event_action, event_totalInteractionTime,
                COUNT(*) AS copies
                FROM log.Popups_15597282
                WHERE wiki ='huwiki' AND event_isAnon = 1
                AND LEFT(timestamp, 8) > '20160607'
                AND LEFT(timestamp, 8) < '20160707'
                AND event_linkInteractionToken IS NOT NULL
                GROUP BY popupEnabled, yearmonthday,
                timestamp, userAgent,
                event_linkInteractionToken, event_action, event_totalInteractionTime
                HAVING copies>1) AS dupeslist
        GROUP BY popupEnabled, yearmonthday) AS dupesperday
        JOIN
        (SELECT event_popupEnabled AS popupEnabled, LEFT(timestamp, 8) AS yearmonthday,
        COUNT(*) AS totalevents
        FROM log.Popups_15597282
        WHERE wiki ='huwiki' AND event_isAnon = 1
        AND LEFT(timestamp, 8) > '20160607'
        AND LEFT(timestamp, 8) < '20160707'
        AND event_linkInteractionToken IS NOT NULL
        GROUP BY popupEnabled, yearmonthday) AS totaleventsperday
        ON dupesperday.popupEnabled = totaleventsperday.popupEnabled
        AND dupesperday.yearmonthday = totaleventsperday.yearmonthday
ORDER BY popupEnabled, yearmonthday
--------------

popupEnabled    yearmonthday    dupes_percentage
0       20160608        0.36
0       20160609        0.03
0       20160610        0.88
0       20160611        0.06
0       20160612        0.06
0       20160613        0.05
0       20160614        0.04
0       20160615        0.14
0       20160616        0.02
0       20160617        0.02
0       20160618        0.02
0       20160619        0.53
0       20160620        0.15
0       20160621        0.03
0       20160622        0.03
0       20160623        0.00
0       20160624        0.03
0       20160625        0.03
0       20160626        0.05
0       20160627        0.01
0       20160628        0.06
0       20160629        0.02
0       20160630        0.06
0       20160701        0.00
0       20160702        0.03
0       20160703        0.04
0       20160704        0.07
0       20160705        0.04
0       20160706        0.01
1       20160608        0.01
1       20160609        0.01
1       20160610        0.03
1       20160611        0.07
1       20160612        0.05
1       20160613        0.04
1       20160614        0.18
1       20160615        0.02
1       20160616        0.06
1       20160617        0.05
1       20160618        0.14
1       20160619        0.05
1       20160620        0.19
1       20160621        0.10
1       20160622        0.02
1       20160623        0.07
1       20160624        0.07
1       20160625        0.05
1       20160626        0.09
1       20160627        0.08
1       20160628        0.17
1       20160629        0.01
1       20160630        0.01
1       20160701        0.04
1       20160702        0.04
1       20160703        0.08
1       20160704        0.00
1       20160705        0.03
1       20160706        0.04

The query looks complicated, but all it does is to count events that have identical values in each of these fields: timestamp, userAgent, event_linkInteractionToken, event_action, event_totalInteractionTime, and then calculate the percentage of redundant events per day.

Another thing that is a bit strange:
I was under the impression that usually every link interaction generates only one event, with the exception of the "tapped settings cog" --> "disabled" sequence in the test condition (which is rare per JonK's earlier numbers). However, while this assumption checks out for the test condition, it is not true for the control group, where there were on average 1.07 events per interaction:
...

@dr0ptp4kt and I discussed this issue on Monday and resolved to check two possible causes:

[...]

  1. extraneous dwelledButAbandoned events.

OK, 2. seems to be the main cause. I retrieved 50 examples (see query below), and in each of them there was one dwelledButAbandoned together with a link opening event - sometimes before, sometimes after. In other words, it's a bug in the instrumentation.

SELECT dupetokenlist.event_linkInteractionToken AS token, event_action AS action, event_totalInteractionTime AS totalInteractionTime
FROM 
	(SELECT event_linkInteractionToken,	COUNT(*) AS copies 
	FROM log.Popups_15597282
	WHERE wiki ='huwiki' AND event_isAnon = 1 
	AND event_popupEnabled = 0
	AND timestamp LIKE '20160703%'
	AND event_linkInteractionToken IS NOT NULL
	GROUP BY event_linkInteractionToken
	HAVING copies>1) AS dupetokenlist
JOIN 
	(SELECT * FROM log.Popups_15597282
	WHERE wiki ='huwiki' AND event_isAnon = 1 
	AND event_popupEnabled = 0
	AND timestamp LIKE '20160703%'
	AND event_linkInteractionToken IS NOT NULL) AS allevents
ON dupetokenlist.event_linkInteractionToken = allevents.event_linkInteractionToken
ORDER BY token, totalInteractionTime
LIMIT 100;
+-------------------------------+---------------------+----------------------+
| token                         | action              | totalInteractionTime |
+-------------------------------+---------------------+----------------------+
| 0002b8eb971b49241467560002738 | dwelledButAbandoned |                  344 |
| 0002b8eb971b49241467560002738 | opened in same tab  |               106081 |
| 0011597228b58a8d1467567900673 | opened in new tab   |                 1327 |
| 0011597228b58a8d1467567900673 | dwelledButAbandoned |                 1741 |
| 0027ff2084b0e8161467584455898 | opened in same tab  |                  122 |
| 0027ff2084b0e8161467584455898 | dwelledButAbandoned |                 1060 |
| 0040b84139bbddd71467530011861 | opened in new tab   |                  172 |
| 0040b84139bbddd71467530011861 | dwelledButAbandoned |                  727 |
| 00528ab4d5dc19071467580971197 | opened in same tab  |                  727 |
| 00528ab4d5dc19071467580971197 | dwelledButAbandoned |                  970 |
| 005454fff10686c51467563014296 | opened in same tab  |                  580 |
| 005454fff10686c51467563014296 | dwelledButAbandoned |                  962 |
| 00760eb22f0ac9ef1467535068375 | opened in new tab   |                 2724 |
| 00760eb22f0ac9ef1467535068375 | dwelledButAbandoned |                 2894 |
| 00a31b38f1b220271467510064741 | opened in same tab  |                  198 |
| 00a31b38f1b220271467510064741 | dwelledButAbandoned |                  277 |
| 00a753fe56c87a9f1467541889086 | dwelledButAbandoned |                 4168 |
| 00a753fe56c87a9f1467541889086 | opened in same tab  |                 8745 |
| 00af45051944dc4b1467534006492 | opened in same tab  |                  139 |
| 00af45051944dc4b1467534006492 | dwelledButAbandoned |                  343 |
| 00cae0cba58a96711467576069062 | opened in same tab  |                  951 |
| 00cae0cba58a96711467576069062 | dwelledButAbandoned |                 1185 |
| 00d0bac32641eff91467542732890 | opened in same tab  |                  250 |
| 00d0bac32641eff91467542732890 | dwelledButAbandoned |                  406 |
| 0109531b05d4d83b1467533661677 | opened in same tab  |                  140 |
| 0109531b05d4d83b1467533661677 | dwelledButAbandoned |                  361 |
| 012fbfaaa2f85a1d1467538703297 | opened in same tab  |                  382 |
| 012fbfaaa2f85a1d1467538703297 | dwelledButAbandoned |                  450 |
| 0135d18ce3a7114f1467577154736 | opened in new tab   |                  556 |
| 0135d18ce3a7114f1467577154736 | dwelledButAbandoned |                  610 |
| 0138680825976b7f1467559316335 | opened in same tab  |                  248 |
| 0138680825976b7f1467559316335 | dwelledButAbandoned |                  514 |
| 013c5e93312e0c331467574179384 | opened in new tab   |                 1618 |
| 013c5e93312e0c331467574179384 | dwelledButAbandoned |                 1737 |
| 013e93403e6a8dbe1467575034829 | opened in new tab   |                  800 |
| 013e93403e6a8dbe1467575034829 | dwelledButAbandoned |                 1340 |
| 01550f5737b7b1c91467553566415 | opened in same tab  |                  115 |
| 01550f5737b7b1c91467553566415 | dwelledButAbandoned |                  689 |
| 017c2b7c63756f5f1467550194078 | opened in same tab  |                  408 |
| 017c2b7c63756f5f1467550194078 | dwelledButAbandoned |                  527 |
| 019d29dd35da59011467546257994 | opened in same tab  |                  619 |
| 019d29dd35da59011467546257994 | dwelledButAbandoned |                  889 |
| 01a5b5bffc403db21467549871016 | opened in same tab  |                  687 |
| 01a5b5bffc403db21467549871016 | dwelledButAbandoned |                  921 |
| 01a73b2b7e28342d1467568433642 | opened in same tab  |                  694 |
| 01a73b2b7e28342d1467568433642 | dwelledButAbandoned |                  761 |
| 01b505b7f2187a061467567338499 | opened in same tab  |                  565 |
| 01b505b7f2187a061467567338499 | dwelledButAbandoned |                  664 |
| 01edde8aaa0ca0f11467560007248 | opened in same tab  |                  565 |
| 01edde8aaa0ca0f11467560007248 | dwelledButAbandoned |                  682 |
| 01fcfe56349e4fa71467650754289 | opened in same tab  |                 1048 |
| 01fcfe56349e4fa71467650754289 | dwelledButAbandoned |                 1136 |
| 020a3855995cf0bf1467575343903 | opened in same tab  |                  233 |
| 020a3855995cf0bf1467575343903 | dwelledButAbandoned |                  413 |
| 0216c83efe9546011467542510248 | dwelledButAbandoned |                  683 |
| 0216c83efe9546011467542510248 | opened in same tab  |                 3695 |
| 021cee055c6b61051467576786137 | opened in same tab  |                  570 |
| 021cee055c6b61051467576786137 | dwelledButAbandoned |                  670 |
| 023229da9b7d7bc41467531325233 | opened in same tab  |                  180 |
| 023229da9b7d7bc41467531325233 | dwelledButAbandoned |                 1879 |
| 0244af01cf37f5101467554243558 | opened in same tab  |                  202 |
| 0244af01cf37f5101467554243558 | dwelledButAbandoned |                 2814 |
| 025aacb2d4a262511467537720859 | opened in same tab  |                  766 |
| 025aacb2d4a262511467537720859 | dwelledButAbandoned |                  875 |
| 0270e1bdb54dd9b71467567712467 | opened in same tab  |                 2666 |
| 0270e1bdb54dd9b71467567712467 | dwelledButAbandoned |                 2755 |
| 027b9bb8a2cfffd21467555050046 | opened in same tab  |                  450 |
| 027b9bb8a2cfffd21467555050046 | dwelledButAbandoned |                  543 |
| 027cbde7009f175a1467586782123 | opened in same tab  |                  363 |
| 027cbde7009f175a1467586782123 | dwelledButAbandoned |                  442 |
| 028391cd153975771467559878812 | opened in same tab  |                 1062 |
| 028391cd153975771467559878812 | dwelledButAbandoned |                 3375 |
| 028ef558c7453beb1467538876733 | opened in same tab  |                  220 |
| 028ef558c7453beb1467538876733 | dwelledButAbandoned |                  446 |
| 028f9ce9a4c9a1351467571656427 | opened in same tab  |                  493 |
| 028f9ce9a4c9a1351467571656427 | dwelledButAbandoned |                  567 |
| 028fe8dd6e8d182c1467545233372 | dwelledButAbandoned |                  408 |
| 028fe8dd6e8d182c1467545233372 | opened in same tab  |                83772 |
| 0290ffa09c81721e1467575212222 | opened in new tab   |                  492 |
| 0290ffa09c81721e1467575212222 | dwelledButAbandoned |                  616 |
| 0294a2bb73740b281467546388668 | dwelledButAbandoned |                  890 |
| 0294a2bb73740b281467546388668 | opened in same tab  |                 5484 |
| 029f3017e369428a1467528485216 | opened in same tab  |                  151 |
| 029f3017e369428a1467528485216 | dwelledButAbandoned |                  271 |
| 02a161306221385f1467537690210 | opened in same tab  |                  370 |
| 02a161306221385f1467537690210 | dwelledButAbandoned |                  618 |
| 02b91fa5010c2c421467571199143 | dwelledButAbandoned |                  927 |
| 02b91fa5010c2c421467571199143 | opened in same tab  |                 6009 |
| 02bac351552bae5d1467532745330 | opened in same tab  |                  664 |
| 02bac351552bae5d1467532745330 | dwelledButAbandoned |                  923 |
| 02c1ea9592c5ec7d1467539077765 | opened in same tab  |                  219 |
| 02c1ea9592c5ec7d1467539077765 | dwelledButAbandoned |                 2360 |
| 02c84258744987721467565005518 | opened in same tab  |                  767 |
| 02c84258744987721467565005518 | dwelledButAbandoned |                 1056 |
| 02cc8d06e412ed4e1467524093472 | opened in same tab  |                  162 |
| 02cc8d06e412ed4e1467524093472 | dwelledButAbandoned |                  551 |
| 02cecda98c42b9d81467568110869 | opened in same tab  |                 1842 |
| 02cecda98c42b9d81467568110869 | dwelledButAbandoned |                 1937 |
| 02dc10baf14feeb51467537863976 | opened in same tab  |                  829 |
| 02dc10baf14feeb51467537863976 | dwelledButAbandoned |                 1203 |
+-------------------------------+---------------------+----------------------+
100 rows in set (36.10 sec)

(NB, this still doesn't affect, or explain away, the counterintuitive result above that the average number of non-open link interactions >300ms is lower in the test group. [Edit] To be precise, it does affect the numbers there, because some of the dwelledButAbandoned events counted in that query can now assumed to be spurious - but probably not enough to affect the conclusion that the number is lower in the test group. I will try to check though.)

Regarding the second group of questions, "What % of people dislike hovercards?":

According to the present data, the percentage of users who disable them is zero for practical purposes - there have been only six disable clicks logged over the entire experiment so far:

SELECT LEFT(timestamp, 8) AS yearmonthday, COUNT(*) AS disables
FROM log.Popups_15597282
WHERE wiki ='huwiki'
AND event_action = 'disabled'
GROUP BY yearmonthday;
+--------------+----------+
| yearmonthday | disables |
+--------------+----------+
| 20160609     |        1 |
| 20160612     |        1 |
| 20160616     |        1 |
| 20160617     |        1 |
| 20160624     |        1 |
| 20160702     |        1 |
+--------------+----------+
6 rows in set (44.87 sec)

The reason might be that virtually every reader likes Hovercards, or that almost nobody clicks the settings cog to discover the disable option:

SELECT LEFT(timestamp, 8) AS yearmonthday, SUM(1) AS linkevents, SUM(IF(event_action = 'tapped settings cog',1,0)) AS cogtaps
FROM log.Popups_15597282
WHERE wiki ='huwiki'
AND event_linkInteractionToken IS NOT NULL
GROUP BY yearmonthday;
+--------------+------------+---------+
| yearmonthday | linkevents | cogtaps |
+--------------+------------+---------+
| 20160602     |        112 |       0 |
| 20160603     |      41674 |       0 |
| 20160604     |      67727 |       0 |
| 20160605     |      92615 |       0 |
| 20160606     |      81640 |       1 |
| 20160607     |      80299 |       2 |
| 20160608     |      82643 |       7 |
| 20160609     |      75388 |       6 |
| 20160610     |      76388 |       5 |
| 20160611     |      67813 |       8 |
| 20160612     |      93989 |       7 |
| 20160613     |      85621 |       2 |
| 20160614     |      87395 |      11 |
| 20160615     |      80930 |       4 |
| 20160616     |      73995 |       6 |
| 20160617     |      71596 |       4 |
| 20160618     |      69391 |       8 |
| 20160619     |      89624 |       7 |
| 20160620     |      96569 |       2 |
| 20160621     |      91651 |       0 |
| 20160622     |      88684 |       4 |
| 20160623     |      85104 |       5 |
| 20160624     |      74360 |       7 |
| 20160625     |      65996 |       3 |
| 20160626     |      81928 |       3 |
| 20160627     |     105233 |       4 |
| 20160628     |     102722 |       4 |
| 20160629     |      79118 |       1 |
| 20160630     |      74746 |       3 |
| 20160701     |      68703 |       0 |
| 20160702     |      64996 |       7 |
| 20160703     |      83106 |       6 |
| 20160704     |      83581 |       5 |
| 20160705     |      79484 |       4 |
| 20160706     |      76352 |       2 |
| 20160707     |      81786 |       4 |
| 20160708     |      70373 |       2 |
| 20160709     |      65014 |       3 |
| 20160710     |      77438 |       4 |
| 20160711     |      81578 |       0 |
| 20160712     |      73545 |       3 |
| 20160713     |      72145 |       6 |
| 20160714     |      76853 |       4 |
| 20160715     |      61379 |       4 |
+--------------+------------+---------+
44 rows in set (40.27 sec)

All assuming that these events are logged correctly, of course.

@Tbayer, status update: T137059: Do not log errors when they are actually client-initiated XHR cancellations is on production Wikipedias as of yesterday, so most of the error junk has fallen away. I noted there, but am noting it here too for our future selves.

@Tbayer, not sure if it accounts for most of those dwelledButAbandoned and opened... token-sharing events, but I believe I may have figured out the dwelledButAbandoned and opened... events on the same token thing. I induced this eventing by throttling to GPRS speed, then quickly dragging on a link, clicking it, and then dragging away. And here was the result.

{"event":{"pageTitleSource":"Main Page","namespaceIdSource":0,"pageIdSource":1,"isAnon":true,"popupEnabled":false,"popupDelay":500,"pageToken":"4c1c03fd01bfed12146863819470870d2aa11c5030ff2","sessionToken":"29fd9ee5560a9b7f","version":"legacy","api":"mwapi","pageTitleHover":"Test","action":"opened in same tab","totalInteractionTime":481,"linkInteractionToken":"d0d9b043db9a79581468638216825","previewCountBucket":"0 previews","namespaceIdHover":0},"revision":15597282,"schema":"Popups","webHost":"reading-web-staging.wmflabs.org","wiki":"wiki"};:


{"event":{"pageTitleSource":"Main Page","namespaceIdSource":0,"pageIdSource":1,"isAnon":true,"popupEnabled":false,"popupDelay":500,"pageToken":"4c1c03fd01bfed12146863819470870d2aa11c5030ff2","sessionToken":"29fd9ee5560a9b7f","version":"legacy","api":"mwapi","pageTitleHover":"Test","action":"dwelledButAbandoned","totalInteractionTime":656,"linkInteractionToken":"d0d9b043db9a79581468638216825","previewCountBucket":"0 previews","namespaceIdHover":0},"revision":15597282,"schema":"Popups","webHost":"reading-web-staging.wmflabs.org","wiki":"wiki"};:

I believe what we expected to see was that a click event should end the link interaction's funnel, but what's going on here is (a) the user does click, and (b) the user does also "give up" and mouse away prior to the rendering of the preview during a threshold that had exceeded 250ms...and voila, two events with the same token.

@bmansurov, @phuedx, would you say that behavior is a characteristic of how the code works in practice for this particular use case, perhaps under a JS race condition, where the user clicks but also undwells from the link at 250ms or later but before a preview card renders?

And @Tbayer, is this something that you can filter away by way of queries?

(Discussion about these dwelledButAbandoned and opened... token-sharing events in the control group is now happening at T140485 instead of here.)

I also took a closer look at the other duplicate events, i.e. those in the test group, and in the control group before June 16 (when the duplicate ratio there shot up with T140485: Schema:Popups logs "dwelledButAbandoned" and link open events at the same time). As indicated earlier, because of their low ratio they can probably be ignored for most of the questions we are interested in.
However, we should at least be aware that there appears to be another issue there, causing identical events being sent (or at least stored) with different timestamp, see example data below. NB that's a different from the general EventLogging problem discussed as 1. above, where the duplicate event is identical in all fields including the timestamp (but excluding the internal table row ID).

A sample of such duplicate events for the test group:

SELECT dupetokenlist.event_linkInteractionToken AS linkInteractionToken, daytime, event_action AS action, event_totalInteractionTime AS totalInteractionTime
FROM 
	(SELECT event_linkInteractionToken,	COUNT(*) AS copies 
	FROM log.Popups_15597282
	WHERE wiki ='huwiki' AND event_isAnon = 1 
	AND event_popupEnabled = 1
	AND timestamp LIKE '20160703%'
	AND event_linkInteractionToken IS NOT NULL
	GROUP BY event_linkInteractionToken
	HAVING copies>1) AS dupetokenlist
JOIN 
	(SELECT event_linkInteractionToken, event_action, event_totalInteractionTime, MID(timestamp,9,6) AS daytime
	FROM log.Popups_15597282
	WHERE wiki ='huwiki' AND event_isAnon = 1 
	AND event_popupEnabled = 1
	AND timestamp LIKE '20160703%'
	AND event_linkInteractionToken IS NOT NULL) AS allevents
ON dupetokenlist.event_linkInteractionToken = allevents.event_linkInteractionToken
ORDER BY linkInteractionToken, daytime, totalInteractionTime
LIMIT 100;
+-------------------------------+---------+---------------------+----------------------+
| linkInteractionToken          | daytime | action              | totalInteractionTime |
+-------------------------------+---------+---------------------+----------------------+
| 00ea3761ff3523ca1467570738991 | 183236  | dismissed           |                15679 |
| 00ea3761ff3523ca1467570738991 | 183549  | dismissed           |                15679 |
| 04311d1b79d31abf1467538812283 | 094011  | error               |                   70 |
| 04311d1b79d31abf1467538812283 | 094428  | error               |                   70 |
| 05d4fd20547524761467562666491 | 161746  | dwelledButAbandoned |                  548 |
| 05d4fd20547524761467562666491 | 161746  | dwelledButAbandoned |                  548 |
| 0c59f09e4a4cbb2b1467538987121 | 094306  | error               |                  187 |
| 0c59f09e4a4cbb2b1467538987121 | 094428  | error               |                  187 |
| 0e7b2a912e9513981467573188907 | 191308  | dismissed           |                  906 |
| 0e7b2a912e9513981467573188907 | 191308  | dismissed           |                  906 |
| 11a2dced4b034bf51467570882037 | 183447  | error               |                  217 |
| 11a2dced4b034bf51467570882037 | 183447  | error               |                  217 |
| 1a3cd203ddea96451467538802826 | 094011  | dismissed           |                 9320 |
| 1a3cd203ddea96451467538802826 | 094428  | dismissed           |                 9320 |
| 1b66089869c12a9d1467570809323 | 183351  | dismissed           |                19753 |
| 1b66089869c12a9d1467570809323 | 183549  | dismissed           |                19753 |
| 1ef980bf6889f4ee1467571371187 | 184257  | dwelledButAbandoned |                  490 |
| 1ef980bf6889f4ee1467571371187 | 184257  | dwelledButAbandoned |                  490 |
| 1f96f7841f1cef571467580345592 | 211226  | error               |                  193 |
| 1f96f7841f1cef571467580345592 | 211235  | error               |                  193 |
| 22455d44ebf1817f1467538791053 | 093950  | dismissed           |                  832 |
| 22455d44ebf1817f1467538791053 | 094428  | dismissed           |                  832 |
| 23309b4f34f91de11467562667051 | 161746  | opened in same tab  |                  187 |
| 23309b4f34f91de11467562667051 | 161746  | opened in same tab  |                  187 |
| 238a774f2c1fa3e61467573131388 | 191209  | error               |                  171 |
| 238a774f2c1fa3e61467573131388 | 191242  | error               |                  171 |
| 29d2387cbecb5f681467536600025 | 090320  | opened in same tab  |                   60 |
| 29d2387cbecb5f681467536600025 | 090320  | error               |                   84 |
| 2a8d3147c4cd73f51467564057521 | 164057  | dwelledButAbandoned |                  481 |
| 2a8d3147c4cd73f51467564057521 | 164057  | dwelledButAbandoned |                  481 |
| 2e41a014718ea8a41467573250818 | 191409  | opened in same tab  |                  848 |
| 2e41a014718ea8a41467573250818 | 191409  | opened in same tab  |                  848 |
| 2e6714d800f408dc1467573181510 | 191300  | dwelledButAbandoned |                  478 |
| 2e6714d800f408dc1467573181510 | 191300  | dwelledButAbandoned |                  478 |
| 2f298e9189adf9c91467539034279 | 094355  | opened in same tab  |                 2367 |
| 2f298e9189adf9c91467539034279 | 094428  | opened in same tab  |                 2367 |
| 3166deee0e280acf1467538999865 | 094325  | dismissed           |                 6586 |
| 3166deee0e280acf1467538999865 | 094428  | dismissed           |                 6586 |
| 33493feccf265a791467573134382 | 191212  | error               |                  128 |
| 33493feccf265a791467573134382 | 191242  | error               |                  128 |
| 3695acda0f14a62b1467562625318 | 161704  | error               |                   71 |
| 3695acda0f14a62b1467562625318 | 161704  | error               |                   71 |
| 3e09d36324893f0f1467571096205 | 183833  | dwelledButAbandoned |                  264 |
| 3e09d36324893f0f1467571096205 | 183837  | dwelledButAbandoned |                  264 |
| 443025864495d0741467562778389 | 161939  | dismissed           |                 2266 |
| 443025864495d0741467562778389 | 161939  | dismissed           |                 2266 |
| 44edb1270c8c43cb1467573134518 | 191212  | error               |                  185 |
| 44edb1270c8c43cb1467573134518 | 191242  | error               |                  185 |
| 460fb9173ffd9fd11467528018780 | 064024  | dismissed           |                 2365 |
| 460fb9173ffd9fd11467528018780 | 064134  | dismissed           |                 2365 |
| 49581efab44997c71467570784875 | 183329  | dismissed           |                22622 |
| 49581efab44997c71467570784875 | 183549  | dismissed           |                22622 |
| 4e891208457a5f0b1467570735397 | 183219  | dismissed           |                 1878 |
| 4e891208457a5f0b1467570735397 | 183549  | dismissed           |                 1878 |
| 5671aa7c6aee55eb1467528015191 | 064018  | error               |                  115 |
| 5671aa7c6aee55eb1467528015191 | 064134  | error               |                  115 |
| 5af4f318556ca5d71467538990335 | 094311  | dismissed           |                 2102 |
| 5af4f318556ca5d71467538990335 | 094428  | dismissed           |                 2102 |
| 5c1d2aca978473641467545142362 | 112544  | dismissed           |                 3190 |
| 5c1d2aca978473641467545142362 | 112544  | dismissed           |                 3190 |
| 5e65e10bbadaa9a81467563696283 | 163456  | dismissed           |                 1393 |
| 5e65e10bbadaa9a81467563696283 | 164052  | dismissed           |                 1393 |
| 676a15f02f56db721467573167277 | 191245  | opened in same tab  |                  255 |
| 676a15f02f56db721467573167277 | 191245  | opened in same tab  |                  255 |
| 750bbf9436a856ad1467562690309 | 161809  | dismissed           |                  286 |
| 750bbf9436a856ad1467562690309 | 161809  | dismissed           |                  286 |
| 7bf94504066aae9e1467562625430 | 161706  | dismissed           |                 2285 |
| 7bf94504066aae9e1467562625430 | 161706  | dismissed           |                 2285 |
| 7dc3696ed086e6a21467545142003 | 112541  | dwelledButAbandoned |                  327 |
| 7dc3696ed086e6a21467545142003 | 112541  | dwelledButAbandoned |                  327 |
| 7e406a09711e2d4b1467561413609 | 155659  | opened in same tab  |                 1859 |
| 7e406a09711e2d4b1467561413609 | 155823  | opened in same tab  |                 1859 |
| 874c0fcf043959991467545151338 | 112550  | dwelledButAbandoned |                  376 |
| 874c0fcf043959991467545151338 | 112550  | dwelledButAbandoned |                  376 |
| 87691e6b08a03dcd1467562568683 | 161607  | error               |                   74 |
| 87691e6b08a03dcd1467562568683 | 161700  | error               |                   74 |
| 8c74b454e4138f3f1467571152198 | 183918  | dwelledButAbandoned |                  391 |
| 8c74b454e4138f3f1467571152198 | 183948  | dwelledButAbandoned |                  391 |
| 8dd21852df69b40d1467573171176 | 191249  | dismissed           |                   74 |
| 8dd21852df69b40d1467573171176 | 191249  | dismissed           |                   74 |
| 8ea748749f6f8d9c1467564059000 | 164100  | dismissed           |                 1964 |
| 8ea748749f6f8d9c1467564059000 | 164100  | dismissed           |                 1964 |
| 92c75e84fc2e6e5f1467545105118 | 112504  | dwelledButAbandoned |                  503 |
| 92c75e84fc2e6e5f1467545105118 | 112504  | dwelledButAbandoned |                  503 |
| 944fc9254dfb5f8e1467538801381 | 094001  | dismissed           |                 1012 |
| 944fc9254dfb5f8e1467538801381 | 094428  | dismissed           |                 1012 |
| 94c18735084c5b1b1467545081005 | 112440  | error               |                  113 |
| 94c18735084c5b1b1467545081005 | 112502  | error               |                  113 |
| 99a7c4f415e059ec1467561370031 | 155614  | error               |                   78 |
| 99a7c4f415e059ec1467561370031 | 155823  | error               |                   78 |
| 9ceabb72417784111467533058180 | 080430  | dwelledButAbandoned |                 2122 |
| 9ceabb72417784111467533058180 | 080500  | dwelledButAbandoned |                 2122 |
| 9eeb943e0d81d2f11467570608365 | 183015  | dismissed           |                 1255 |
| 9eeb943e0d81d2f11467570608365 | 183125  | dismissed           |                 1255 |
| a29dbef2b1d208791467562628433 | 161708  | opened in same tab  |                  818 |
| a29dbef2b1d208791467562628433 | 161708  | opened in same tab  |                  818 |
| a6d6d1ae4aebb4511467562781940 | 161941  | opened in same tab  |                  672 |
| a6d6d1ae4aebb4511467562781940 | 161941  | opened in same tab  |                  672 |
| ab0147f7b6d18d821467573248755 | 191408  | dismissed           |                 1170 |
| ab0147f7b6d18d821467573248755 | 191408  | dismissed           |                 1170 |
+-------------------------------+---------+---------------------+----------------------+
100 rows in set (3.86 sec)

A sample of such duplicate events for the control group, from before June 16:

SELECT dupetokenlist.event_linkInteractionToken AS linkInteractionToken, daytime, event_action AS action, event_totalInteractionTime AS totalInteractionTime
FROM 
	(SELECT event_linkInteractionToken,	COUNT(*) AS copies 
	FROM log.Popups_15597282
	WHERE wiki ='huwiki' AND event_isAnon = 1 
	AND event_popupEnabled = 0
	AND timestamp LIKE '20160614%'
	AND event_linkInteractionToken IS NOT NULL
	GROUP BY event_linkInteractionToken
	HAVING copies>1) AS dupetokenlist
JOIN 
	(SELECT event_linkInteractionToken, event_action, event_totalInteractionTime, MID(timestamp,9,6) AS daytime
	FROM log.Popups_15597282
	WHERE wiki ='huwiki' AND event_isAnon = 1 
	AND event_popupEnabled = 0
	AND timestamp LIKE '20160614%'
	AND event_linkInteractionToken IS NOT NULL) AS allevents
ON dupetokenlist.event_linkInteractionToken = allevents.event_linkInteractionToken
ORDER BY linkInteractionToken, daytime, totalInteractionTime
LIMIT 100;
+-------------------------------+---------+---------------------+----------------------+
| linkInteractionToken          | daytime | action              | totalInteractionTime |
+-------------------------------+---------+---------------------+----------------------+
| 01073e81ab1c19861465926651575 | 175057  | dwelledButAbandoned |                 1998 |
| 01073e81ab1c19861465926651575 | 175204  | dwelledButAbandoned |                 1998 |
| 05a0d1e9688c50891465881120040 | 051200  | dwelledButAbandoned |                  434 |
| 05a0d1e9688c50891465881120040 | 051238  | dwelledButAbandoned |                  434 |
| 13ac682d77122a951465936610006 | 203653  | dwelledButAbandoned |                  258 |
| 13ac682d77122a951465936610006 | 203749  | dwelledButAbandoned |                  258 |
| 15b969127b6b1bcd1465881125791 | 051206  | dwelledButAbandoned |                  605 |
| 15b969127b6b1bcd1465881125791 | 051238  | dwelledButAbandoned |                  605 |
| 18fe207dba3af6351465925953998 | 173919  | dwelledButAbandoned |                 1688 |
| 18fe207dba3af6351465925953998 | 175204  | dwelledButAbandoned |                 1688 |
| 1ba871d1324fed411465926640238 | 175045  | dwelledButAbandoned |                  623 |
| 1ba871d1324fed411465926640238 | 175204  | dwelledButAbandoned |                  623 |
| 1fc2b3a664284eeb1465909745410 | 130917  | dwelledButAbandoned |                  496 |
| 1fc2b3a664284eeb1465909745410 | 130917  | dwelledButAbandoned |                  496 |
| 2be86073bdd0eb0d1465901561303 | 105242  | dwelledButAbandoned |                  622 |
| 2be86073bdd0eb0d1465901561303 | 105242  | dwelledButAbandoned |                  622 |
| 2cb3bccf157f49631465926541820 | 174906  | dwelledButAbandoned |                  836 |
| 2cb3bccf157f49631465926541820 | 175204  | dwelledButAbandoned |                  836 |
| 2e9bad0f60b8e40e1465926245136 | 174409  | dwelledButAbandoned |                  554 |
| 2e9bad0f60b8e40e1465926245136 | 175204  | dwelledButAbandoned |                  554 |
| 2ef9718eadfd0b011465926729826 | 175214  | opened in same tab  |                  575 |
| 2ef9718eadfd0b011465926729826 | 175214  | opened in same tab  |                  575 |
| 3401ce624e0350061465926086937 | 174132  | dwelledButAbandoned |                 1164 |
| 3401ce624e0350061465926086937 | 175204  | dwelledButAbandoned |                 1164 |
| 3879d4c8005a8cc11465926442557 | 174727  | dwelledButAbandoned |                  422 |
| 3879d4c8005a8cc11465926442557 | 175204  | dwelledButAbandoned |                  422 |
| 4089cf2a46eb55221465928595465 | 182317  | dwelledButAbandoned |                  408 |
| 4089cf2a46eb55221465928595465 | 182346  | dwelledButAbandoned |                  408 |
| 440898b7b61fd73b1465926325018 | 174529  | dwelledButAbandoned |                  277 |
| 440898b7b61fd73b1465926325018 | 175204  | dwelledButAbandoned |                  277 |
| 449119c0f4b4d33f1465925880731 | 173808  | dwelledButAbandoned |                 3607 |
| 449119c0f4b4d33f1465925880731 | 175204  | dwelledButAbandoned |                 3607 |
| 47d2ea4e33989af71465926330714 | 174535  | dwelledButAbandoned |                  398 |
| 47d2ea4e33989af71465926330714 | 175204  | dwelledButAbandoned |                  398 |
| 517954c6ed52c08e1465915560081 | 144601  | dwelledButAbandoned |                 1373 |
| 517954c6ed52c08e1465915560081 | 145008  | dwelledButAbandoned |                 1373 |
| 6019b24ef33921c71465926748311 | 175233  | dwelledButAbandoned |                  479 |
| 6019b24ef33921c71465926748311 | 175233  | dwelledButAbandoned |                  479 |
| 62380703fb632d141465925945537 | 173910  | dwelledButAbandoned |                  586 |
| 62380703fb632d141465925945537 | 175204  | dwelledButAbandoned |                  586 |
| 63947481036071041465926683129 | 175128  | dwelledButAbandoned |                  782 |
| 63947481036071041465926683129 | 175204  | dwelledButAbandoned |                  782 |
| 6582e3c02f6651341465926638658 | 175044  | dwelledButAbandoned |                 1524 |
| 6582e3c02f6651341465926638658 | 175204  | dwelledButAbandoned |                 1524 |
| 6b138084ab86b5d61465926636431 | 175041  | dwelledButAbandoned |                  570 |
| 6b138084ab86b5d61465926636431 | 175204  | dwelledButAbandoned |                  570 |
| 6b93cf38b9bd26101465925947866 | 173912  | dwelledButAbandoned |                  280 |
| 6b93cf38b9bd26101465925947866 | 175204  | dwelledButAbandoned |                  280 |
| 7a45d552370c3c711465928627020 | 182348  | opened in same tab  |                   77 |
| 7a45d552370c3c711465928627020 | 182348  | opened in same tab  |                   77 |
| 8156ff7a60cab8931465926088531 | 174133  | dwelledButAbandoned |                  258 |
| 8156ff7a60cab8931465926088531 | 175204  | dwelledButAbandoned |                  258 |
| 82f0e6829a22b4621465926661799 | 175107  | dwelledButAbandoned |                 1766 |
| 82f0e6829a22b4621465926661799 | 175204  | dwelledButAbandoned |                 1766 |
| 8ccbab0720ffbd381465901563835 | 105244  | dwelledButAbandoned |                  288 |
| 8ccbab0720ffbd381465901563835 | 105244  | dwelledButAbandoned |                  288 |
| 9447714d7ab419541465926544842 | 174910  | opened in same tab  |                 1150 |
| 9447714d7ab419541465926544842 | 175204  | opened in same tab  |                 1150 |
| 949022b67be2b71b1465925916128 | 173841  | dwelledButAbandoned |                 1510 |
| 949022b67be2b71b1465925916128 | 175204  | dwelledButAbandoned |                 1510 |
| 96bbb434abf5e4451465926661097 | 175105  | dwelledButAbandoned |                  406 |
| 96bbb434abf5e4451465926661097 | 175204  | dwelledButAbandoned |                  406 |
| 97edd347bc5547531465926450691 | 174735  | dwelledButAbandoned |                  740 |
| 97edd347bc5547531465926450691 | 175204  | dwelledButAbandoned |                  740 |
| 98b4bf0a88b929d01465928637969 | 182400  | dwelledButAbandoned |                  837 |
| 98b4bf0a88b929d01465928637969 | 182400  | dwelledButAbandoned |                  837 |
| 9dc81065ea8230541465926650767 | 175055  | dwelledButAbandoned |                  728 |
| 9dc81065ea8230541465926650767 | 175204  | dwelledButAbandoned |                  728 |
| 9e07c5ae01b4a1b61465901564292 | 105244  | dwelledButAbandoned |                  258 |
| 9e07c5ae01b4a1b61465901564292 | 105244  | dwelledButAbandoned |                  258 |
| 9f8312ebaf0c0f931465915559395 | 144600  | dwelledButAbandoned |                  546 |
| 9f8312ebaf0c0f931465915559395 | 145008  | dwelledButAbandoned |                  546 |
| a22964761ae1753a1465926451438 | 174735  | opened in same tab  |                  151 |
| a22964761ae1753a1465926451438 | 175204  | opened in same tab  |                  151 |
| ae00dafdf90699a41465937842796 | 205726  | dwelledButAbandoned |                 2077 |
| ae00dafdf90699a41465937842796 | 205850  | dwelledButAbandoned |                 2077 |
| b6e1b128a7f1b8b71465926681411 | 175125  | dwelledButAbandoned |                  256 |
| b6e1b128a7f1b8b71465926681411 | 175204  | dwelledButAbandoned |                  256 |
| b7e17793f8c39e2b1465926658541 | 175103  | dwelledButAbandoned |                  400 |
| b7e17793f8c39e2b1465926658541 | 175204  | dwelledButAbandoned |                  400 |
| ba850a4d8c7d792b1465889227034 | 072710  | dwelledButAbandoned |                 2973 |
| ba850a4d8c7d792b1465889227034 | 072752  | dwelledButAbandoned |                 2973 |
| bb59b87b1b5d17641465926748801 | 175233  | opened in same tab  |                  133 |
| bb59b87b1b5d17641465926748801 | 175233  | opened in same tab  |                  133 |
| bcdd6ff9e15c03661465926444791 | 174734  | dwelledButAbandoned |                 5430 |
| bcdd6ff9e15c03661465926444791 | 175204  | dwelledButAbandoned |                 5430 |
| c8f0a43e878aacf81465926078875 | 174123  | dwelledButAbandoned |                  460 |
| c8f0a43e878aacf81465926078875 | 175204  | dwelledButAbandoned |                  460 |
| ca2fca01cf1874561465926690638 | 175144  | dwelledButAbandoned |                 9650 |
| ca2fca01cf1874561465926690638 | 175204  | dwelledButAbandoned |                 9650 |
| cc56fd8c6418c6931465926648767 | 175053  | dwelledButAbandoned |                  336 |
| cc56fd8c6418c6931465926648767 | 175204  | dwelledButAbandoned |                  336 |
| d028f0ff2a14a45f1465925862378 | 173746  | dwelledButAbandoned |                  281 |
| d028f0ff2a14a45f1465925862378 | 175204  | dwelledButAbandoned |                  281 |
| d5599743c73f48be1465926539498 | 174903  | dwelledButAbandoned |                  282 |
| d5599743c73f48be1465926539498 | 175204  | dwelledButAbandoned |                  282 |
| d90bce31bdcbfb061465926630272 | 175035  | dwelledButAbandoned |                 1176 |
| d90bce31bdcbfb061465926630272 | 175204  | dwelledButAbandoned |                 1176 |
| da7f30107b82de801465926543296 | 174908  | dwelledButAbandoned |                  726 |
| da7f30107b82de801465926543296 | 175204  | dwelledButAbandoned |                  726 |
+-------------------------------+---------+---------------------+----------------------+
100 rows in set (2 min 14.24 sec)

Here are histograms showing the distribution of action types during the first two seconds of hover time. These are based on the data from before the fix for T137059: Do not log errors when they are actually client-initiated XHR cancellations and also do not yet use the (hypothesized) deduplication correction for T140485: Schema:Popups logs "dwelledButAbandoned" and link open events at the same time, which will shrink the orange bars in the second chart a bit. (Also, I should tweak the axis labels to make them more readable, and make the y-axis scales consistent for easier visual comparison.)

But we can already make some observations:

  1. Looking at the second chart (which is basically depicting generic browsing behavior on a normal web page without large link popups), it appears that normally most link open events (green+beige area) occur within the first 250ms. It's striking that this bump is basically entirely absent in the test group. Either almost all readers have learned already to wait for the hovercard instead of clicking immediately on a link as they usually do. Or the instrumentation misses a lot of link opening events below 250ms. Is it possible that some of the XHR cancellation events that we have now removed entirely in T137059 should instead be logged as link opening events? In any case, this presents a serious concern about the validity of comparing the link open numbers between test and control.
  2. Between 250ms and 500ms (when the card kicks in), user behavior actually looks pretty similar (keep in mind that the scales differ and that the orange part of the second one is assumed to contain some spurious events). That's another reason for suspecting that the test group data misses link open events below 250ms.
  3. Looking closely at the first chart, we can already answer the first question in the "Diagnostic" group approximately: "Is it ever the case that “perceived” wait (amount of time before hover shows) exceeds 'popup delay' (amount of time to trigger) by more than 200 ms?" There's almost no orange visible to the right of 700ms, so we expect that this is basically never the case.

Frequency of action types over time (including XHR cancel _errors_), popups enabled.png (1×1 px, 97 KB)

Frequency of action types over time (including dwell+open dupes), popups disabled.png (523×1 px, 87 KB)

Data via:

SELECT FLOOR(event_totalInteractionTime/10) AS bucket, event_action AS action, COUNT(*) AS frequency
FROM log.Popups_15597282
WHERE wiki ='huwiki'
AND event_isAnon = 1
AND LEFT(timestamp, 8) > '20160607'
AND LEFT(timestamp, 8) < '20160707'
AND event_popupEnabled = 1
AND event_linkInteractionToken IS NOT NULL
GROUP BY bucket, action
ORDER BY bucket, action;

SELECT FLOOR(event_totalInteractionTime/10) AS bucket, event_action AS action, COUNT(*) AS frequency
FROM log.Popups_15597282
WHERE wiki ='huwiki'
AND event_isAnon = 1
AND LEFT(timestamp, 8) > '20160607'
AND LEFT(timestamp, 8) < '20160707'
AND event_popupEnabled = 0
AND event_linkInteractionToken IS NOT NULL
GROUP BY bucket, action
ORDER BY bucket, action;

The ratio of hovers where the reader opens the linked page after seeing the hovercard (basically the share of the green area to the right of 500ms in the first chart above) is around 15%. If one only looks at hovers where the card was shown for at least one second, the ratio is even lower: around 8%.

SELECT SUM(IF(event_action = 'opened in new tab' OR event_action = 'opened in new window' OR event_action = 'opened in same tab',1,0))/SUM(1)
AS clickthrough_ratio
FROM log.Popups_15597282
WHERE wiki ='huwiki'
AND event_isAnon = 1
AND LEFT(timestamp, 8) > '20160607'
AND LEFT(timestamp, 8) < '20160707'
AND event_totalInteractionTime > event_perceivedWait #i.e. card was shown
AND event_linkInteractionToken IS NOT NULL;
+--------------------+
| clickthrough_ratio |
+--------------------+
|             0.1513 |
+--------------------+
1 row in set (27.47 sec)

SELECT SUM(IF(event_action = 'opened in new tab' OR event_action = 'opened in new window' OR event_action = 'opened in same tab',1,0))/SUM(1)
AS clickthrough_ratio
FROM log.Popups_15597282
WHERE wiki ='huwiki'
AND event_isAnon = 1
AND LEFT(timestamp, 8) > '20160607'
AND LEFT(timestamp, 8) < '20160707'
AND event_totalInteractionTime > event_perceivedWait + 1000 #i.e. card was shown for at least one second
AND event_linkInteractionToken IS NOT NULL;
+--------------------+
| clickthrough_ratio |
+--------------------+
|             0.0811 |
+--------------------+
1 row in set (26.06 sec)

Now to the "rate of erroneous triggers" question. I should note that @JKatzWMF and I had a bit of a friendly disagreement about the suggested method for this ("Estimated by taking the dwelledbutAbandoned time length in control group and seeing how many are above the trigger time. Apply # of these per page to the number of hovers in experimental"), because I believe that a substantial amount of link dwells in the control group - and on any web page - are likely intentional. We actually already have a MediaWiki feature built specifically for this user behavior (the small black popups with the linked page title that are shown to every reader on any Wikipedia page); the interface of this site here, Phabricator, has many mouseovers for links too, as do many other sites, and browsers support URL previewing on mouseover. What's more, I think the second chart above is evidence for intentional dwelling, too.

That said, let's go with this assumption for the moment (that all such dwelledbutAbandoned events in the control group are unintentional) and do the comparison as planned. It turns out that the average number of these events per pageview is even slightly larger than the average number of triggered hovercards in the test group (not quite surprising considering this earlier result). In other words, more than 100% of hovercards would be triggered erroneously ;)

PS: this does not yet incorporate the aforementioned hypothesized duplication correction for T140485 - some of these dwelledbutAbandoned events in control might be spurious - but from the earlier count of duplicate events, we don't expect this correction to be very large, and 90% (say) erroneous hovercard triggers would still be a very surprising result.

(Another concern about this calculation might be that the average is not very robust against outliers.)

SELECT AVG(dwells_above_trigger_time) FROM
	(SELECT event_pageToken, COUNT(*) AS dwells_above_trigger_time
	FROM log.Popups_15597282
	WHERE wiki ='huwiki'
	AND event_isAnon = 1
	AND LEFT(timestamp, 8) > '20160607'
	AND LEFT(timestamp, 8) < '20160707'
	AND event_popupEnabled = 0
	AND event_action = 'dwelledButAbandoned'
	AND event_totalInteractionTime > 500
	GROUP BY event_pageToken) AS pagesessions;
+--------------------------------+
| AVG(dwells_above_trigger_time) |
+--------------------------------+
|                         2.6599 |
+--------------------------------+
1 row in set (35.06 sec)


compare with test:
SELECT AVG(hovercards_triggered) FROM
	(SELECT event_pageToken, COUNT(*) AS hovercards_triggered
	FROM log.Popups_15597282
	WHERE wiki ='huwiki'
	AND event_isAnon = 1
	AND LEFT(timestamp, 8) > '20160607'
	AND LEFT(timestamp, 8) < '20160707'
	AND event_popupEnabled = 1
	AND event_linkInteractionToken IS NOT NULL
	AND event_totalInteractionTime > 500
	GROUP BY event_pageToken) AS pagesessions;
+---------------------------+
| AVG(hovercards_triggered) |
+---------------------------+
|                    2.6445 |
+---------------------------+
1 row in set (34.05 sec)

Regarding the frequency of error states: Now that T137059 has been resolved, errors are (as expected from the earlier result above) very rare, occurring in less than 0.1% of link interactions. As before, all are of type "http".

SELECT SUM(IF(event_action = 'error',1,0))/SUM(1)
FROM log.Popups_15597282
WHERE wiki ='huwiki'
AND event_isAnon = 1
AND LEFT(timestamp, 8) > '20160714'
AND LEFT(timestamp, 8) < '20160719'
AND event_popupEnabled = 1
AND event_linkInteractionToken IS NOT NULL;
+--------------------------------------------+
| SUM(IF(event_action = 'error',1,0))/SUM(1) |
+--------------------------------------------+
|                                     0.0006 |
+--------------------------------------------+
1 row in set (4.78 sec)

SELECT event_errorState, COUNT(*) AS frequency
FROM log.Popups_15597282
WHERE wiki ='huwiki'
AND event_isAnon = 1
AND LEFT(timestamp, 8) > '20160714'
AND LEFT(timestamp, 8) < '20160719'
AND event_popupEnabled = 1
AND event_action = 'error'
GROUP BY event_errorState
ORDER BY frequency DESC;
+------------------+-----------+
| event_errorState | frequency |
+------------------+-----------+
| http             |        58 |
+------------------+-----------+
1 row in set (7.69 sec)

About the first question in the task, on whether the number of links hovered per page increases or decreases:

First, excluding link interactions shorter than 300ms (analogously as in the result above about the number of non-opening link interactions per browser session), this number decreased from around 1.1 to 0.9:

SELECT event_popupEnabled, 
count(DISTINCT event_linkInteractionToken)/count(DISTINCT event_pageToken) AS link_interactions_per_page
FROM log.Popups_15597282
WHERE wiki ='huwiki'
AND event_isAnon = 1
AND LEFT(timestamp, 8) > '20160607'
AND LEFT(timestamp, 8) < '20160707'
AND (event_action = 'pageLoaded' OR event_totalInteractionTime > 300)
GROUP BY event_popupEnabled;
+--------------------+----------------------------+
| event_popupEnabled | link_interactions_per_page |
+--------------------+----------------------------+
|                  0 |                     1.0889 |
|                  1 |                     0.8824 |
+--------------------+----------------------------+
2 rows in set (50.24 sec)

Alternatively, looking at link interactions of all durations (now that the XHR cancellations have been removed in T137059), the average number decreases even more, from around 1.4 to 1.0:

SELECT event_popupEnabled, 
count(DISTINCT event_linkInteractionToken)/count(DISTINCT event_pageToken) AS link_interactions_per_page
FROM log.Popups_15597282
WHERE wiki ='huwiki'
AND event_isAnon = 1
AND LEFT(timestamp, 8) > '20160714'
AND LEFT(timestamp, 8) < '20160719'
AND (event_action = 'pageLoaded' OR event_linkInteractionToken IS NOT NULL)
GROUP BY event_popupEnabled;
+--------------------+----------------------------+
| event_popupEnabled | link_interactions_per_page |
+--------------------+----------------------------+
|                  0 |                     1.3798 |
|                  1 |                     1.0356 |
+--------------------+----------------------------+
2 rows in set (8.56 sec)

This is not surprising given the observations above about the missing peak of quick link open events (below 250ms) in the test group. ( T137059 basically removed the entire red area from the first chart.)

As before, a small caveat that averages are not very robust against outliers - I may do some checks regarding this later, but would be surprised if the conclusion would change.

And consistent with this observation about the "missing quick link open peak", the decrease in links or hovers clicked (question #1 in "Impact on pageviews and overall engagement") is even more pronounced:

SELECT event_popupEnabled, 
count(DISTINCT event_linkInteractionToken)/count(DISTINCT event_pageToken) AS link_opens_per_page
FROM log.Popups_15597282
WHERE wiki ='huwiki'
AND event_isAnon = 1
AND LEFT(timestamp, 8) > '20160607'
AND LEFT(timestamp, 8) < '20160707'
AND (event_action = 'pageLoaded' OR 
  (event_action = 'opened in new tab'
  OR event_action = 'opened in new window'
  OR event_action = 'opened in same tab'))
GROUP BY event_popupEnabled;
+--------------------+---------------------+
| event_popupEnabled | link_opens_per_page |
+--------------------+---------------------+
|                  0 |              0.3676 |
|                  1 |              0.1654 |
+--------------------+---------------------+
2 rows in set (50.57 sec)

And the impact on the total number of link interactions per session (we already looked this number per pageview above, as well as the number of non-open link interactions per session and short link interactions per session). This decreased from 3.7 to 2.6, again if one believes that the "missing quick link open peak" is real.

SELECT event_popupEnabled, 
count(DISTINCT event_linkInteractionToken)/count(DISTINCT event_sessionToken) AS link_interactions_per_session
FROM log.Popups_15597282
WHERE wiki ='huwiki'
AND event_isAnon = 1
AND LEFT(timestamp, 8) > '20160714'
AND LEFT(timestamp, 8) < '20160719'
AND (event_action = 'pageLoaded' OR event_linkInteractionToken IS NOT NULL)
GROUP BY event_popupEnabled;
+--------------------+-------------------------------+
| event_popupEnabled | link_interactions_per_session |
+--------------------+-------------------------------+
|                  0 |                        3.7135 |
|                  1 |                        2.5827 |
+--------------------+-------------------------------+
2 rows in set (8.49 sec)

Lastly, the "descriptive" part of the task (see also charts above):

How long do people spend hovering before they click?

duration_before_opening

count68030.000000
mean1504.389343
std4432.833970
min0.000000
25%130.000000
50%348.000000
75%1292.000000
max301788.000000

How long do people spend hovering before they dismiss the hover?
duration_before_dismissing

count3.797350e+05
mean7.268632e+03
std1.673941e+06
min0.000000e+00
25%6.750000e+02
50%1.250000e+03
75%2.731000e+03
max1.028620e+09

Data via:

SELECT event_totalInteractionTime - event_perceivedWait AS duration_before_opening
FROM log.Popups_15597282
WHERE wiki ='huwiki'
AND event_isAnon = 1
AND LEFT(timestamp, 8) > '20160607'
AND LEFT(timestamp, 8) < '20160707'
AND event_popupEnabled = 1
AND event_perceivedWait IS NOT NULL
AND (event_action = 'opened in new tab'
  OR event_action = 'opened in new window'
  OR event_action = 'opened in same tab')

(in pandas:)

link_open_durations.describe()

and

SELECT event_totalInteractionTime - event_perceivedWait AS duration_before_dismissing
FROM log.Popups_15597282
WHERE wiki ='huwiki'
AND event_isAnon = 1
AND LEFT(timestamp, 8) > '20160607'
AND LEFT(timestamp, 8) < '20160707'
AND event_popupEnabled = 1
AND event_perceivedWait IS NOT NULL
AND event_action = 'dismissed';

(in pandas:)

dismiss_durations.describe()

Adding to the earlier histograms, here is an analogous one for the test group drawing from the data after T137059: Do not log errors when they are actually client-initiated XHR cancellations was fixed.

Frequency of action types over time (after fix for XHR cancel _errors_), popups enabled.png (931×2 px, 96 KB)

No surprises here; the comparison with F4288408 confirms that the XHR errors were indeed simply removed, leaving the lack of link open clicks below 250ms (in comparison with F4288410) unexplained for now.

BTW, note that in this magnification scale we can actually discern some purple "dismissed" events below 500ms (i.e. before the card would be visible), which shouldn't be there; they also showed up in Adam's table above. Their number is small enough not to affect conclusions though.

Data from

SELECT FLOOR(event_totalInteractionTime/10) AS bucket, event_action AS action, COUNT(*) AS frequency
FROM log.Popups_15597282
WHERE wiki ='huwiki'
AND event_isAnon = 1
AND LEFT(timestamp, 8) > '20160714'
AND LEFT(timestamp, 8) < '20160720'
AND event_popupEnabled = 1
AND event_linkInteractionToken IS NOT NULL
GROUP BY bucket, action
ORDER BY bucket, action

No surprises here; the comparison with F4288408 confirms that the XHR errors were indeed simply removed, leaving the lack of link open clicks below 250ms (in comparison with F4288410) unexplained for now.

This is troubling, because when I ran the following analysis, I found that 71% of all clicks in the control bucket were <250 ms. This suggests we are dramatically undercounting clicks in the experimental group. @dr0ptp4kt any ideas?


SELECT count(*) AS num_events, event_action, event_popupEnabled,
IF(event_totalinteractionTime < 250, "short", "long") AS timeLength
FROM Popups_15777589
Where wiki LIKE '%hu%'
GROUP BY event_action, event_popupEnabled
ORDER BY num_events DESC
;

As described here (1.) last week and also just emphasized by Jon, we need to understand why the test group has very few link open events below 250ms, whereas in the control group most of them are concentrated there.

As mentioned earlier, one hypothesis explaining this difference would be that almost all readers in the test group have already learned to wait for the hovercard instead of clicking immediately on a link as they usually do. Below are three tests of this hypothesis, and it looks like it is failing all of them.

Let's call these link clicks below 250ms "fast opens" for short, and the hypothesis the "unlearned fast-opens hypothesis". (Of course this 250ms cutoff is somewhat arbitrary, but it fully contains the peak visible in the control group and is below the 500ms point where the hovercard starts to appear in the test group, i.e. where the user experience starts to differ between test and control.)

One way to quantify the question further is to look at the ratio of fast opens among all link open events. In the charts above, it is at 49% in the control group vs. 7 % in the test group [a]. Or to examine a different timespan after the XHR cancellations issue was fixed (T137059), it's 40% in control vs. 6% in test.[b]

  1. We would expect the fast opens ratio to be identical to control for those readers in test who have never seen a Hovercard yet, i.e. did not yet have a chance to learn about the new user experience. Indeed the ratio is higher in the 0 previews bucket (events in the test group with no previous views of hovercards registered in local storage), with 16% [c] compared to 7% in the test group overall. However this is still much lower than the 49% in control. Also, taking a closer look at the event distribution over time (data source/iPython notebook: [d]) it does not look like a linear combination of the control group's distribution with something else; rather, it features a somewhat peculiar smaller peak below 50ms:

Hovercards timing frequency by action, 0 previews, July 15-27.png (600×800 px, 88 KB)

  1. Let's assume that somehow this 0 previews bucket does contain a large number of events where the reader had in fact experienced hovercards before (but perhaps local storage was reset or such). In that case, we would still expect that at the start of the experiment the test group contained a much lower ratio of such readers that had a chance to change their click behavior (basically only those who had earlier activated the beta feature while logged in), especially when we keep it restricted to anons. But the daily time series of fast open ratios shows no such development. [e]
  1. For the last test, let's compare logged-in and anonymous readers, assuming that the former are on the average more experienced and should thus show a lower fast open ratio under the hypothesis. But the opposite appears to be the case when looking at two recent timespans,[f][g] before and after the fix of T137203. The fast open ratio is actually much higher among logged-in users.

A fourth test would consist of looking at whether the fast open ratio decreases during one browser session. (Also, I haven't yet formally tested that the differences noted above are statistically significant, however it seems quite obvious that they are, considering the sample size and size of the difference in each case.)
But given the above, I am already inclined to dismiss the unlearned fast opens hypothesis.

Data sources:

[a]
SELECT event_popupEnabled AS popupEnabled, SUM(IF(event_totalInteractionTime <= 250, 1, 0))/SUM(1) AS fast_open_ratio, SUM(1) AS all_opens
FROM log.Popups_15597282
WHERE wiki ='huwiki'
AND event_isAnon = 1
AND LEFT(timestamp, 8) > '20160607'
AND LEFT(timestamp, 8) < '20160707'
AND event_action LIKE 'opened%'
GROUP BY event_popupEnabled;
+--------------+-----------------+-----------+
| popupEnabled | fast_open_ratio | all_opens |
+--------------+-----------------+-----------+
|            0 |          0.4941 |    290327 |
|            1 |          0.0700 |    122781 |
+--------------+-----------------+-----------+
2 rows in set (28.23 sec)
[b]
SELECT event_popupEnabled AS popupEnabled, SUM(IF(event_totalInteractionTime <= 250, 1, 0))/SUM(1) AS fast_open_ratio, SUM(1) AS all_opens
FROM log.Popups_15597282
WHERE wiki ='huwiki'
AND event_isAnon = 1
AND LEFT(timestamp, 8) > '20160714'
AND LEFT(timestamp, 8) < '20160727'
AND event_action LIKE 'opened%'
GROUP BY event_popupEnabled;
+--------------+-----------------+-----------+
| popupEnabled | fast_open_ratio | all_opens |
+--------------+-----------------+-----------+
|            0 |          0.4016 |    153903 |
|            1 |          0.0635 |     51278 |
+--------------+-----------------+-----------+
2 rows in set (13.43 sec)
[c]
SELECT event_previewCountBucket AS previewCount, SUM(IF(event_totalInteractionTime <= 250, 1, 0))/SUM(1) AS fast_open_ratio, SUM(1) AS all_opens
FROM log.Popups_15597282
WHERE wiki ='huwiki'
AND event_isAnon = 1
AND LEFT(timestamp, 8) > '20160607'
AND LEFT(timestamp, 8) < '20160707'
AND event_popupEnabled = 1
AND event_action LIKE 'opened%'
GROUP BY previewCount
ORDER BY previewCount;
+---------------+-----------------+-----------+
| previewCount  | fast_open_ratio | all_opens |
+---------------+-----------------+-----------+
| 0 previews    |          0.1561 |      6183 |
| 1-4 previews  |          0.0494 |     30664 |
| 21+ previews  |          0.0770 |     52931 |
| 5-20 previews |          0.0614 |     32961 |
| unknown       |          0.3571 |        42 |
+---------------+-----------------+-----------+
5 rows in set (38.03 sec)
[d]

As an experiment, I generated this chart in a public iPython notebook on PAWS; see there for the underlying SQL query.

[e]
SELECT LEFT(timestamp, 8) AS yearmonthday,
SUM(IF(event_totalInteractionTime <= 250, 1, 0))/SUM(1) AS fast_open_ratio, 
SUM(1) AS all_opens
FROM log.Popups_15597282
WHERE wiki ='huwiki'
AND event_isAnon = 1
AND LEFT(timestamp, 8) < '20160707'
AND event_popupEnabled = 1
AND event_action LIKE 'opened%'
GROUP BY yearmonthday
ORDER BY yearmonthday;
+--------------+-----------------+-----------+
| yearmonthday | fast_open_ratio | all_opens |
+--------------+-----------------+-----------+
| 20160602     |          0.0000 |        28 |
| 20160603     |          0.0119 |        84 |
| 20160604     |          0.0930 |        86 |
| 20160605     |          0.0465 |       129 |
| 20160606     |          0.0299 |       134 |
| 20160607     |          0.0664 |      1853 |
| 20160608     |          0.0686 |      4987 |
| 20160609     |          0.0673 |      4607 |
| 20160610     |          0.0788 |      4175 |
| 20160611     |          0.0784 |      4245 |
| 20160612     |          0.0733 |      5483 |
| 20160613     |          0.0664 |      4622 |
| 20160614     |          0.0506 |      4798 |
| 20160615     |          0.0762 |      4412 |
| 20160616     |          0.0658 |      3893 |
| 20160617     |          0.0540 |      4015 |
| 20160618     |          0.0671 |      3576 |
| 20160619     |          0.0726 |      4383 |
| 20160620     |          0.0731 |      4911 |
| 20160621     |          0.0672 |      4345 |
| 20160622     |          0.0714 |      3643 |
| 20160623     |          0.0715 |      4071 |
| 20160624     |          0.1070 |      3645 |
| 20160625     |          0.0684 |      3172 |
| 20160626     |          0.0707 |      3930 |
| 20160627     |          0.0692 |      4869 |
| 20160628     |          0.0612 |      4921 |
| 20160629     |          0.0603 |      3894 |
| 20160630     |          0.0710 |      3678 |
| 20160701     |          0.0770 |      3649 |
| 20160702     |          0.0772 |      3509 |
| 20160703     |          0.0685 |      4715 |
| 20160704     |          0.0811 |      4477 |
| 20160705     |          0.0552 |      4043 |
| 20160706     |          0.0681 |      4113 |
+--------------+-----------------+-----------+
35 rows in set (30.72 sec)
[f]
SELECT event_isAnon AS isAnon, event_popupEnabled AS popupEnabled, 
SUM(IF(event_totalInteractionTime <= 250, 1, 0))/SUM(1) AS fast_open_ratio, SUM(1) AS all_opens
FROM log.Popups_15597282
WHERE wiki ='huwiki'
AND LEFT(timestamp, 8) > '20160714'
AND LEFT(timestamp, 8) < '20160727'
AND event_action LIKE 'opened%'
GROUP BY isAnon, popupEnabled
ORDER BY isAnon, popupEnabled;
+--------+--------------+-----------------+-----------+
| isAnon | popupEnabled | fast_open_ratio | all_opens |
+--------+--------------+-----------------+-----------+
|      0 |            0 |          0.4448 |      4935 |
|      0 |            1 |          0.2651 |      2373 |
|      1 |            0 |          0.4016 |    153903 |
|      1 |            1 |          0.0635 |     51278 |
+--------+--------------+-----------------+-----------+
4 rows in set (11.14 sec)
[g]
SELECT event_isAnon AS isAnon, event_popupEnabled AS popupEnabled, 
SUM(IF(event_totalInteractionTime <= 250, 1, 0))/SUM(1) AS fast_open_ratio, SUM(1) AS all_opens
FROM log.Popups_15777589 # the new version of the schema, live since July 28
WHERE wiki ='huwiki'
AND event_action LIKE 'opened%'
GROUP BY isAnon, popupEnabled
ORDER BY isAnon, popupEnabled;
+--------+--------------+-----------------+-----------+
| isAnon | popupEnabled | fast_open_ratio | all_opens |
+--------+--------------+-----------------+-----------+
|      0 |            0 |          0.4140 |       215 |
|      0 |            1 |          0.1682 |       107 |
|      1 |            0 |          0.4086 |     13808 |
|      1 |            1 |          0.0480 |      5122 |
+--------+--------------+-----------------+-----------+
4 rows in set (0.57 sec)

It's sort of hard to say whether this has a significant impact, but there are oddities when you look at something like the following, trying to identify outliers in the logged out without Hovercards case for clicks below 250ms over a one day period using the new schema.

select event_sessionToken, count(*) c
from Popups_15777589
where event_isAnon = true
and event_action like 'opened%'
and event_popupEnabled = false
and timestamp > '20160729'
and wiki = 'huwiki'
and event_totalInteractionTime < 250
group by event_sessionToken
order by c desc
limit 100
;

...and then you grab the top 10 openers and look at the patterns.

select 
event_sessionToken, timestamp, event_action, event_pageTitleSource, event_pageTitleHover from Popups_15777589
where event_sessionToken in (
...
)
and timestamp > '20160729'
and event_action like 'opened%'
order by event_sessionToken, timestamp;

There seem to be lots of duplicate (or triplicate, or...) source+destination+timestamp tuples.

Now when you go do the same thing for the logged out with Hovercards ON case:

select event_sessionToken, count(*) c
from Popups_15777589
where event_isAnon = true
and event_action like 'opened%'
and event_popupEnabled = true
and timestamp > '20160729'
and wiki = 'huwiki'
and event_totalInteractionTime < 250
group by event_sessionToken
order by c desc
limit 100
;

and plug in the values:

select 
event_sessionToken, timestamp, event_action, event_pageTitleSource, event_pageTitleHover from Popups_15777589
where event_sessionToken in (
...
)
and timestamp > '20160729'
and event_action like 'opened%'
order by event_sessionToken, timestamp;

There's a fairly striking difference. Duplicate tuples seem uncommon.

This doesn't help in determining if there's something different about the eventing going on (e.g., something at the client or aggregation point is causing duplicates), the user behavior, or, when you look back earlier in the old schema instead of this new one, for instance - what appear to potentially be scripts in some cases clicking on a new link every 5 seconds (that may be rare behavior, I'm not sure, and I'm unsure how impactful it is in aggregate).

I've set some time to explore further on Tuesday with @JKatzWMF and @Tbayer.

No surprises here; the comparison with F4288408 confirms that the XHR errors were indeed simply removed, leaving the lack of link open clicks below 250ms (in comparison with F4288410) unexplained for now.

This is troubling, because when I ran the following analysis, I found that 71% of all clicks in the control bucket were <250 ms. This suggests we are dramatically undercounting clicks in the experimental group. @dr0ptp4kt any ideas?


SELECT count(*) AS num_events, event_action, event_popupEnabled,
IF(event_totalinteractionTime < 250, "short", "long") AS timeLength
FROM Popups_15777589
Where wiki LIKE '%hu%'
GROUP BY event_action, event_popupEnabled
ORDER BY num_events DESC
;

It doesn't change the main conclusion, but I think there is a GROUP BY missing in that query. With that, I'm getting 41% instead of 72% for the fast open ratio in the control group, consistent with the numbers above.

SELECT count(*) AS num_events, event_action, event_popupEnabled,
IF(event_totalinteractionTime < 250, "short", "long") AS timeLength 
FROM log.Popups_15777589 
Where wiki LIKE '%hu%' 
GROUP BY event_action, event_popupEnabled, timeLength 
ORDER BY num_events DESC;
+------------+----------------------+--------------------+------------+
| num_events | event_action         | event_popupEnabled | timeLength |
+------------+----------------------+--------------------+------------+
|      32579 | dwelledButAbandoned  |                  0 | long       |
|      32003 | pageLoaded           |                  0 | long       |
|      30799 | pageLoaded           |                  1 | long       |
|      16089 | dismissed            |                  1 | long       |
|       8452 | dwelledButAbandoned  |                  1 | long       |
|       8121 | opened in same tab   |                  0 | long       |
|       5679 | opened in same tab   |                  0 | short      |
|       4826 | opened in same tab   |                  1 | long       |
|        613 | opened in new tab    |                  0 | long       |
|        371 | opened in new tab    |                  1 | long       |
|        322 | opened in new tab    |                  0 | short      |
|        257 | opened in same tab   |                  1 | short      |
|         57 | dismissed            |                  1 | short      |
|         15 | opened in new tab    |                  1 | short      |
|          8 | error                |                  1 | short      |
|          6 | error                |                  1 | long       |
|          6 | dismissed            |                  0 | long       |
|          6 | tapped settings cog  |                  1 | long       |
|          1 | opened in new window |                  0 | long       |
|          1 | opened in new window |                  0 | short      |
|          1 | disabled             |                  1 | long       |
|          1 | opened in new window |                  1 | long       |
+------------+----------------------+--------------------+------------+
22 rows in set (0.78 sec)

(5679 + 322) / (5679 + 322 + 8121 + 613) = 0.4072...

Regarding the second group of questions, "What % of people dislike hovercards?":

According to the present data, the percentage of users who disable them is zero for practical purposes - there have been only six disable clicks logged over the entire experiment so far:

[...]

All assuming that these events are logged correctly, of course.

BTW, we can also compare the number of disables and setting taps with the number of cards shown (instead of all link interaction events). The takeaway is the same. The settings cog (and hence also the disable button) is clicked less than 0.1% of times that a hovercard appears.[1]

Again, that assumes that the instrumentation can be trusted. @JKatzWMF did a check last week where two disable actions made it into the EL table fine. On the other hand, I just noticed that almost all disable actions in the table are missing the value for the totalInteractionTime field,[2] which is another clear bug in the instrumentation, although one that is less important for the present analysis.

[1]
SELECT LEFT(timestamp, 8) AS yearmonthday, 
SUM(1) AS hovercards_shown, 
SUM(IF(event_action = 'tapped settings cog',1,0)) AS cogtaps
FROM log.Popups_15597282
WHERE wiki ='huwiki'
AND event_linkInteractionToken IS NOT NULL
AND event_totalInteractionTime > event_perceivedWait # i.e. card was shown
GROUP BY yearmonthday;
+--------------+------------------+---------+
| yearmonthday | hovercards_shown | cogtaps |
+--------------+------------------+---------+
| 20160602     |               55 |       0 |
| 20160603     |              248 |       0 |
| 20160604     |              295 |       0 |
| 20160605     |              373 |       0 |
| 20160606     |              318 |       1 |
| 20160607     |             5475 |       2 |
| 20160608     |            12807 |       7 |
| 20160609     |            12003 |       6 |
| 20160610     |            16284 |       5 |
| 20160611     |            15054 |       8 |
| 20160612     |            20317 |       7 |
| 20160613     |            18038 |       2 |
| 20160614     |            19787 |      11 |
| 20160615     |            17093 |       4 |
| 20160616     |            15384 |       6 |
| 20160617     |            13472 |       4 |
| 20160618     |            12578 |       8 |
| 20160619     |            17152 |       7 |
| 20160620     |            19128 |       2 |
| 20160621     |            16792 |       0 |
| 20160622     |            16442 |       4 |
| 20160623     |            16385 |       5 |
| 20160624     |            13370 |       7 |
| 20160625     |            12678 |       3 |
| 20160626     |            14417 |       3 |
| 20160627     |            19202 |       4 |
| 20160628     |            20185 |       4 |
| 20160629     |            15597 |       1 |
| 20160630     |            14256 |       3 |
| 20160701     |            13007 |       0 |
| 20160702     |            11862 |       7 |
| 20160703     |            16621 |       6 |
| 20160704     |            15789 |       5 |
| 20160705     |            15245 |       4 |
| 20160706     |            14403 |       2 |
| 20160707     |            15308 |       4 |
| 20160708     |            12887 |       2 |
| 20160709     |            12620 |       3 |
| 20160710     |            15150 |       4 |
| 20160711     |            15986 |       0 |
| 20160712     |            13714 |       3 |
| 20160713     |            13525 |       6 |
| 20160714     |            14863 |       4 |
| 20160715     |            14996 |       4 |
| 20160716     |            17346 |       4 |
| 20160717     |            18304 |       5 |
| 20160718     |            16120 |       4 |
| 20160719     |            16843 |       7 |
| 20160720     |            14260 |       6 |
| 20160721     |            14786 |       0 |
| 20160722     |            13539 |       2 |
| 20160723     |            12319 |       0 |
| 20160724     |            15323 |      10 |
| 20160725     |            15613 |       2 |
| 20160726     |            14869 |       7 |
| 20160727     |            14538 |       2 |
| 20160728     |            13237 |       5 |
| 20160729     |                9 |       0 |
| 20160730     |                1 |       0 |
+--------------+------------------+---------+
59 rows in set (50.04 sec)
[2]
SELECT LEFT(timestamp, 8) AS yearmonthday, wiki,
event_linkInteractionToken AS linkInteractionToken, event_totalInteractionTime AS totalInteractionTime, event_perceivedWait AS perceivedWait
FROM log.Popups_15597282
WHERE event_action = 'disabled'
ORDER BY yearmonthday;
+--------------+--------------+-------------------------------+----------------------+---------------+
| yearmonthday | wiki         | linkInteractionToken          | totalInteractionTime | perceivedWait |
+--------------+--------------+-------------------------------+----------------------+---------------+
| 20160604     | pswiktionary | ac6bbd1b409f8d721465058050272 |                 NULL |           508 |
| 20160609     | huwiki       | 735b66fb3512617b1465503345191 |                 NULL |           503 |
| 20160611     | enwiki       | 48b10ff3b753d5f31465677991170 |                 NULL |           504 |
| 20160612     | huwiki       | 251730105e1db2ef1465747763163 |                 7602 |            82 |
| 20160612     | svwiki       | b29a43e3cc3ed2191465752898362 |                 NULL |           505 |
| 20160613     | arwiki       | 2a7d904f0f89842e1465861172791 |                 NULL |           560 |
| 20160616     | huwiki       | 9dd4c48217a49ac31466077334687 |                 NULL |           501 |
| 20160617     | huwiki       | 50f27f553d0e69ca1466161026573 |                 NULL |           531 |
| 20160624     | huwiki       | 9a950888a649383e1466731419683 |                 NULL |           505 |
| 20160702     | huwiki       | 8c7f0c35b092eaa11467443865798 |                 NULL |           519 |
| 20160708     | enwiki       | 138751a94cd114841467947717210 |                 NULL |           503 |
| 20160712     | zhwiki       | 8efd508144dc4f261468306533497 |                 NULL |           527 |
| 20160719     | mswiki       | 680fe32c4f3fc4a01468901523868 |                 NULL |           526 |
| 20160719     | huwiki       | 0993d044f99e62381468954258970 |                 NULL |           511 |
| 20160719     | huwiki       | NULL                          |                 NULL |          NULL |
| 20160724     | huwiki       | 725058f9fdc7fcb01469361129524 |                 NULL |           581 |
+--------------+--------------+-------------------------------+----------------------+---------------+
16 rows in set (19.80 sec)

Here are histograms showing the distribution of action types during the first two seconds of hover time.

[...]

But we can already make some observations:

[...]

  1. Looking closely at the first chart, we can already answer the first question in the "Diagnostic" group approximately: "Is it ever the case that “perceived” wait (amount of time before hover shows) exceeds 'popup delay' (amount of time to trigger) by more than 200 ms?" There's almost no orange visible to the right of 700ms, so we expect that this is basically never the case.

PS for completeness, here are concrete numbers. Confirming what was determined earlier by looking at the histogram, these unwanted delays of more than 200ms are very rare for anonymous users, between 1%-2% of link interactions where a card is shown. The rate for logged-in users is even lower (when measured after the recent fix of T137203), at 0.8%. I also double-checked that perceived wait time is never below the lowest possible time of 500ms (it happened for 0.04% of anon interations, which is good enough).

SELECT event_isAnon AS isAnon, 
SUM(IF(event_perceivedWait > event_popupDelay + 200, 1, 0))/SUM(1) AS long_wait_for_card_ratio, 
SUM(1) AS all_waits
FROM log.Popups_15597282
WHERE wiki ='huwiki'
AND LEFT(timestamp, 8) > '20160714'
AND LEFT(timestamp, 8) < '20160801'
AND event_popupEnabled = 1
AND event_perceivedWait IS NOT NULL
GROUP BY isAnon;
+--------+--------------------------+-----------+
| isAnon | long_wait_for_card_ratio | all_waits |
+--------+--------------------------+-----------+
|      0 |                   0.0611 |      2307 |
|      1 |                   0.0169 |    209827 |
+--------+--------------------------+-----------+
2 rows in set (13.81 sec)

SELECT event_isAnon AS isAnon, 
SUM(IF(event_perceivedWait > event_popupDelay + 200, 1, 0))/SUM(1) AS long_wait_for_card_ratio, 
SUM(1) AS all_waits
FROM log.Popups_15777589 # the new version of the schema,  
# with logged in bug fixed (T137203), live since July 28
WHERE wiki ='huwiki'
AND LEFT(timestamp, 8) < '20160801'
AND event_popupEnabled = 1
AND event_perceivedWait IS NOT NULL
GROUP BY isAnon;
+--------+--------------------------+-----------+
| isAnon | long_wait_for_card_ratio | all_waits |
+--------+--------------------------+-----------+
|      0 |                   0.0079 |       507 |
|      1 |                   0.0185 |     46095 |
+--------+--------------------------+-----------+
2 rows in set (2.50 sec)

SELECT event_isAnon AS isAnon, 
SUM(IF(event_perceivedWait < event_popupDelay, 1, 0))/SUM(1) AS impossible_perceivedWait_ratio, 
SUM(1) AS all_waits
FROM log.Popups_15777589 # the new version of the schema,  
# with logged in bug fixed (T137203), live since July 28
WHERE wiki ='huwiki'
AND LEFT(timestamp, 8) < '20160801'
AND event_popupEnabled = 1
AND event_perceivedWait IS NOT NULL
GROUP BY isAnon;
+--------+--------------------------------+-----------+
| isAnon | impossible_perceivedWait_ratio | all_waits |
+--------+--------------------------------+-----------+
|      0 |                         0.0020 |       507 |
|      1 |                         0.0004 |     46095 |
+--------+--------------------------------+-----------+
2 rows in set (1.64 sec)

...On the other hand, I just noticed that almost all disable actions in the table are missing the value for the totalInteractionTime field,[2] which is another clear bug in the instrumentation, although one that is less important for the present analysis.

As I recall that part was by design, the thinking being that we were more interested in the timing to get to the cog (but really only somewhat...it's mainly capturing that the cog was tapped and, subsequent to that, that the user actively disabled). Without something like the following in the actual preview cards (e.g., for the first three hovers or something),

["x"] Keep showing previews

I'm doubtful users are likely to discover that they can disable the feature, and of course we all have gripes about the current modal for enable/disable, although that's being treated separately. Note that the enhanced modal won't deal with the cog itself; there are various competing arguments on whether the cog (the discovery affordance) needs to be revisited. There's this general question of whether it's good to actively encourage users to disable a new feature before they've gotten comfortable with it. This is why I think if we were to examine that portion we'd want to do something like a show-three-times default opted-in affordance.

...On the other hand, I just noticed that almost all disable actions in the table are missing the value for the totalInteractionTime field,[2] which is another clear bug in the instrumentation, although one that is less important for the present analysis.

As I recall that part was by design, the thinking being that we were more interested in the timing to get to the cog (but really only somewhat...it's mainly capturing that the cog was tapped and, subsequent to that, that the user actively disabled).

OK, looking at Baha's checklist: T131315#2323247 you're right (no "x" in the "disabled" column for totalInteractionTime). But then it's strange why the field actually had a value (7602 ms) for one event in the above query. In any case though, like I said, this issue is less relevant for the present analysis.

Without something like the following in the actual preview cards (e.g., for the first three hovers or something),

["x"] Keep showing previews

I'm doubtful users are likely to discover that they can disable the feature, and of course we all have gripes about the current modal for enable/disable, although that's being treated separately. Note that the enhanced modal won't deal with the cog itself; there are various competing arguments on whether the cog (the discovery affordance) needs to be revisited. There's this general question of whether it's good to actively encourage users to disable a new feature before they've gotten comfortable with it. This is why I think if we were to examine that portion we'd want to do something like a show-three-times default opted-in affordance.

I understand that's an argument about the proposal at T133230. Makes sense to me. In the present context, the main question would be whether the very low click rate for the settings cog (0.01% of hovers) is plausible.

ovasileva renamed this task from Analyze results of Hovercards A/B test to Analyze results of Hovercards A/B test - Hungarian.Sep 7 2016, 1:50 PM

@Tbayer - I was about to open a new card for the new work you've been doing - removing duplicates, post-patch, etc, but I noticed this was open. Should we track here or in a new card? (whichever is easier for you)