Steps to Reproduce:
Open: the 1000px-version of https://commons.wikimedia.org/wiki/File:Dojikko2.3.svg
https://upload.wikimedia.org/wikipedia/commons/thumb/3/36/Dojikko2.3.svg/1000px-Dojikko2.3.svg.png
Actual Results:
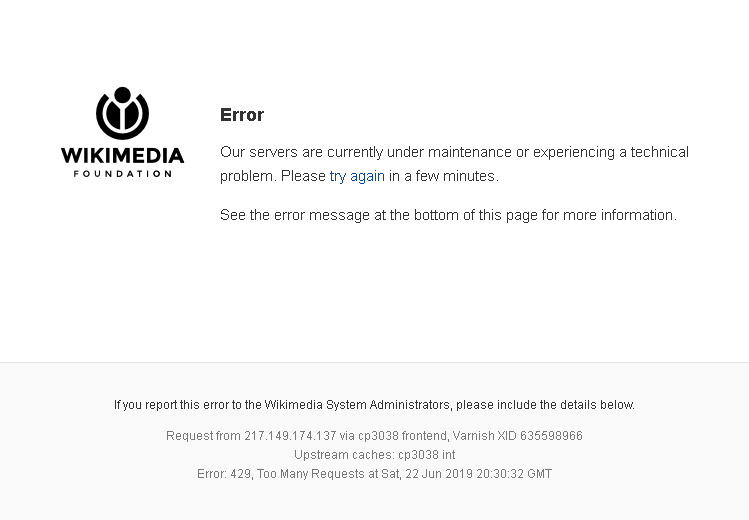
Error
Our servers are currently under maintenance or experiencing a technical problem. Please try again in a few minutes.
See the error message at the bottom of this page for more information.
If you report this error to the Wikimedia System Administrators, please include the details below.
Request from 217.149.174.137 via cp3038 frontend, Varnish XID 635598966
Upstream caches: cp3038 int
Error: 429, Too Many Requests at Sat, 22 Jun 2019 20:30:32 GMT
from: https://en.wikipedia.org/wiki/Wikipedia:SVG_help#Server_error_when_generating_SVG_thumbnail
Request from 87.112.20.249 via cp1080 cp1080, Varnish XID 228725525
Error: 500, Internal Server Error at Mon, 01 Apr 2019 20:38:04 GMT
Expected Results:
Quting Glrx from https://en.wikipedia.org/wiki/Wikipedia:SVG_help#Server_error_when_generating_SVG_thumbnail
My guess is the larger image is too complex to render in the time allotted by the server. Thus it is not a bug but a resource decision by the server managers. The image does appear to make unreasonable resource demands by filtering many small circles. Perhaps the real error is the server issued a 500 internal error rather than a 408 timeout error. Glrx (talk) 18:32, 2 April 2019 (UTC)