Page MenuHomePhabricator

Gerrit Apache out of workers
Closed, ResolvedPublic

Description

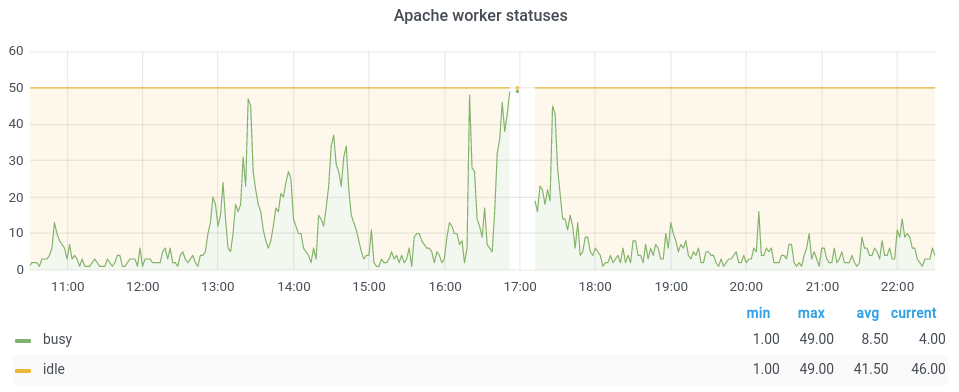
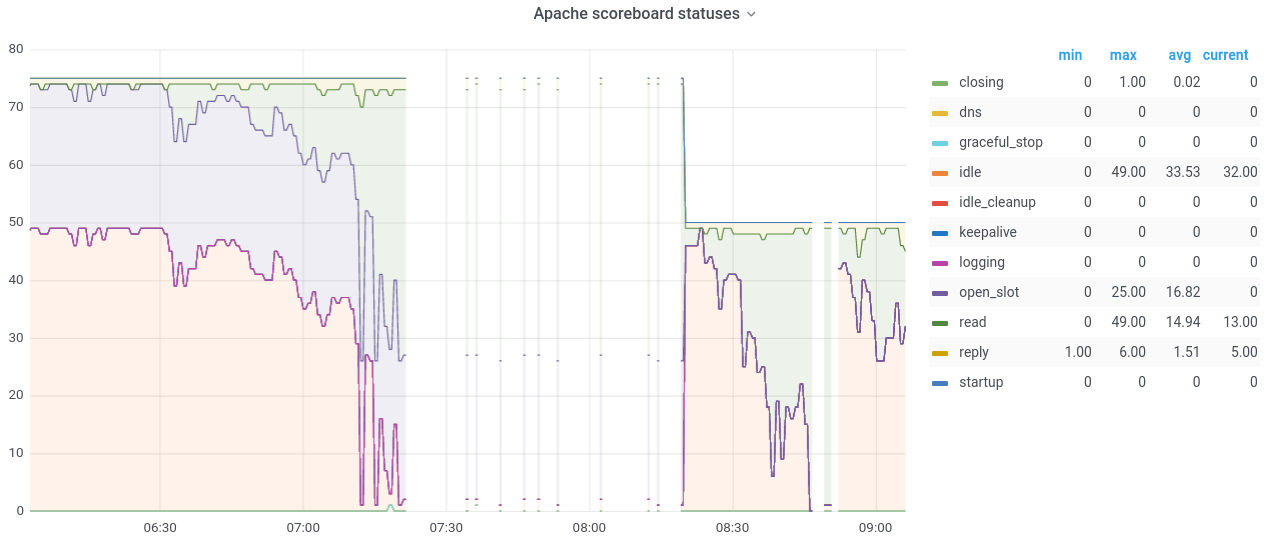
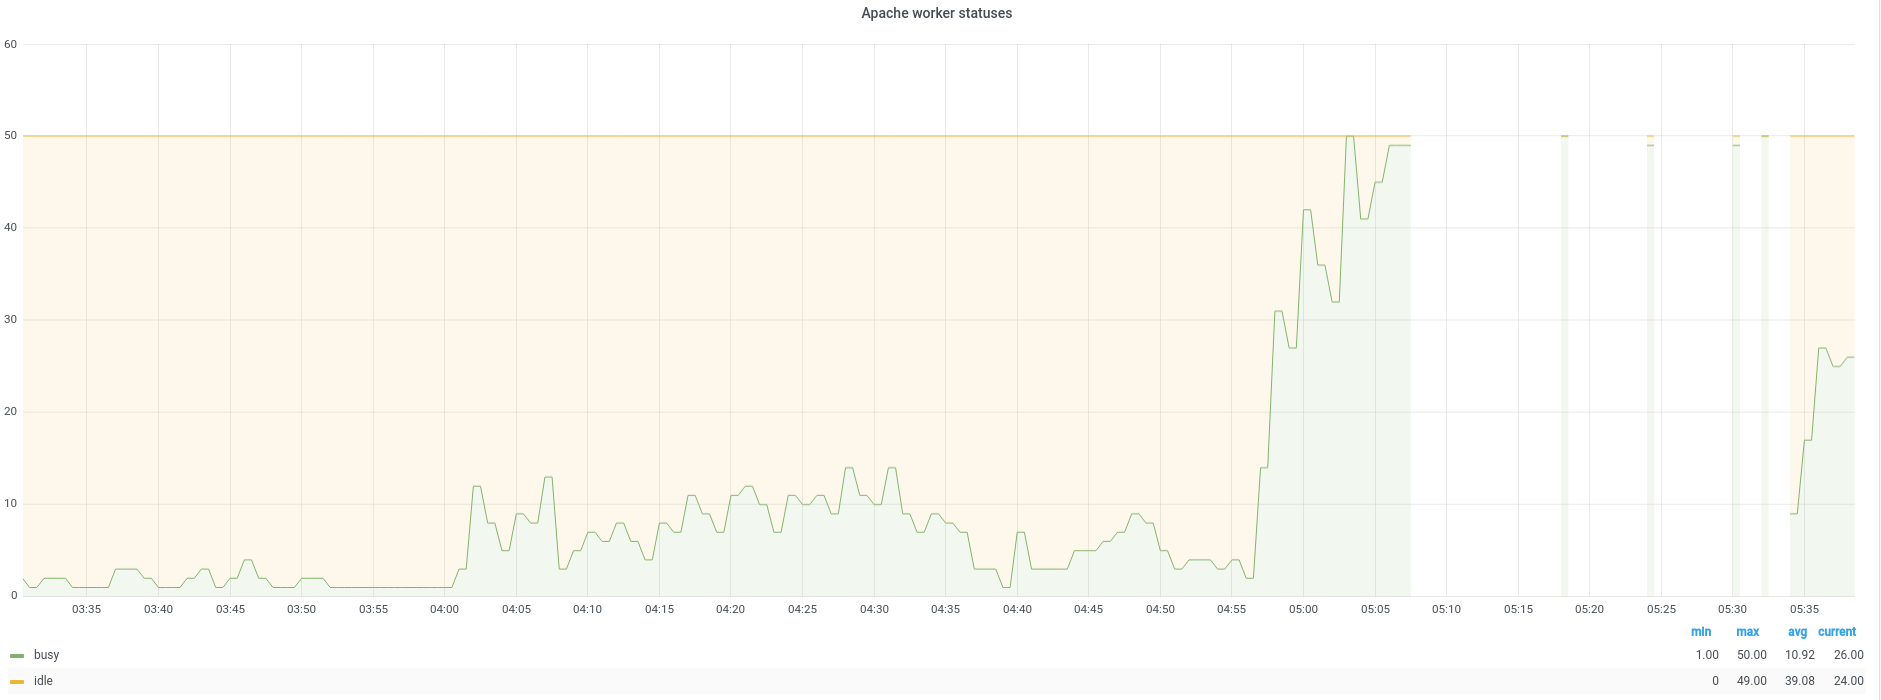
2021-03-11 05:03 UTC the apache process that is in front of gerrit ran out of workers:

Screenshot-2021-03-10-22:50:33.png (700×1 px, 65 KB)

(https://grafana.wikimedia.org/d/L0-l1o0Mz/apache?orgId=1&refresh=1m&var-host=gerrit1001&var-port=9117)

Preliminary look at the access logs doesn't show anything particularly surprising: crawlers, lots of upload packs, gitiles requests. There are a few aggressive crawlers: in particular a local one looking at the changes api. This is the 2nd time I can recall having to restart apache to restore, so it could use a bit of investigation.

How to check

Event Timeline

I can't tell what went wrong. I have notice there is some bot from WMCS which hammers gitiles as fast as it can. The requests are using format=TEXT which emits some base64 payload. They are all extremely fast (about 6ms) and I am guessing Apache is not fast enough in recycling them. It is looking at extension.json / skin.json and other similar files.

There are A LOT of queries originating from Phabricator kicking in at 5:00 UTC (ex: http://gerrit.wikimedia.org/r/changes/?q=bug:T250290&o=LABELS).

Maybe Apache has an issue and is not able to recycle the busy workers fast enough. Sounds like there is some tuning that needs to happen on Apache side, unfortunately I don't know anything on that front :(

Restarting apache2 service on gerrit1001 resolved the immediate problem, however, it's likely to recur if we don't address the root cause.

I might be able to do something to reduce the load generated by phabricator. We could also look at increasing the apache worker limit. Other than that I am short on ideas.

Of note: the gerrit server doesn't appear to be overloaded.

  • Load average is sitting at 0.20, 99.5% idle cpu.
  • Memory pressure doesn't look bad either. 20 gigs available.
  • Disk io is fine. 0% iowait and < 1Megabyte per second read/written (~50 disk iops)

Mentioned in SAL (#wikimedia-operations) [2021-03-13T17:38:33Z] <twentyafterfour> restarted apache on gerrit1001 to resolve apache worker exhaustion see T277127

Thanks for the restart @mmodell! The Apache view in Grafana:

gerrit_apache_out_of_worker.png (392×959 px, 46 KB)

A possible cause or contributing factor for the extra high load on gerrit could be this:

Periodically (maybe a couple of times per year?) Phabricator gets hit by a spider that doesn't have the courtesy to throttle their requests. In the past this has caused problems with phabricator's apache workers and/or mysql connections getting exhausted, which brings down phabricator. I think we have increased capacity and tuned the service to the point that this hasn't caused a phabricator outage in recent memory. I'm sure we still get hit by misbehaving spiders, and that might be what's happening - since each request to a phabricator task page makes a request to gerrit's search api (to find related gerrit patches.) The gerrit api results are cached on the phabricator side but only for a short time. The cache won't be much help when a spider is iterating over every phabricator task because most of the requests are for historical tasks that haven't been accessed recently and therefore result in a cache miss.

I can't tell what went wrong. I have notice there is some bot from WMCS which hammers gitiles as fast as it can. The requests are using format=TEXT which emits some base64 payload. They are all extremely fast (about 6ms) and I am guessing Apache is not fast enough in recycling them. It is looking at extension.json / skin.json and other similar files.

I poked through Gerrit's access logs, and these are my extreg-wos and phpcs Toolforge tools. I'll add in some sleeps in between requests, sorry. Also all my tools are configured to set a custom UA with the tool name / email address in them, but it's not working...I'll make sure to fix that too :(

As far as increased load on Gerrit goes, I'd also note that LibUp is pushing patches right now which usually adds some amount of load. LibUp uses the CI queue as rate-limiting, but we can add in more throttles as requested.

I poked through Gerrit's access logs, and these are my extreg-wos and phpcs Toolforge tools. I'll add in some sleeps in between requests, sorry. Also all my tools are configured to set a custom UA with the tool name / email address in them, but it's not working...I'll make sure to fix that too :(

These two should be fixed now, I added a 1-second sleep between requests - I can increase as necessary.

thcipriani assigned this task to Legoktm.

Tentatively resolving in the hopes that the sleep will make a difference here. If this problem persists let's reopen/open a new task.

Re-opening, same thing happening again.

As Majavah said, it just happened again. I've restarted apache on gerrit1001, which again made the issue go away for now.

https://wikitech.wikimedia.org/w/index.php?title=Server_Admin_Log&diff=1904488&oldid=1904480

Mentioned in SAL (#wikimedia-operations) [2021-03-21T08:50:22Z] <qchris> Restarting apache on gerrit1001 again (all apache workers busy again) see T277127

Mentioned in SAL (#wikimedia-operations) [2021-03-21T09:22:12Z] <elukey> install apache2-bin-dbgsym on gerrit1001 - T277127

Suggestion for the next time that httpd maxes out its workers: we could use gdb with thread apply all bt (after attaching it to one of the httpd worker processes) to see the status of the threads and why they are hanging. I have installed the dbg symbols for most of the modules that should help in getting a readable stacktrace.

I've just taken such a backtrace dump and pushed it as P14957

I've just taken such a backtrace dump and pushed it as P14957

Really nice thanks! Before the next restart I'd also get the html of http://localhost/server-status on gerrit1001 (will contain ip addresses/PII) so we'll be able to see if some slow clients are piling up for some reason.

http://localhost/server-status that is more or less captured by our monitoring and reflects on the Apache scoreboard statuses graph https://grafana.wikimedia.org/d/L0-l1o0Mz/apache?orgId=1&var-host=gerrit1001

Namely workers in read state are pilling up until the pool is exhausted. Last time that was caused by bots hammering the service on some slow to respond URLs and not throttling the requests.

gerrit_apache_scoreboard.png (536×1 px, 89 KB)

@hashar I am aware of the metrics, I meant to check what IPs were effectively causing busy workers.. :)

From the Apache error log:

[Sun Mar 21 08:18:44.309689 2021] [core:warn] [pid 13658:tid 139889120388224] AH00045: child process 31694 still did not exit, sending a SIGTERM
[Sun Mar 21 08:18:44.309811 2021] [core:warn] [pid 13658:tid 139889120388224] AH00045: child process 31635 still did not exit, sending a SIGTERM
[Sun Mar 21 08:18:46.312024 2021] [core:warn] [pid 13658:tid 139889120388224] AH00045: child process 31694 still did not exit, sending a SIGTERM
[Sun Mar 21 08:18:46.312096 2021] [core:warn] [pid 13658:tid 139889120388224] AH00045: child process 31635 still did not exit, sending a SIGTERM
[Sun Mar 21 08:18:48.314305 2021] [core:warn] [pid 13658:tid 139889120388224] AH00045: child process 31694 still did not exit, sending a SIGTERM
[Sun Mar 21 08:18:48.314375 2021] [core:warn] [pid 13658:tid 139889120388224] AH00045: child process 31635 still did not exit, sending a SIGTERM
[Sun Mar 21 08:18:50.316585 2021] [core:error] [pid 13658:tid 139889120388224] AH00046: child process 31694 still did not exit, sending a SIGKILL
[Sun Mar 21 08:18:50.316754 2021] [core:error] [pid 13658:tid 139889120388224] AH00046: child process 31635 still did not exit, sending a SIGKILL
[Sun Mar 21 08:18:51.318188 2021] [mpm_event:notice] [pid 13658:tid 139889120388224] AH00491: caught SIGTERM, shutting down
[Sun Mar 21 08:18:51.419751 2021] [mpm_event:notice] [pid 6920:tid 139836036920448] AH00489: Apache/2.4.38 (Debian) OpenSSL/1.1.1d configured -- resuming normal operations
[Sun Mar 21 08:18:51.420009 2021] [core:notice] [pid 6920:tid 139836036920448] AH00094: Command line: '/usr/sbin/apache2'
[Sun Mar 21 08:31:01.210871 2021] [mpm_event:error] [pid 6920:tid 139836036920448] AH10159: server is within MinSpareThreads of MaxRequestWorkers, consider raising the MaxRequestWorkers setting
[Sun Mar 21 08:31:02.212071 2021] [mpm_event:error] [pid 6920:tid 139836036920448] AH00484: server reached MaxRequestWorkers setting, consider raising the MaxRequestWorkers setting
[Sun Mar 21 08:50:30.993745 2021] [core:warn] [pid 6920:tid 139836036920448] AH00045: child process 6924 still did not exit, sending a SIGTERM
[Sun Mar 21 08:50:30.993833 2021] [core:warn] [pid 6920:tid 139836036920448] AH00045: child process 6925 still did not exit, sending a SIGTERM
[Sun Mar 21 08:50:32.996043 2021] [core:warn] [pid 6920:tid 139836036920448] AH00045: child process 6924 still did not exit, sending a SIGTERM
[Sun Mar 21 08:50:32.996110 2021] [core:warn] [pid 6920:tid 139836036920448] AH00045: child process 6925 still did not exit, sending a SIGTERM
[Sun Mar 21 08:50:34.998367 2021] [core:warn] [pid 6920:tid 139836036920448] AH00045: child process 6924 still did not exit, sending a SIGTERM
[Sun Mar 21 08:50:34.998435 2021] [core:warn] [pid 6920:tid 139836036920448] AH00045: child process 6925 still did not exit, sending a SIGTERM
[Sun Mar 21 08:50:37.000634 2021] [core:error] [pid 6920:tid 139836036920448] AH00046: child process 6924 still did not exit, sending a SIGKILL
[Sun Mar 21 08:50:37.000810 2021] [core:error] [pid 6920:tid 139836036920448] AH00046: child process 6925 still did not exit, sending a SIGKILL
[Sun Mar 21 08:50:38.002269 2021] [mpm_event:notice] [pid 6920:tid 139836036920448] AH00491: caught SIGTERM, shutting down
[Sun Mar 21 08:50:38.112298 2021] [mpm_event:notice] [pid 11390:tid 140288920065152] AH00489: Apache/2.4.38 (Debian) OpenSSL/1.1.1d configured -- resuming normal operations
[Sun Mar 21 08:50:38.112556 2021] [core:notice] [pid 11390:tid 140288920065152] AH00094: Command line: '/usr/sbin/apache2'
[Sun Mar 21 08:52:15.216205 2021] [mpm_event:error] [pid 11390:tid 140288920065152] AH10159: server is within MinSpareThreads of MaxRequestWorkers, consider raising the MaxRequestWorkers setting
[Sun Mar 21 09:12:32.531654 2021] [mpm_event:error] [pid 11390:tid 140288920065152] AH00484: server reached MaxRequestWorkers setting, consider raising the MaxRequestWorkers setting
[Sun Mar 21 10:35:54.209701 2021] [core:warn] [pid 11390:tid 140288920065152] AH00045: child process 11393 still did not exit, sending a SIGTERM
[Sun Mar 21 10:35:54.209805 2021] [core:warn] [pid 11390:tid 140288920065152] AH00045: child process 11394 still did not exit, sending a SIGTERM
[Sun Mar 21 10:35:56.211994 2021] [core:warn] [pid 11390:tid 140288920065152] AH00045: child process 11393 still did not exit, sending a SIGTERM
[Sun Mar 21 10:35:56.212072 2021] [core:warn] [pid 11390:tid 140288920065152] AH00045: child process 11394 still did not exit, sending a SIGTERM
[Sun Mar 21 10:35:58.214297 2021] [core:warn] [pid 11390:tid 140288920065152] AH00045: child process 11393 still did not exit, sending a SIGTERM
[Sun Mar 21 10:35:58.214388 2021] [core:warn] [pid 11390:tid 140288920065152] AH00045: child process 11394 still did not exit, sending a SIGTERM
[Sun Mar 21 10:36:00.216619 2021] [core:error] [pid 11390:tid 140288920065152] AH00046: child process 11393 still did not exit, sending a SIGKILL
[Sun Mar 21 10:36:00.216834 2021] [core:error] [pid 11390:tid 140288920065152] AH00046: child process 11394 still did not exit, sending a SIGKILL
[Sun Mar 21 10:36:01.218805 2021] [mpm_event:notice] [pid 11390:tid 140288920065152] AH00491: caught SIGTERM, shutting down
[Sun Mar 21 10:36:01.326930 2021] [mpm_event:notice] [pid 2299:tid 140103002788992] AH00489: Apache/2.4.38 (Debian) OpenSSL/1.1.1d configured -- resuming normal operations
[Sun Mar 21 10:36:01.327201 2021] [core:notice] [pid 2299:tid 140103002788992] AH00094: Command line: '/usr/sbin/apache2'
[Sun Mar 21 10:38:37.495270 2021] [mpm_event:error] [pid 2299:tid 140103002788992] AH10159: server is within MinSpareThreads of MaxRequestWorkers, consider raising the MaxRequestWorkers setting
[Sun Mar 21 10:47:33.072541 2021] [mpm_event:error] [pid 2299:tid 140103002788992] AH00484: server reached MaxRequestWorkers setting, consider raising the MaxRequestWorkers setting

The Apache access log for Gerrit are now properly formatted for ElasticSearch / Kibana since March 17th. I went to craft a dashboard that lets one explore the logs more or less easily: https://logstash.wikimedia.org/app/dashboards#/view/825c5c80-8aef-11eb-8ab2-63c7f3b019fc

For Gerrit one would use the filter: url.domain:gerrit.wikimedia.org

The hits I found so far:

  • 2200 hits from translatewiki.net updating git repos between 06:48 and 06:51
  • 730 hits from extreg-wos https://extreg-wos.toolforge.org between 7:00 and 7:18
  • 750 hits from library upgrader between 06:40 and ~ 07:20

Which does not sound like the end of the world beside that pills up with other regular traffic sources such as Phabricator, the Puppet masters or CI.


I have crawled through all Gerrit metrics, it does not seem to have suffered as far as I can tell.

Gerrit did got restarted:

SAL 2021-03-21
10:25 	<_joe_> 	restarting gerrit on gerrit1001, using 45G of reserved memory

Not sure what this 45G figure comes from. The JVM has a 32GB heap, the server has ~ 10GB of system disk cache and overall has 64GB of RAM so hardly a problem. Can't blame a restart though.


All the above leads nowhere :\

We gotta look at Apache and Gerrit httpd settings and tweak the working pools.

For Apache we have:

modules/gerrit/templates/apache.erb
# Due to Jetty's connection limiting flooding logs with "Dispatched
# Failed" Error messages, we limit connections already here.
MaxClients 50

Which comes from https://gerrit.wikimedia.org/r/c/operations/puppet/+/50591 for T49284. Originally set to 25 and further raised to 50 https://gerrit.wikimedia.org/r/c/operations/puppet/+/123416

Gerrit Jetty has:

modules/gerrit/templates/gerrit.config.erb
[httpd]
    listenUrl = proxy-https://127.0.0.1:8080/r/
    maxQueued = 500
    minThreads = 10
    maxThreads = 60
    maxWait = 2 min

Metrics for the Gerrit Jetty pool are at https://grafana.wikimedia.org/d/fe848RoMz/http-jetty and I can't tell the pool was over busy.

So I guess we gotta tweak Apache configuration. It uses the defaults from Apache mpm event module:

/etc/apache2/mods-enabled/mpm_event.conf
# event MPM
# StartServers: initial number of server processes to start
# MinSpareThreads: minimum number of worker threads which are kept spare
# MaxSpareThreads: maximum number of worker threads which are kept spare
# ThreadsPerChild: constant number of worker threads in each server process
# MaxRequestWorkers: maximum number of worker threads
# MaxConnectionsPerChild: maximum number of requests a server process serves
<IfModule mpm_event_module>
	StartServers			 2
	MinSpareThreads		 25
	MaxSpareThreads		 75
	ThreadLimit			 64
	ThreadsPerChild		 25
	MaxRequestWorkers	  150
	MaxConnectionsPerChild   0
</IfModule>

And the MaxRequestWorkers 150 would match the error we had:

AH10159: server is within MinSpareThreads of MaxRequestWorkers, consider raising the MaxRequestWorkers setting
AH00484: server reached MaxRequestWorkers setting, consider raising the MaxRequestWorkers setting

I am not familiar with Apache workers pool though. I will seek assistance.

Change 674070 had a related patch set uploaded (by Hashar; owner: Hashar):
[operations/puppet@production] gerrit: remove Apache MaxClients limit

https://gerrit.wikimedia.org/r/674070

Change 674070 merged by Dzahn:
[operations/puppet@production] gerrit: remove Apache MaxClients limit

https://gerrit.wikimedia.org/r/674070

Mentioned in SAL (#wikimedia-operations) [2021-03-22T19:47:30Z] <mutante> gerrit - restarting apache2 after we dropped MaxClients config line. This should make us fall back to Debian default MaxRequestWorkers. (since we use event MPM we should not be using MaxClients in the first place, says #httpd) (T277127)

One thing that in my opinion would be worth to follow up is how the timeouts are handled:

elukey@gerrit1001:~$ grep -rni Timeout /etc/apache2/
/etc/apache2/conf-available/00-defaults.conf:38:GracefulShutdownTimeout 5
/etc/apache2/sites-available/60-gerrit-wmfusercontent-org.conf:30:    TimeOut 720
/etc/apache2/sites-available/50-gerrit-wikimedia-org.conf:75:    TimeOut 720
/etc/apache2/sites-available/50-gerrit-replica-wikimedia-org.conf:75:    TimeOut 720
/etc/apache2/apache2.conf:90:# Timeout: The number of seconds before receives and sends time out.
/etc/apache2/apache2.conf:92:Timeout 300
/etc/apache2/apache2.conf:108:# KeepAliveTimeout: Number of seconds to wait for the next request from the
/etc/apache2/apache2.conf:111:KeepAliveTimeout 5
/etc/apache2/mods-available/reqtimeout.load:1:LoadModule reqtimeout_module /usr/lib/apache2/modules/mod_reqtimeout.so
/etc/apache2/mods-available/reqtimeout.conf:1:<IfModule reqtimeout_module>
/etc/apache2/mods-available/reqtimeout.conf:3:	# mod_reqtimeout limits the time waiting on the client to prevent an
/etc/apache2/mods-available/reqtimeout.conf:6:	# configuration, but it may be necessary to tune the timeout values to
/etc/apache2/mods-available/reqtimeout.conf:8:	# mod_reqtimeout per virtual host.
/etc/apache2/mods-available/reqtimeout.conf:14:	# Note: Lower timeouts may make sense on non-ssl virtual hosts but can
/etc/apache2/mods-available/reqtimeout.conf:15:	# cause problem with ssl enabled virtual hosts: This timeout includes
/etc/apache2/mods-available/reqtimeout.conf:19:	RequestReadTimeout header=20-40,minrate=500
/etc/apache2/mods-available/reqtimeout.conf:23:	RequestReadTimeout body=10,minrate=500

Especially the mod_req_timeout ones.. Raising the MaxRequestWorkers is a good thing, but it moves the tolerance of very slow clients higher, with more traffic we might get into the same situation again (if slow clients take ages to send their request to gerrit).

@elukey thank you for raising the timeout madness. That has intrigued me yesterday during my investigation and I happily ignored the issue to focus solely on the pool sizing :] Indeed lets tackle the timeouts!

TimeOut 720

The TimeOut 720 (in seconds, so that is 12 minutes) has been introduced by https://gerrit.wikimedia.org/r/c/operations/puppet/+/24583 from 2012! The mentioned reason is:

The default of 5 minutes isn't necessarily long enough for a long clone operation (eg: mediawiki/core). If you're cloning with the --quiet option, gerrit doesn't return any output so Apache is stupid and thinks nothing is happening.

I don't see how the git --quiet would affect exchange of data between the client and the server. It must really just be a user facing option.

The documentation for Timeout states:

When reading data from the client, the length of time to wait for a TCP packet to arrive if the read buffer is empty.
When writing data to the client, the length of time to wait for an acknowledgement of a packet if the send buffer is full.

Gerrit httpd has a 30 seconds TCP idle timeout anyway https://gerrit.wikimedia.org/r/Documentation/config-gerrit.html#httpd.idleTimeout , though I would guess Apache consumes all the data from Gerrit rather quickly, pills them up in a buffer and then send it to the client.

If a client has not send any packet or missed TCP acknowledging the reception of a packet after 12 minutes, there is surely a big trouble somewhere. I am willing to remove TimeOut 720 entirely.

KeepAliveTimeout 5

Apache waits up to 5 seconds for another request from the same client. I don't really know what to do with this setting. A browsers on the web interface will surely use keep alive and I am assuming the git clients would do as well. I cant tell for a bot, but I imagine a http library would use the keepalive as well after a connection is established. So I am guessing we want to keep it.

RequestReadTimeout

RequestReadTimeout header=20-40,minrate=500
RequestReadTimeout body=10,minrate=500

That is up to 20 seconds to receive the header to a max of 40 seconds.

10 seconds for the payload, raised by 1 seconds every 500 bytes.

The default sounds insanely high indeed. I am not sure whether we need to tune them though.

GracefulShutdownTimeout 5

Comes from mpm http://httpd.apache.org/docs/current/mod/mpm_common.html#gracefulshutdowntimeout , how long a server keeps running on a graceful stop before arbitrarily terminating the connections. Hardly an issue?

The Timeout 720 looks really high indeed, I'd try to lower it down as starter. The RequestReadTimeout are also important, a 20s timeout for request headers for example seems a loooong time :D

This looks really low to me:

MaxClients 50

Shouldn't that be more like 150?

thcipriani triaged this task as Medium priority.

We're now at 150 workers -- which seems to be working well. Assigning to @hashar to finish up timeout work.

thcipriani reassigned this task from hashar to Dzahn.

Optimistically closing

Change 682502 had a related patch set uploaded (by Hashar; author: Hashar):

[operations/puppet@production] gerrit: remove Apache 720s timeout

https://gerrit.wikimedia.org/r/682502

I have looked at the Apache scoreboard and Gerrit thread pool and they seem fine now. Gerrit is at less than 40 threads out of a total pool of 60. Apache does have some spikes, but they are below the 150 workers limit. So that part is solved indeed.

Reopening since we still had to drop a timeout, which is done by https://gerrit.wikimedia.org/r/c/operations/puppet/+/682502 gerrit: remove Apache 720s timeout

Change 682502 merged by Dzahn:

[operations/puppet@production] gerrit: remove Apache 720s timeout

https://gerrit.wikimedia.org/r/682502

hard restarted apache after deploy

Perfect, thank you @Dzahn and @elukey ;)