Page MenuHomePhabricator

Investigate cache needs based on existing logs/metrics
Closed, ResolvedPublic

Description

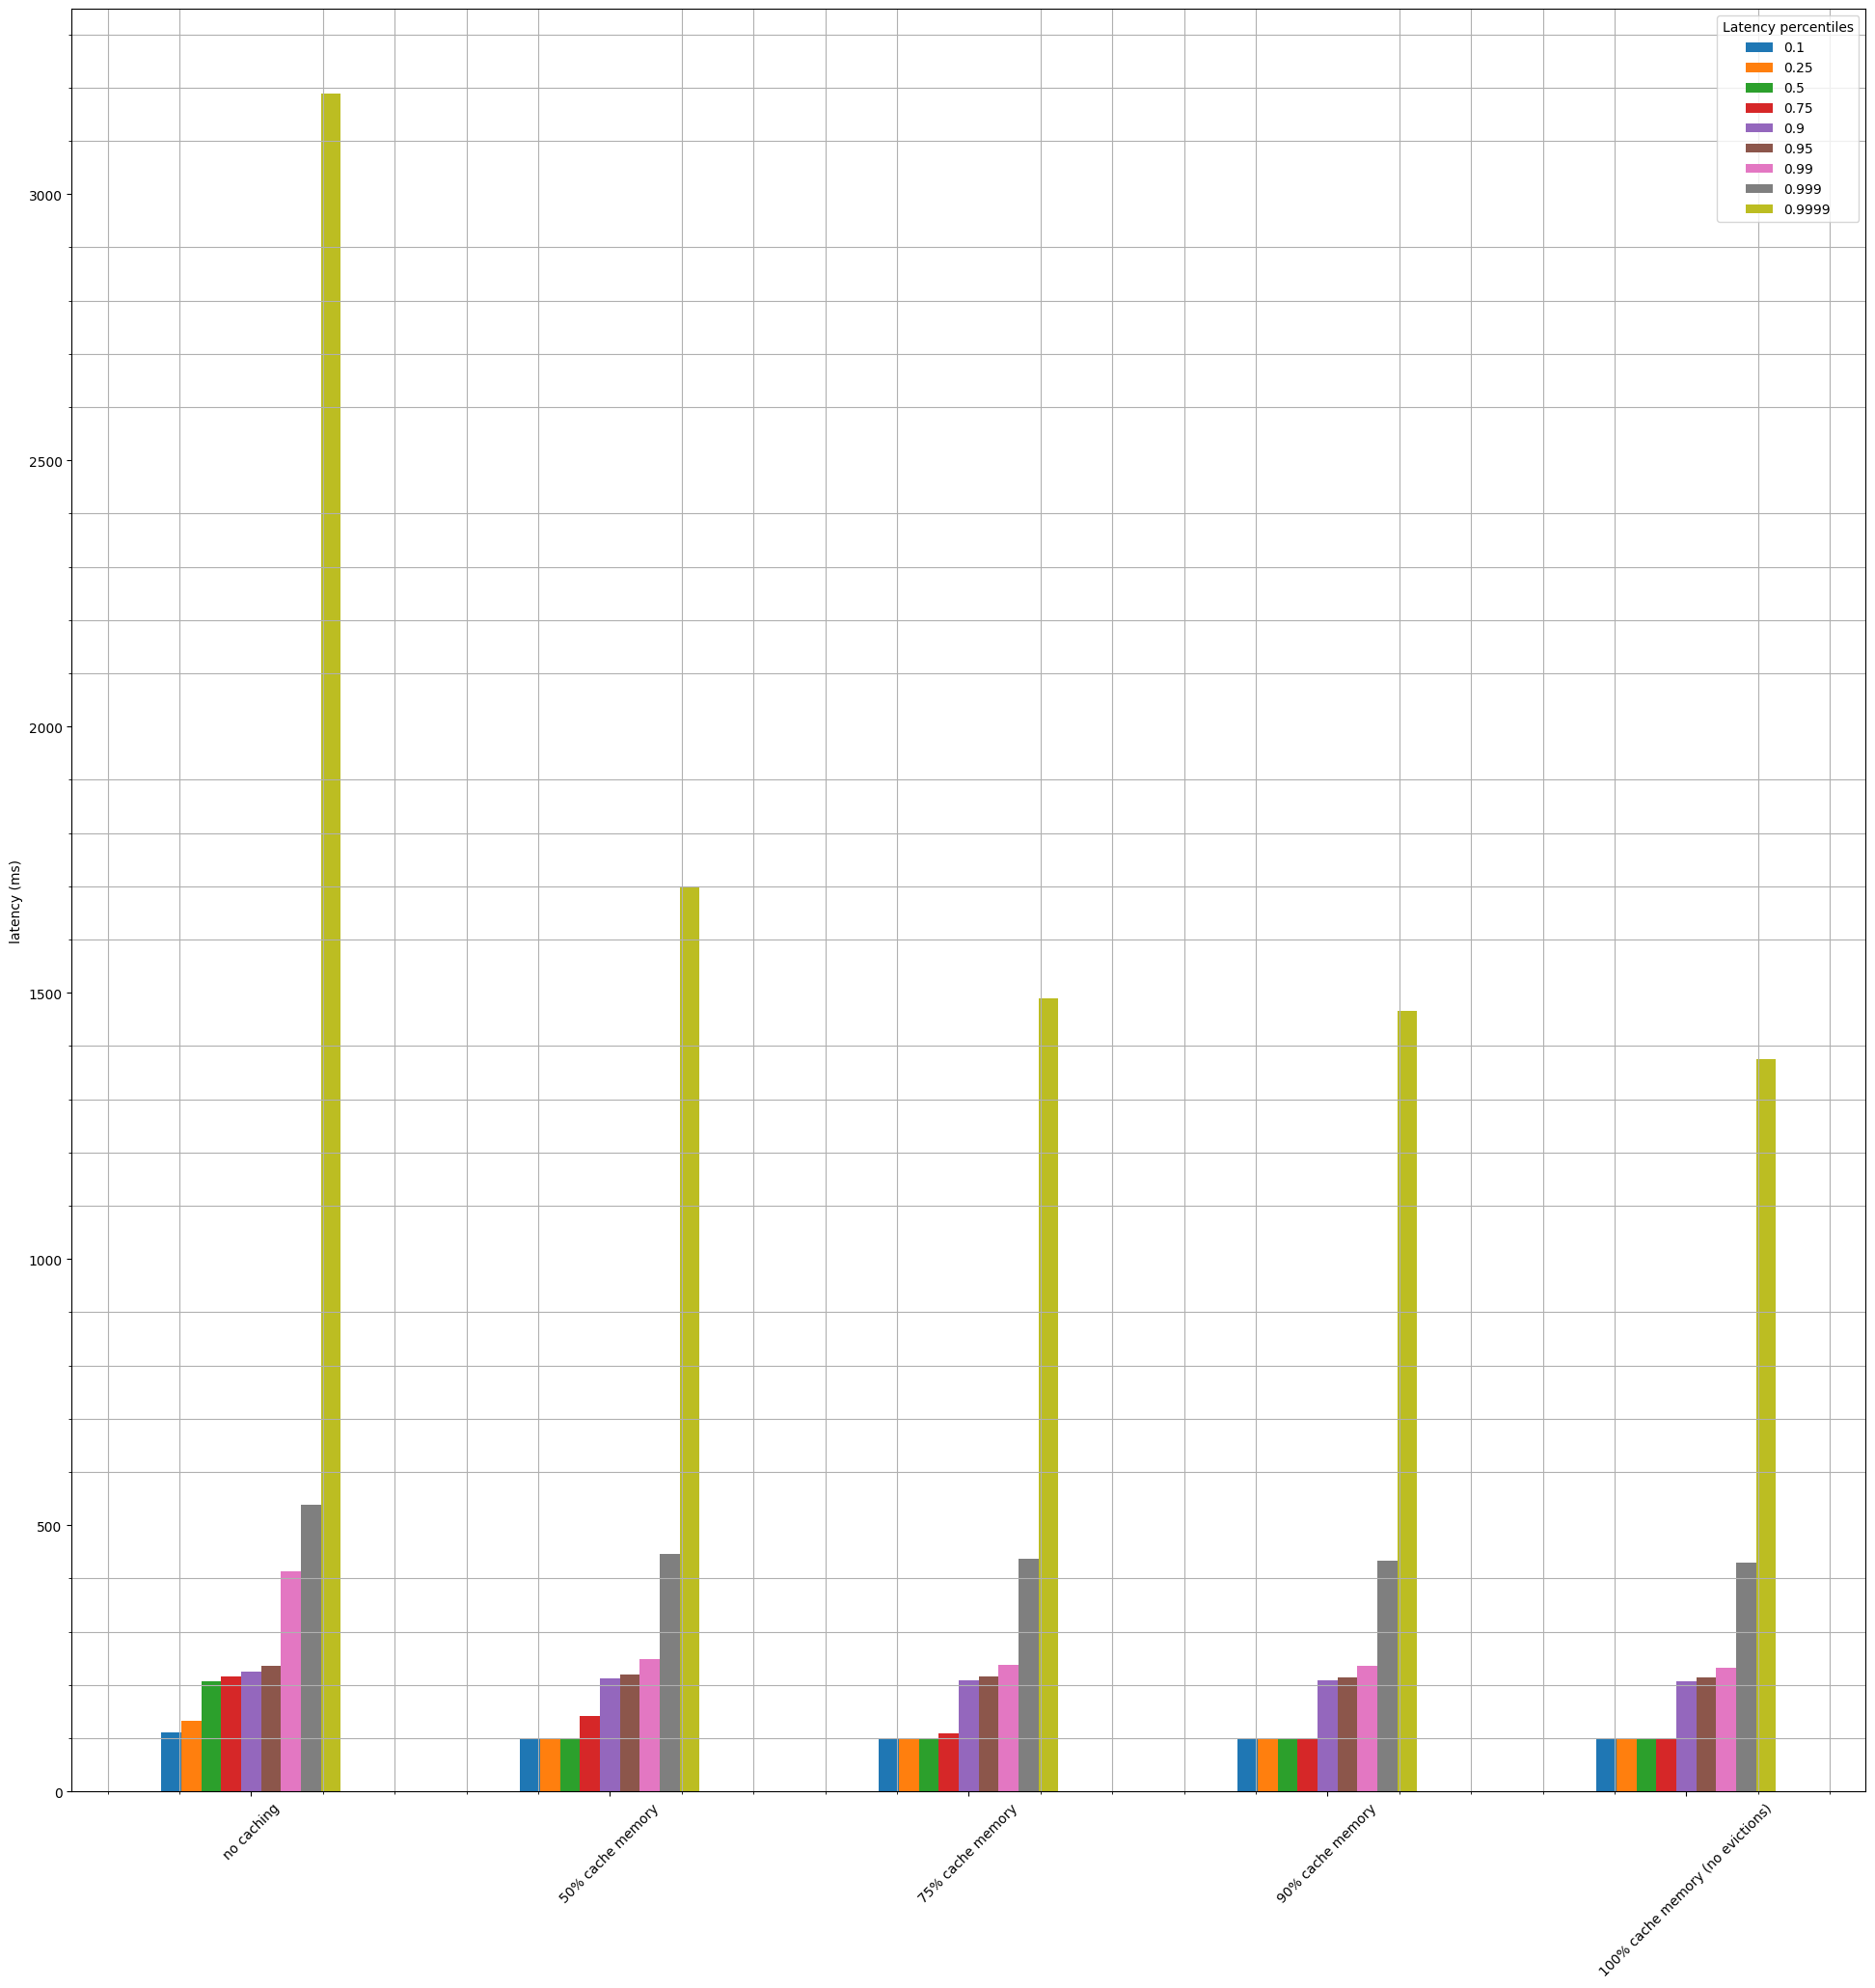
One useful analysis to undersand if and how much moving from the pregeneration model to caching is to figure out:

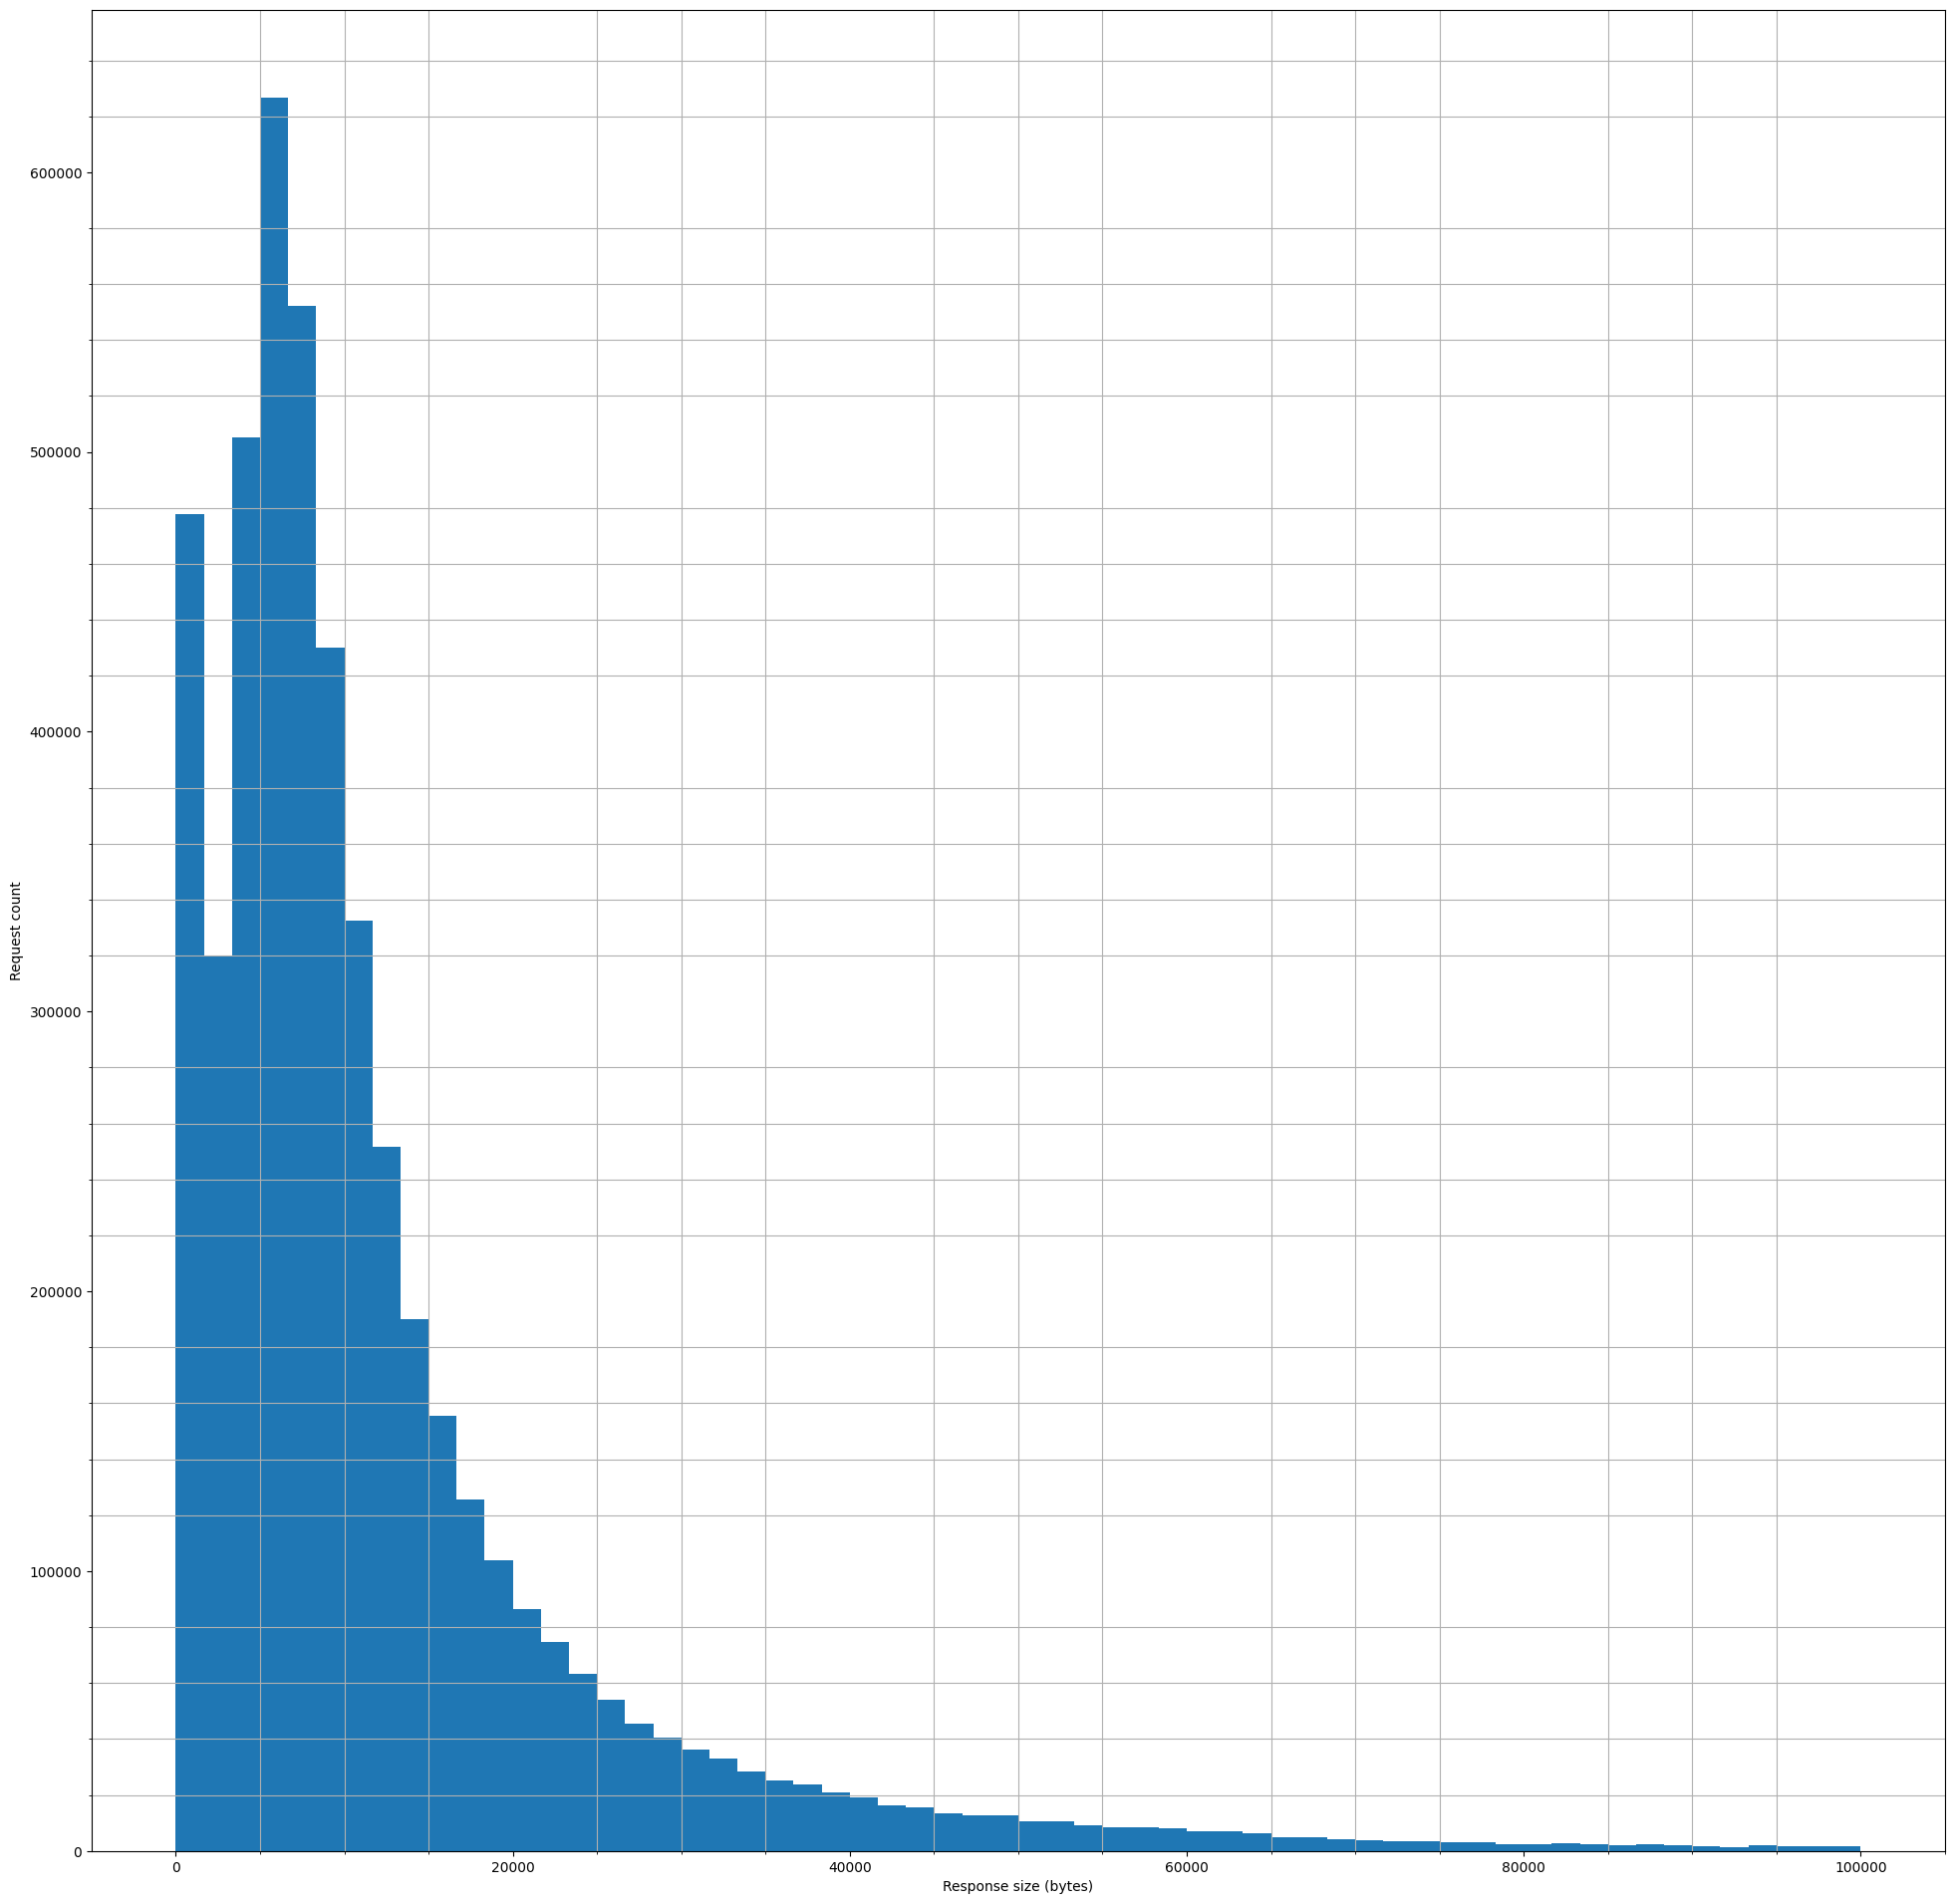
  • What are the patterns of requests we see in our logs
  • How does the cache size affects latency

Webrequest analytics is a good starting point for this investigation

Event Timeline

MSantos triaged this task as High priority.Aug 3 2023, 2:14 PM
MSantos removed a project: Content-Transform-Team.

PCS caching efficiency

Intro

The rationale behind this investigation is to figure out what's the expected performance in an architecture where PCS stops doing global pregeneration of all wikipedias content but instead relies on caching to improve latency of PCS responses.

In previous quarter we tried to investigate whether disabling the storage aspect of PCS on RESTbase level to see how only edge caching will affect our performance. The increased latency wasn't acceptable by the apps teams so we decided to revert the experiment and try to find alternatives.

There is strong interest for moving away from the storage backed pregeneration architecture because of the overhead and complexity it brings. At the same time the pregeneration brings great performance.

The next idea in the investigation is to introduce caching.

Setup

The wikis on the data analysis are the following:

  • Small
    • ptwiki
  • Medium
    • dewiki
  • Large
    • enwiki

For each of those wikis I queried the webrequests fom datalake and resource change events for /page/html (parsoid output) and simulated the traffic and invalidations to a dummy cache. For each run I calculated the following metrics:

  • Cache hits: the amount of requests that existed fresh in cache
  • Cache misses: the amounts of requests that were not found in cache and hit the backend
  • Purge hits: the amount of cache invalidation events that actually invalidated cache content
  • Cache hit ratio: the ratio of cache hits / cache misses
  • Max cache size: the max size of keys existin in the cache for the whole investigated time

Results

ptwiki

Cache hits: 165324
Cache misses: 126403
Purge hits: 5192
Cache hit ratio: 56.67 %
Max size: 121211

dewiki

Cache hits: 3796059
Cache misses: 1064200
Purge hits: 43514
Cache hit ratio: 78.1 %
Max size: 1020687

enwiki

Cache hits: 22143972
Cache misses: 4557093
Purge hits: 401444
Cache hit ratio: 82%
Max size: 4156512

Next steps

  • We have access to response sizes so we can also simulate the cache values size
  • We have access to response latencies so we can check the introduced latency given a threshold that latency is accepted (no need for caching) and unaccepted (responses are cached)
  • For dewiki specifically (medium size wiki in our analysis):

Dataset preparation

The dataset consists of the webrequests for dewiki (week 06 Aug 2023) the resource change events for /page/html (week 06 Aug 2023) and a unified dataset used to simulate the traffic/cache. We filter the webrequests that are a cache miss on edge caching layers.

Service latency percentiles (ms)

This is the latency observed by varnish for all requests of the time window we observe. This includes the requests that end up being cached on edge (with zero latency).

All requests

p10, p25, p50, p75, p90, p99, p999, p9999

time_firstbyte
0.1000 	110.940000
0.2500 	132.605750
0.5000 	207.581000
0.7500 	215.667000
0.9000 	225.220100
0.9500 	236.315000
0.9900 	414.164010
0.9990 	537.875206
0.9999 	3188.420550

Caching performance

Note: In our simulation we don't restrict the amount of entries in the cache so we assume that we have enough storage to fit all responses (no evictions).

Cache hit ratio: 77.82134766670785 %
Purge hit ratio: 4.5494771046640015 %
Max number of cache keys: 1027137
Max size of cache values: 8.2 GB

Ballpark figures: previously we found that 35% of the traffic hit the 1st level varnish cache, and that the misses from the 1st level cache caused a slowdown of ~20%. If a cache with a lifetime of ~1 week and size of ~8.2GB results in a 2nd level hit rate of 78%, then we expect that 14% ((1-.35)*(1-.78)) of the traffic still misses. If that 14% causes a 20% slowdown (and all the cache hits cause 0% slowdown), waving hands a bit, then we'd expect something like 3% overall slowdown after deploying this cache. Could be some surprises in p10 vs p90 etc if it turns out that our misses turn out to cluster on the tail of the latency distribution, but there's no particular reason to think that would be the case.

Interesting factoid from the dewiki results is that no more than 4.5% of their edits are currently coming from mobile, since a mobile edit is more or less guaranteed to cause a purge cache hit.

Might be useful to try varying the cache size (or cache lifetime) to get a sense for what the slope is and where the sweet spot for cache size is. ParserCache has a 21 day cache lifetime, for comparison (also it is not an LRU cache).

This comment was removed by Jgiannelos.

If we reduce the cache size to almost half of the scenario where there are no evictions the metrics change to:

Cache hit ratio: 64.06571522715103 %
Purge hit ratio: 3.802601188535482 %
Max number of cache keys: 500000

With latency percentiles:

 	latency
0.1000 	100.000000
0.2500 	100.000000
0.5000 	100.000000
0.7500 	141.894000
0.9000 	212.675000
0.9500 	218.789000
0.9900 	248.548000
0.9990 	446.360402
0.9999 	1698.734022

For the ~75% of initial max size of keys:

Cache hit ratio: 72.37392396721447 %
Purge hit ratio: 4.320975815576993 %
Max number of cache keys: 750000

With latency percentiles:

	latency
0.1000 	100.000000
0.2500 	100.000000
0.5000 	100.000000
0.7500 	108.728000
0.9000 	209.330000
0.9500 	215.598050
0.9900 	238.452000
0.9990 	436.223000
0.9999 	1489.597699

For ~90%:

Cache hit ratio: 75.766547221879 %
Purge hit ratio: 4.486917798898774 %
Max number of cache keys: 900000

With percentiles:

 	latency
0.1000 	100.000000
0.2500 	100.000000
0.5000 	100.000000
0.7500 	100.000000
0.9000 	208.015000
0.9500 	214.351000
0.9900 	235.166000
0.9990 	432.839206
0.9999 	1465.630628
This comment was removed by Jgiannelos.

Here is a recap of how PCS latency is affected based on different caching scenarios:

Untitled.png (2×1 px, 72 KB)

Histogram of response sizes for our sample (dewiki, 1 week of data)

Untitled.png (1×1 px, 43 KB)