https://grafana.wikimedia.org/dashboard/db/save-timing?from=1496894179569&to=1497166735726
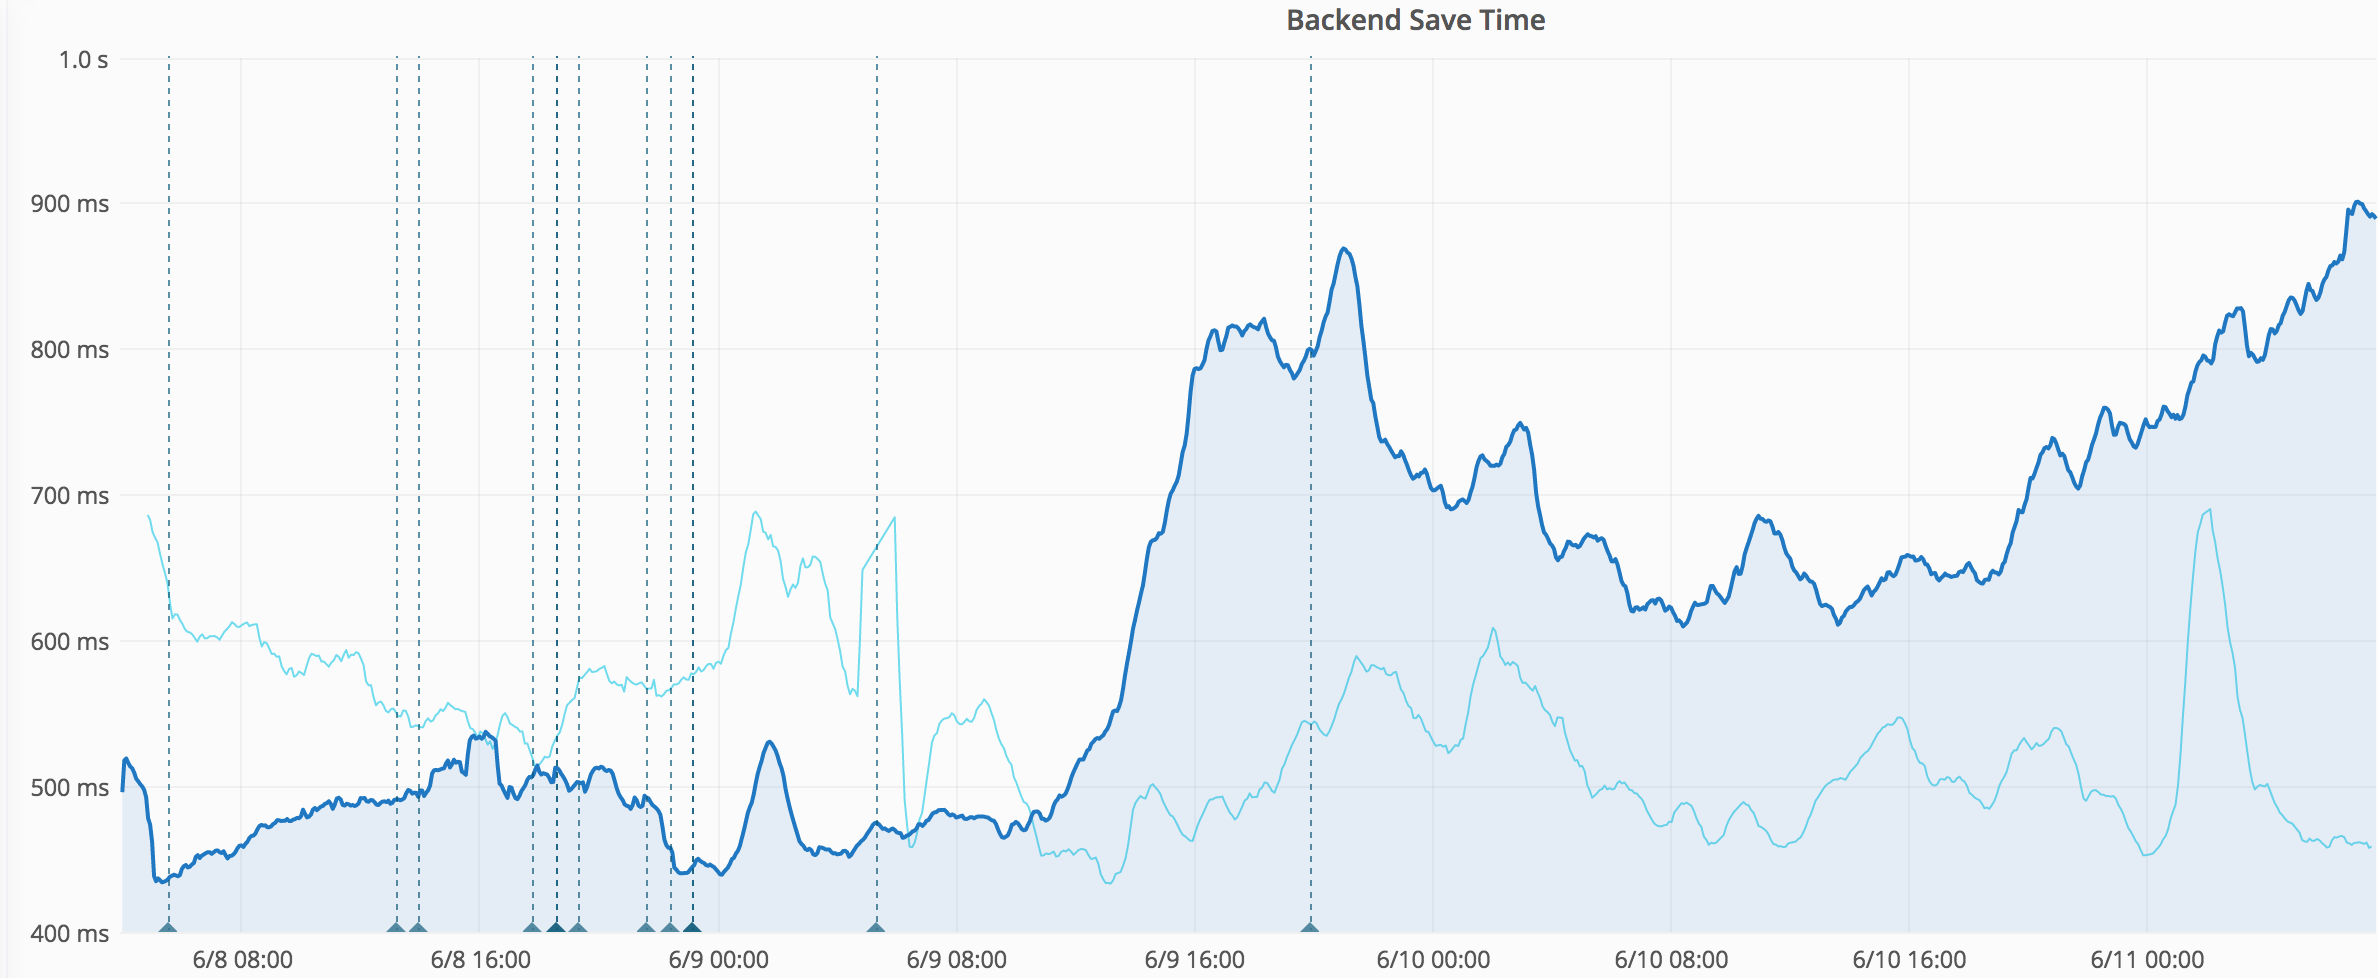
| metric | before | after |
|---|---|---|
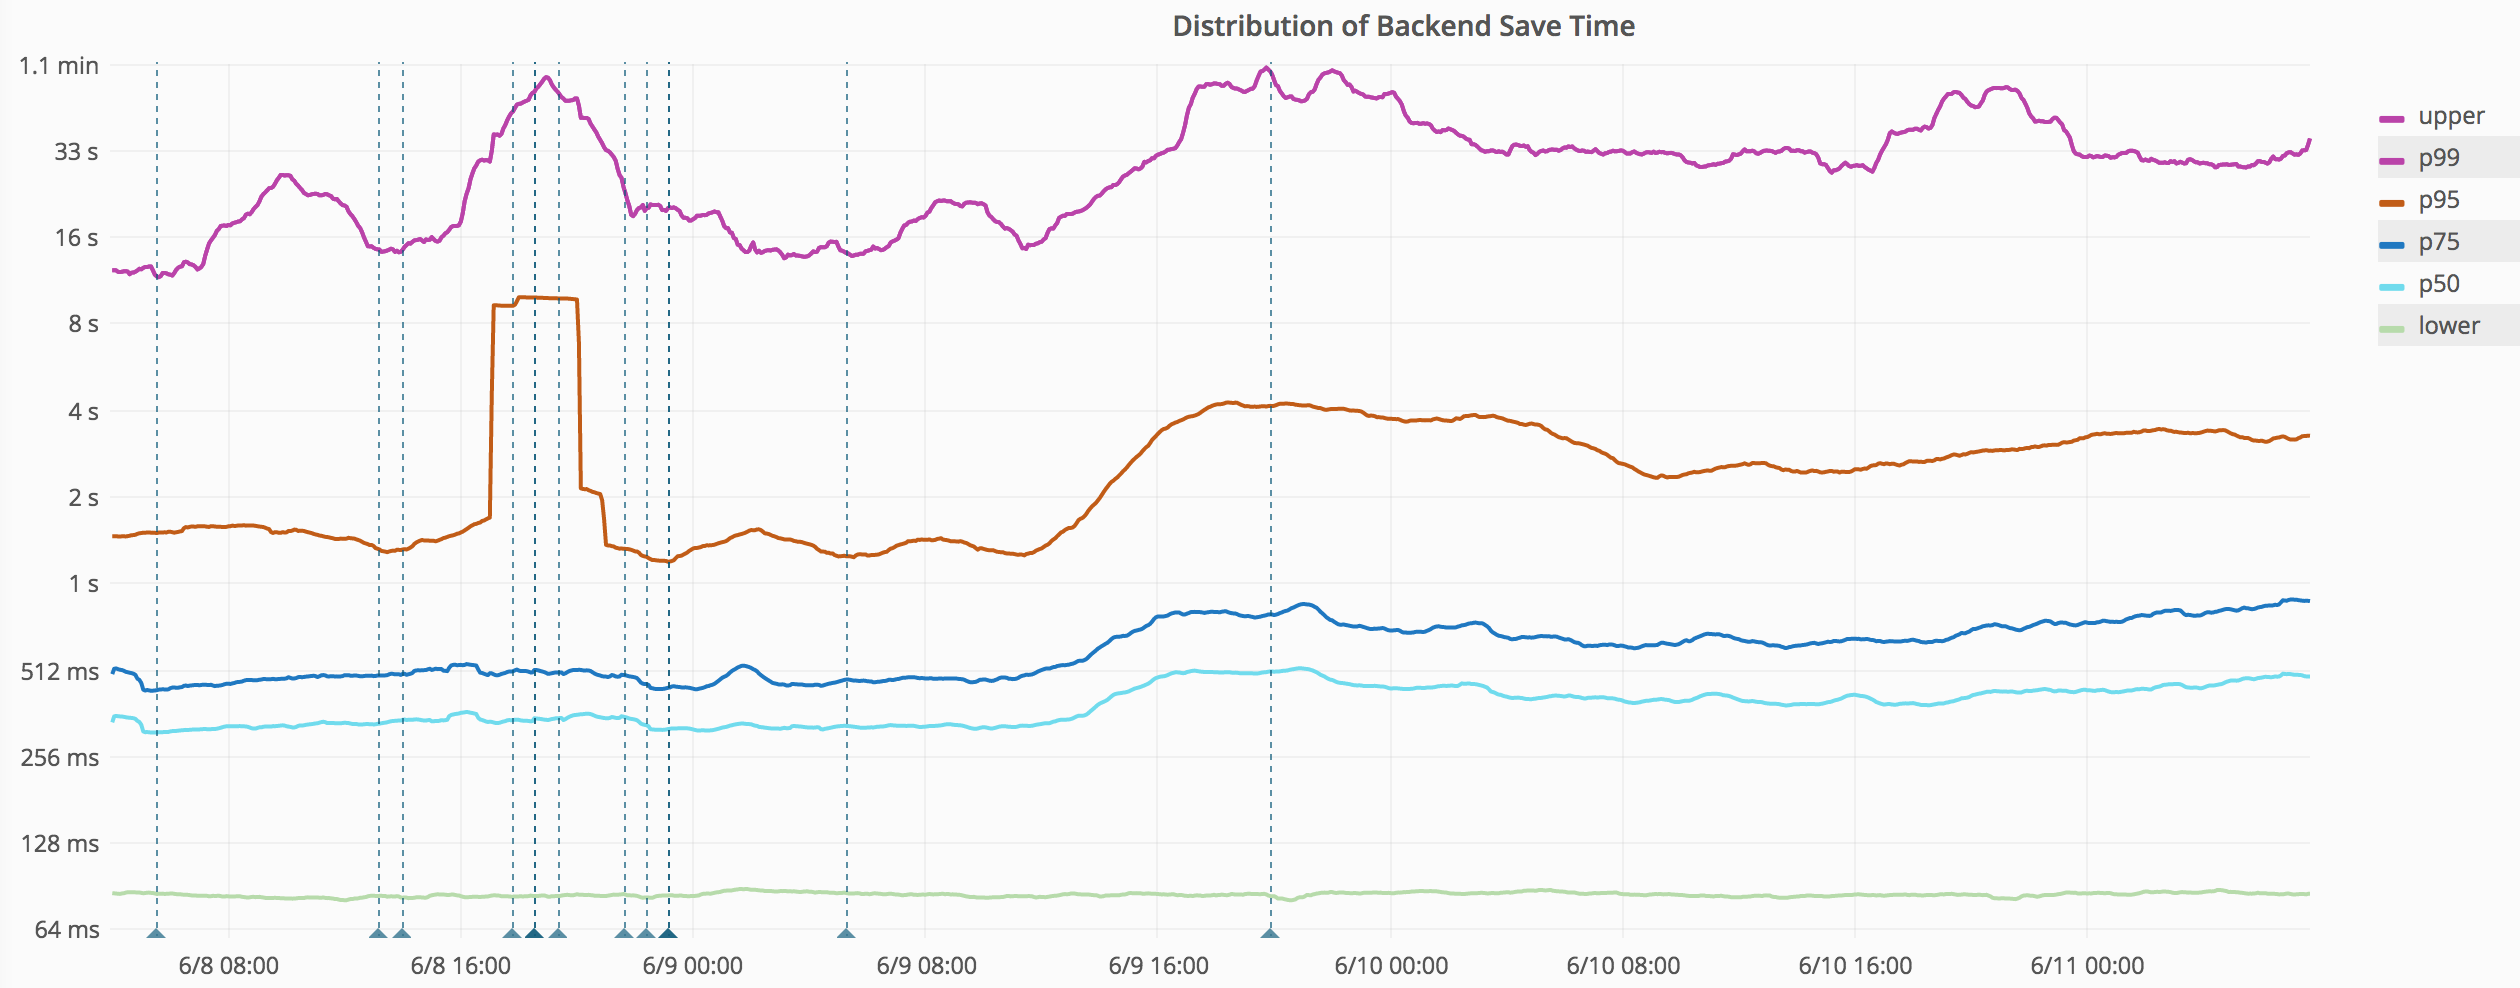
| lower | 80ms | 80ms |
| p50 | 320ms | 500ms |
| p75 | 470ms | 600ms |
| p95 | 1.3s | 3s |
| p99 | 15s | 30s |
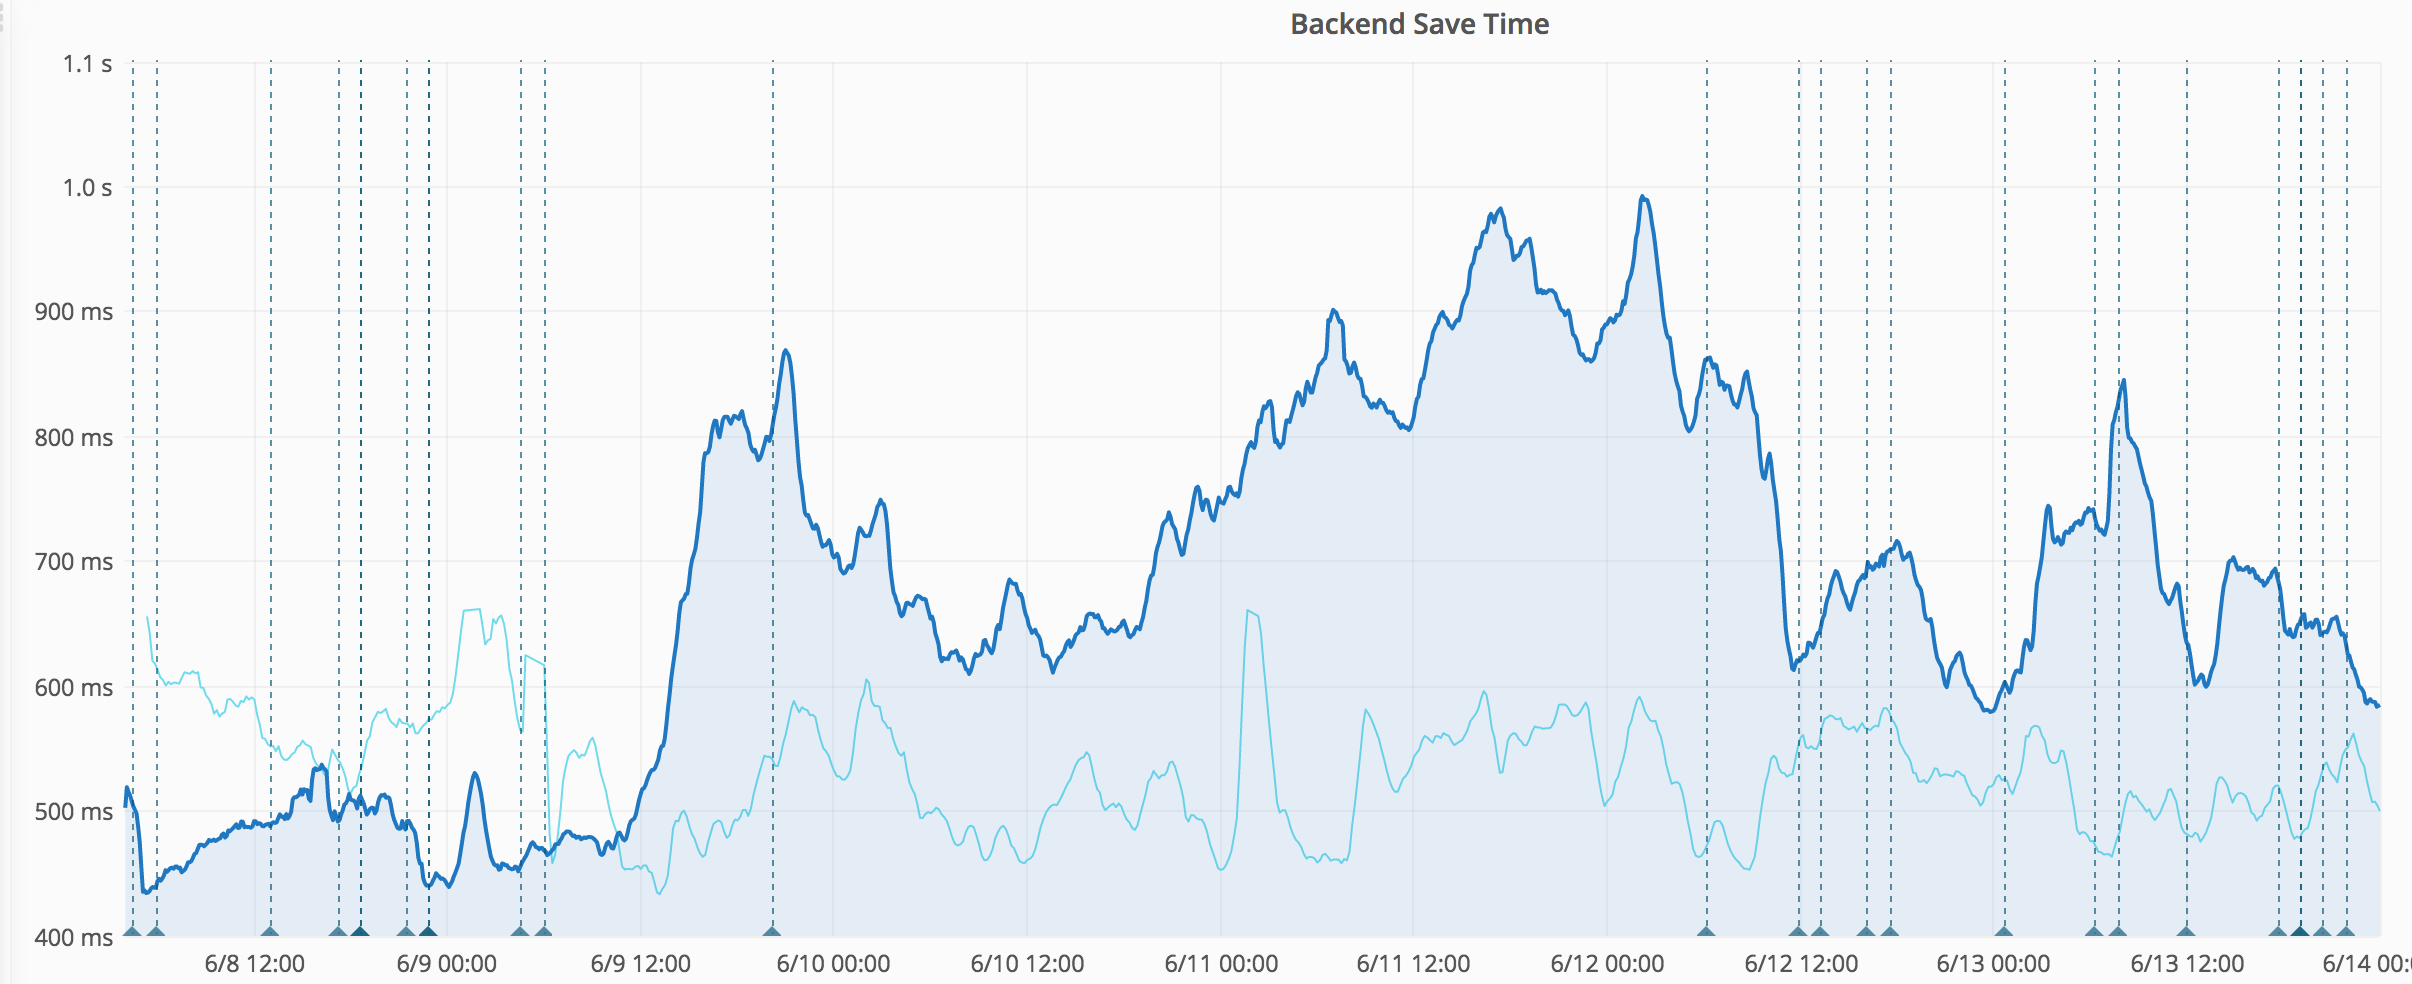
Started around June 8 23:00 or June 9 10:00 (UTC). Probably caused by wmf.4.