Page MenuHomePhabricator

Monitoring of MT services
Closed, ResolvedPublic

Description

Currently we rely on manual testing and user reports to notice if a MT service is not working. This is not optimal.

There are at least three types of failures:

  1. External service fails with a specific content.
  2. External service is down or too slow.
  3. External service fails because of a configuration error (e.g. expired key, over quota etc.)

With automated monitoring (with alerts) we cannot capture 1, but we can at least immediately see if it is 2 or 3 and investigate more.

Current status

  • Errors are logged with minimal details (HTTP status code, language pair) to LogStash. We can only get WMF hosted services (ie Apertium) stack trace properly.
  • No alerts or overview over time.

Possible options

CX internal

CX could internally ping the services with a fixed request and log response time / failure state.

How to get alerts? Where to log? Can we graph it?

CX ping-api

CX could introduce a new api "ping" that can be used to check service status without authorization. The API only returns up/down and maybe response time.

This should be easy to integrate with existing monitoring tools which can also provide alerts

Direct endpoint monitoring

We could also try to directly ping the APIs, but without keys, we would only know if service is unreachable.
Event Timeline

KartikMistry updated the task description. (Show Details)
KartikMistry added a subscriber: akosiaris.

Change 471221 had a related patch set uploaded (by Santhosh; owner: Santhosh):
[mediawiki/services/cxserver@master] Set up a metrics counter for v2 api translate response

https://gerrit.wikimedia.org/r/471221

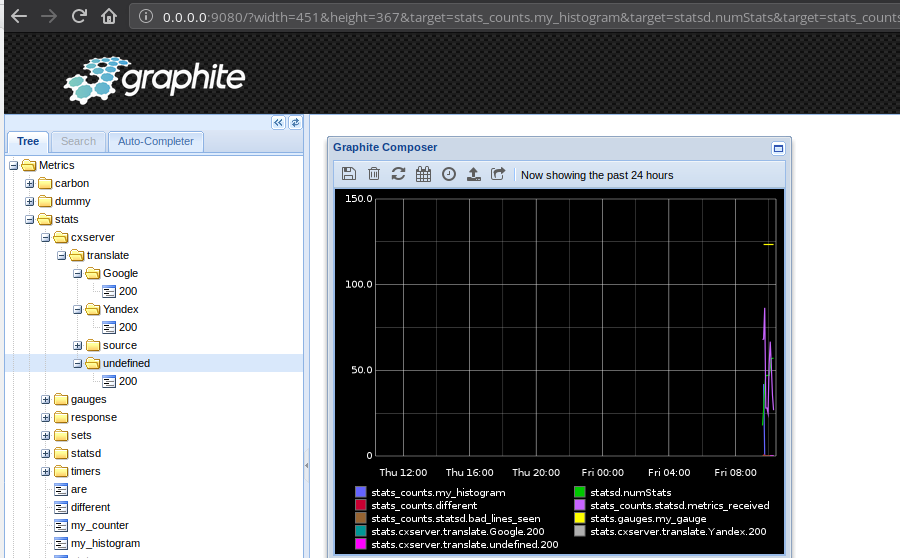
As illustrated in above patch, cxserver has metric reporting capacity already. We just need to emit appropriate counters to track errors or success. In production if cxserver is configured with statsd, we can monitor the services(actually anything in cxserver) using grafana.wikimedia.org or any graphite dashboard.

A screenshot from my local graphite(ignore test metrics):

image.png (558×900 px, 62 KB)

Change 471221 merged by jenkins-bot:
[mediawiki/services/cxserver@master] Set up a metrics counter for v2 api translate response

https://gerrit.wikimedia.org/r/471221

FWIW, metrics_host: in config-vars.yaml, which is used by scap to build config.yaml, specifically the

metrics:
  name: cxserver
  host: statsd.eqiad.wmnet
  port: 8125
  type: statsd

is ready since a very long time ago. All required is to instrument the code with the interesting parts and create dashboards.

Stashbot subscribed.

Mentioned in SAL (#wikimedia-operations) [2018-11-06T04:42:16Z] <kartik@deploy1001> Started deploy [cxserver/deploy@ddb0031]: Update cxserver to 17f9a10 (T144467, T198699, T208386)

Mentioned in SAL (#wikimedia-operations) [2018-11-06T04:47:42Z] <kartik@deploy1001> Finished deploy [cxserver/deploy@ddb0031]: Update cxserver to 17f9a10 (T144467, T198699, T208386) (duration: 05m 26s)

Arrbee assigned this task to santhosh.

Primary dashboard for cxserver is ready. Thanks to @Nikerabbit! https://grafana.wikimedia.org/dashboard/db/cxserver

That link is broken, to align it with the naming of other services the final url for this is : https://grafana.wikimedia.org/dashboard/db/service-cxserver

(Another dashboard was also created for more general monitoring of access and content created with Content Translation)