Page MenuHomePhabricator

Wikidata server slow
Closed, InvalidPublic

Description

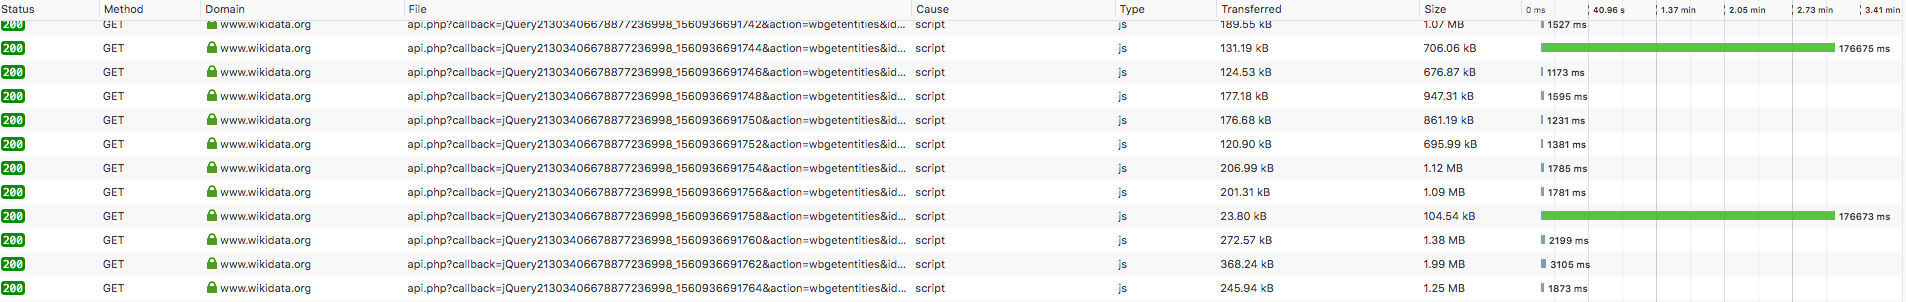
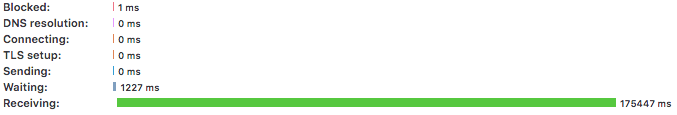
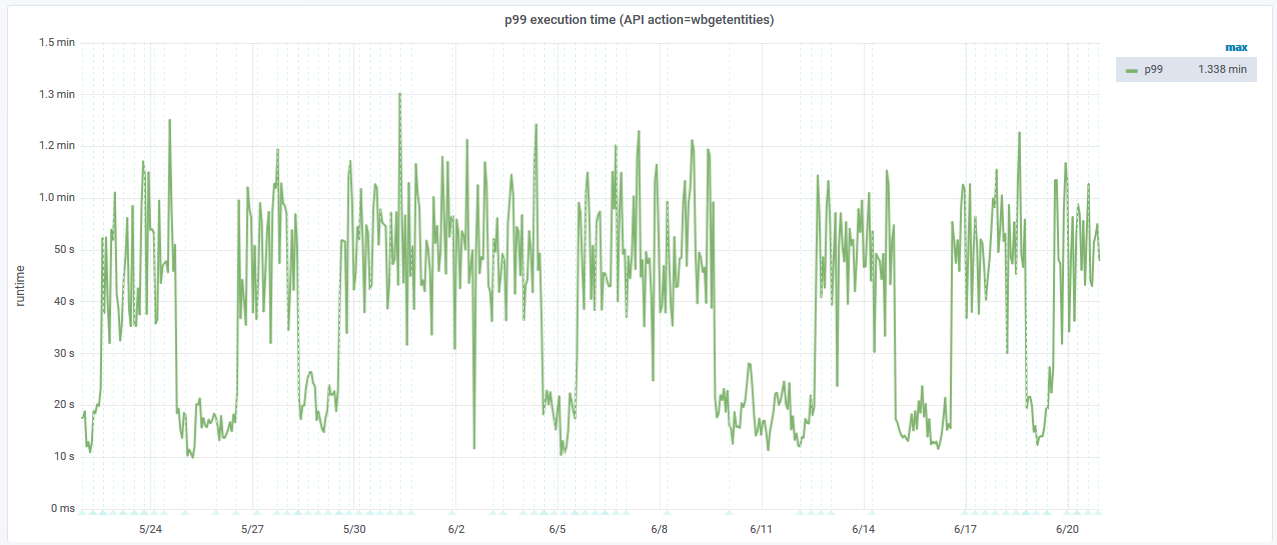
Many of my tools use the wbgetentities action to get data from Wikidata. This usually works well, but since yesterday I found that some of these queries take a lot of time, with some frameworks timing out. I am talking 1-2sec vs. 3.5min here. There is no fundamental difference between these queries, just different entity IDs. Results do not appear to be different either, same size, valid JSON etc.

I would imagine this is one single server begin slow. Can't see which server produced them though.

I will attach a screenshot, once I figure out how to do that in Phabricator.

Can currently be reproduced by visiting https://tools.wmflabs.org/reasonator/?q=Q350 but I don't know how reproducible this behaviour is.

Event Timeline

Magnus triaged this task as High priority.Jun 19 2019, 9:50 AM

Response header from one of the slow requests:

HTTP/2.0 200 OK
date: Wed, 19 Jun 2019 09:31:43 GMT
content-type: text/javascript; charset=utf-8
server: mw1341.eqiad.wmnet
x-powered-by: HHVM/3.18.6-dev
mediawiki-login-suppressed: true
cache-control: private, must-revalidate, max-age=0
content-disposition: inline; filename=api-result.js
x-content-type-options: nosniff
x-frame-options: DENY
backend-timing: D=1129973 t=1560936702635082
vary: Accept-Encoding,Treat-as-Untrusted,X-Forwarded-Proto,Cookie,Authorization,X-Seven
content-encoding: gzip
x-varnish: 774984440, 505592114, 724292664
via: 1.1 varnish (Varnish/5.1), 1.1 varnish (Varnish/5.1), 1.1 varnish (Varnish/5.1)
accept-ranges: bytes
age: 0
x-cache: cp1081 pass, cp3032 pass, cp3041 pass
x-cache-status: pass
server-timing: cache;desc="pass"
strict-transport-security: max-age=106384710; includeSubDomains; preload
x-analytics: ns=-1;special=Badtitle;loggedIn=1;WMF-Last-Access=19-Jun-2019;WMF-Last-Access-Global=19-Jun-2019;https=1
x-client-ip: 2001:630:206:6204:cc46:3ce1:27e1:3062
X-Firefox-Spdy: h2

Timing details of that slow request:

Screen Shot 2019-06-19 at 11.00.52.png (115×677 px, 15 KB)

Could you add the request url/post data used at T226084#5268060 ? Having 1 or more specific endpoints simplifies debugging.

GET /w/api.php?callback=jQuery21303406678877236998_1560936691744&action=wbgetentities&ids=P2508%7CP2631%7CP2509%7CP4276%7CP272%7CP4529%7CP5032%7CP4947%7CP5786%7CP6145%7CP1609%7CP1230%7CP2896%7CP4730%7CP2093%7CP1844%7CP1813%7CP5396%7CQ1199348%7CP435%7CP3959%7CP747%7CP1274%7CP1085%7CP5331%7CP4839%7CP4969%7CP103%7CQ49088%7CP1648%7CQ19045189%7CP3793%7CP2847%7CP3035%7CP4389%7CP5062%7CP5508%7CP4264%7CP6698%7CP6617%7CP2241%7CQ44374960%7CQ4644021%7CQ839097%7CP1268%7CQ9624%7CQ8055775%7CQ210152%7CQ4642661%7CQ635616&props=info%7Caliases%7Clabels%7Cdescriptions%7Cclaims%7Csitelinks%7Cdatatype&format=json&_=1560936691745 HTTP/1.1
Host: www.wikidata.org
User-Agent: Mozilla/5.0 (Windows NT 10.0; rv:68.0) Gecko/20100101 Firefox/68.0
Accept: */*
Accept-Language: en-GB,en;q=0.7,de;q=0.3
Accept-Encoding: gzip, deflate, br
Referer: https://tools.wmflabs.org/reasonator/?q=Q350
DNT: 1
Connection: keep-alive

Cookies redacted

since yesterday

Could you try again? There was a regression on .10 that now has been reverted, and the timing matches the .10 deployment to wikidata. This is still a bug if it no longer happens, and we need to notify so it doesn't reappear (we are now on 0.8 again, and I suspect it no longer happens).

I am going away now for this week, but if I happen to be right about my previous comment, please don't close the ticket, and make this a child of T220735. If the issues is sill persisting, it is something else still to be identified (but I wasn't able to reproduce it after returning to .8).

Response header from one of the slow requests:

HTTP/2.0 200 OK
[..]
server: mw1341.eqiad.wmnet
[..]
backend-timing: D=1129973 t=1560936702635082
[..]
x-cache: cp1081 pass, cp3032 pass, cp3041 pass

[..]
Timing details of that slow request:

Screen Shot 2019-06-19 at 11.00.52.png (115×677 px, 15 KB)

This shows the response took 1.1s from Apache/PHP (Backend-Timing, D, microseconds). The remaining 170 seconds (3 minutes) were spent somewhere in routers, proxies and intermediaries.

There have been complaints on huwiki as well (and partial / failed page loads, presumably due to some kind of timeout; I have seen a few myself). Don't know if it's related. It has definitely started sooner than the group1 deployment, though.

There have been complaints on huwiki as well (and partial / failed page loads, presumably due to some kind of timeout; I have seen a few myself). Don't know if it's related. It has definitely started sooner than the group1 deployment, though.

That's T226048: Sometimes pages load slowly for users routed to the Amsterdam data center (due to some factor outside of Wikimedia cluster), apparently.

May I humbly suggest to have a look at the consistent 2min response time of the p99 server (in grafana), before deciding it's a problem outside WMFs control, no matter how convenient that may seem?

@Magnus It is well-known currently that MediaWiki exposes many powerful API that we do not support to perform well, but allow regardless as a convenience service. If we were stricter about response times for all features, we'd probably just turn many of them off and limit the capabilities of those APIs until and unless the amount of resources required to make them work reliably fast is justified.

I expect the maintainers of this API to have tested the supported and encouraged use cases and to know whether they are fast. I haven't personally looked at the p99 for this particular API, but from experience in other endpoints, it tends to be extreme cases that we'd be very unlikely to support with fast responses.

But if they haven't in a while, it's certainly worth looking at those again from time to time.

Meanwhile, do let us know if you find a response with a slow value recorded in the Backend-Timing header. You can use this to see whether the time was spent on the web server or in transportation/routing. If it's in routing that still doesn't mean it's outside Wikimedia control, we do influence a lot of the routes between DCs and for ISPs/peering and BGP stuff. It just helps narrow it down.

Looks like the performance of wbgetentities (p99) is a bit all over the place in general (probably down to retrieval of large entities and the cache missed when wmf verison changes)

Looking at the last month:

image.png (545×1 px, 236 KB)

p95 doesn't seem to appear to be as jittery.

I havn't been able to reproduce a slow request as described yet.

@Magnus It is well-known currently that MediaWiki exposes many powerful API that we do not support to perform well, but allow regardless as a convenience service. If we were stricter about response times for all features, we'd probably just turn many of them off and limit the capabilities of those APIs until and unless the amount of resources required to make them work reliably fast is justified.

I expect the maintainers of this API to have tested the supported and encouraged use cases and to know whether they are fast. I haven't personally looked at the p99 for this particular API, but from experience in other endpoints, it tends to be extreme cases that we'd be very unlikely to support with fast responses.

But if they haven't in a while, it's certainly worth looking at those again from time to time.

That's not what the issue is about.

If a query usually runs 1-3sec, no problem if it takes 10, or 30 in rare cases. This issue is different because:

  • timing differences are extreme. 3sec vs 3min
  • this kind of thing is new, as in a few days ago, when it's been working fine for years
  • the exact same query, run again, will very likely return in the usual short time
  • the extremely long response makes tools unusable. If I'd get an error I could possibly recover, but just waiting is not easily caught
  • the extremely long response breaks some default settings, e.g. the one I use for my Rust tools

This all points to a single point of failure, either on the response generation or on the transport. Trying to weasle out of it with "APIs are complicated" is not helpful.

Meanwhile, do let us know if you find a response with a slow value recorded in the Backend-Timing header. You can use this to see whether the time was spent on the web server or in transportation/routing. If it's in routing that still doesn't mean it's outside Wikimedia control, we do influence a lot of the routes between DCs and for ISPs/peering and BGP stuff. It just helps narrow it down.

How would I "find a response with a slow value recorded in the Backend-Timing header"? I think I have posted all the data I can get from slow responses.

On another note, the Reasonator example in my original post seems to load now. I'll check if the Rust code works as well now.

Just checking back on this ticket.
Is this still happening?