Page MenuHomePhabricator

Instrument the "time to suggested edits" metric
Closed, ResolvedPublic

Description

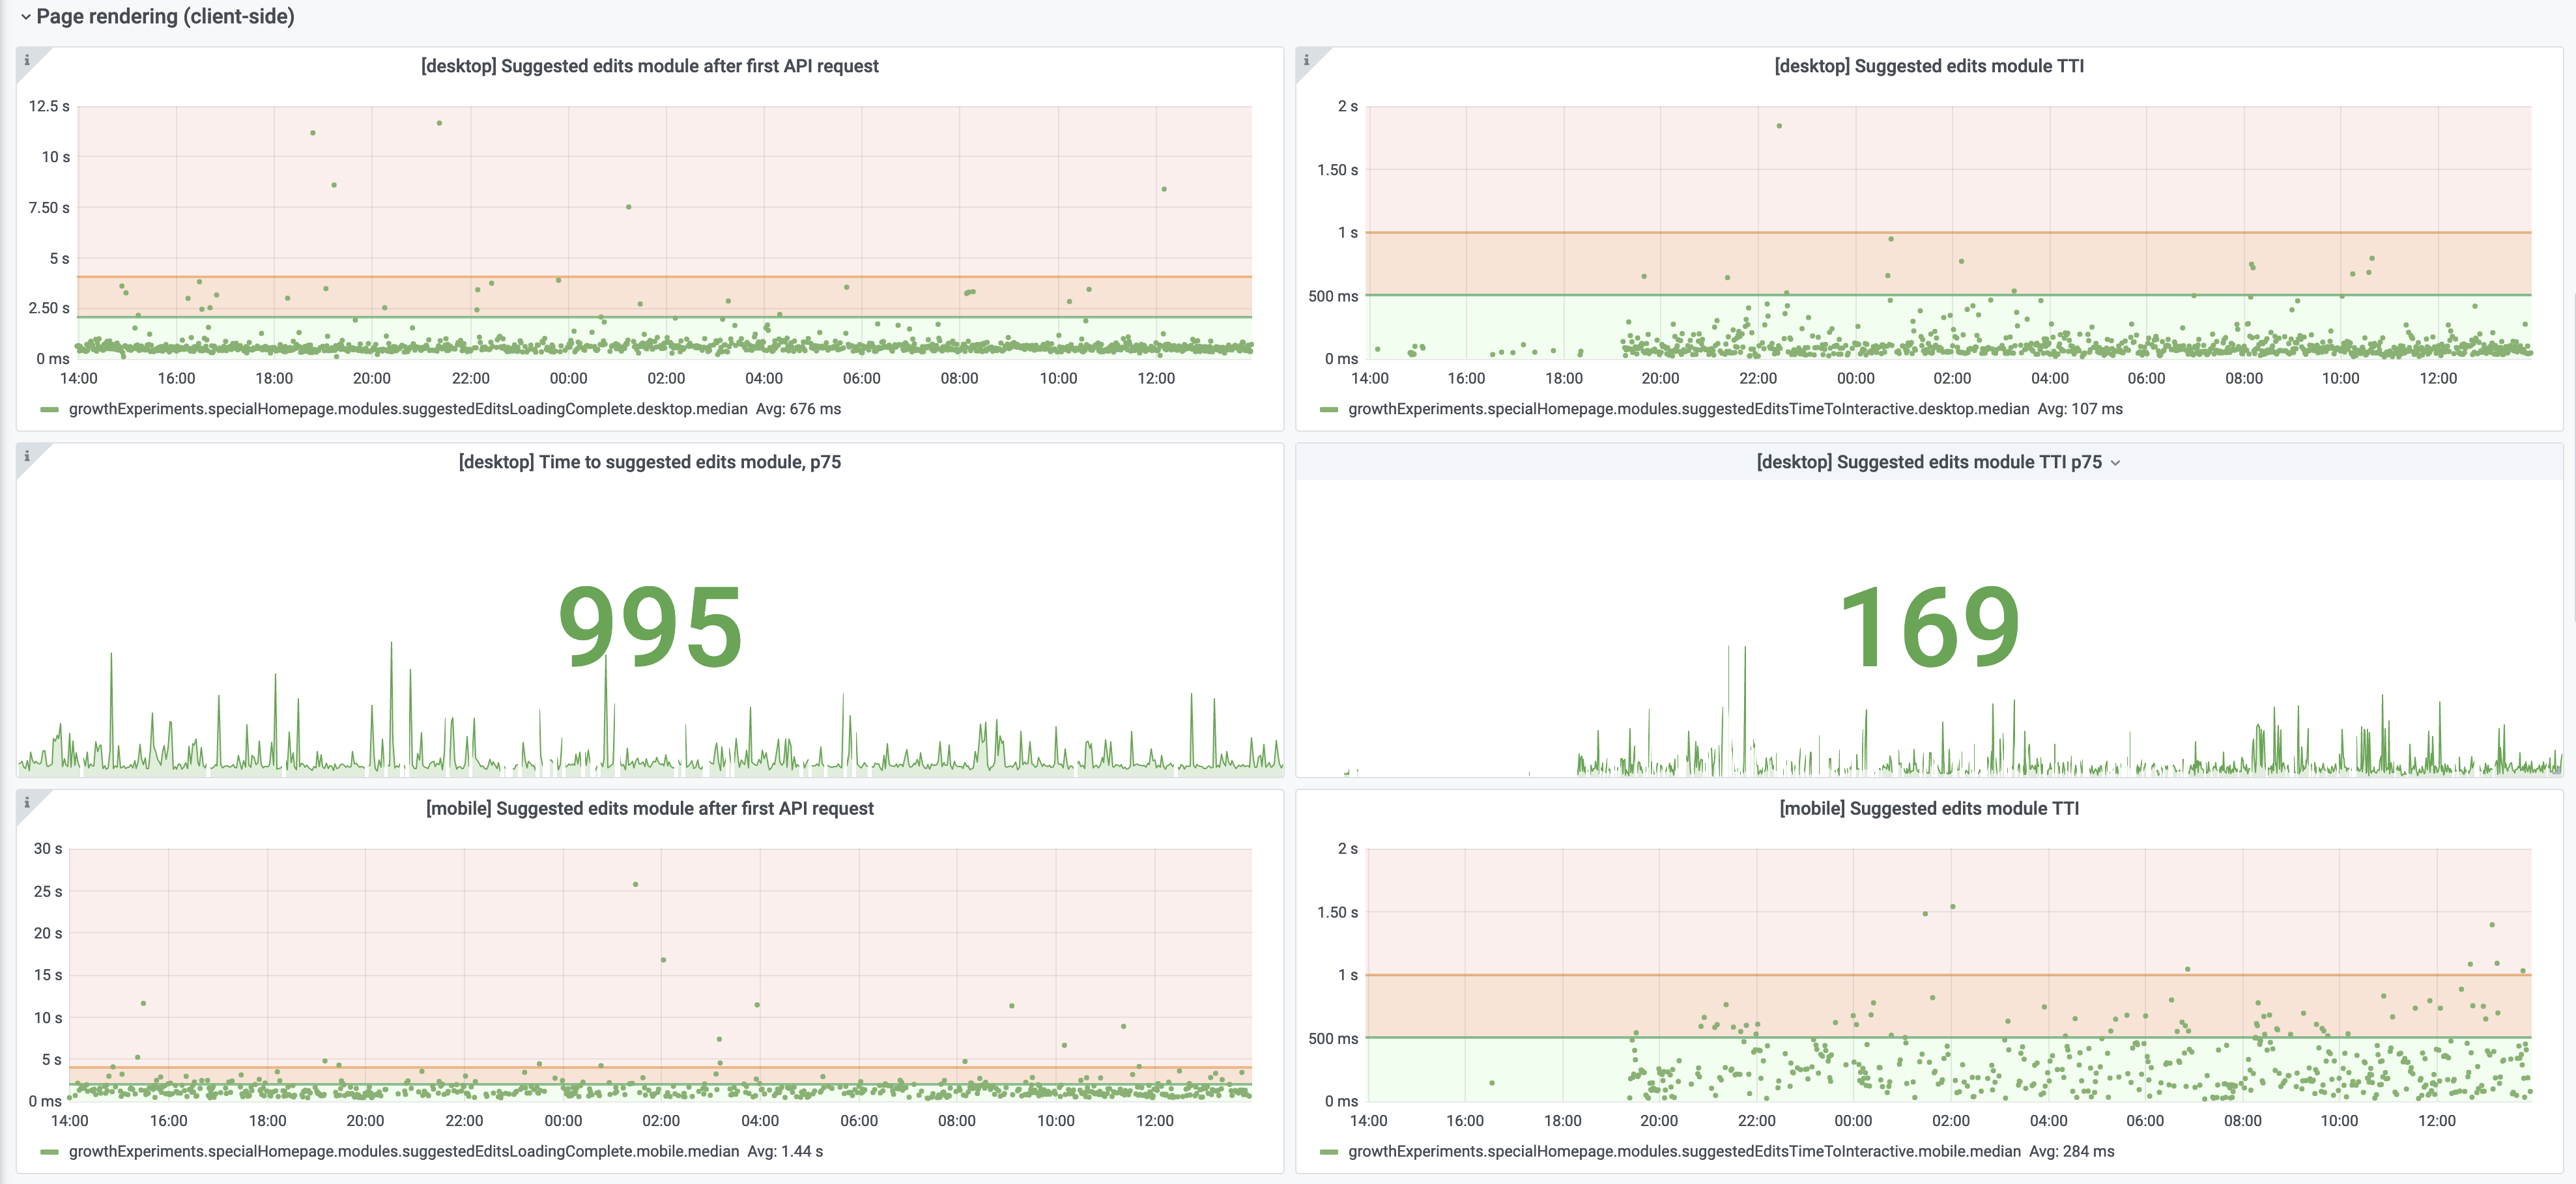
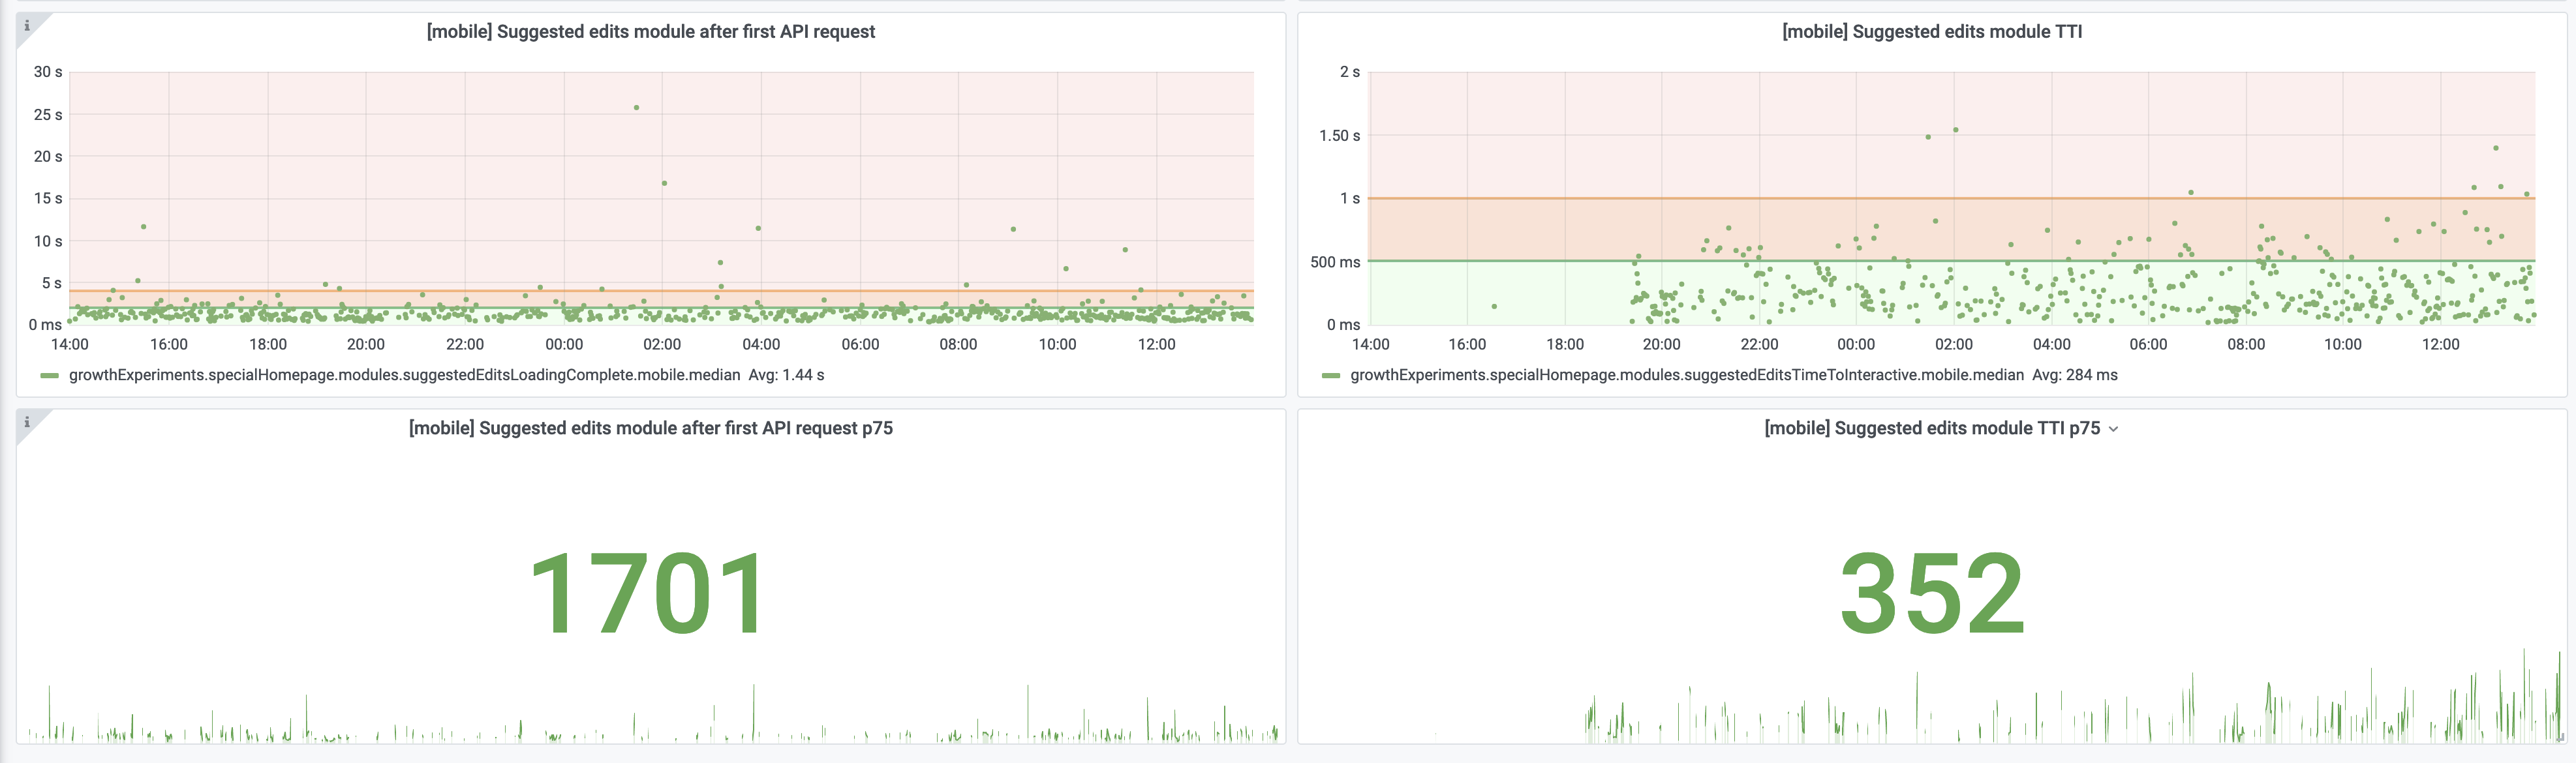
Proposed by @Gilles from the Performance Team at T240201#6132287, the idea is to collect client-side metrics for when the user first sees Suggested Edits completely loaded and interactive. This will be useful so we can measure the impact of our changes.

We will do something like:

mw.track( 'timing.MediaWiki.GrowthExperiments.timeToSuggestedEdits', mw.now() - initialLoad )

While we are looking at instrumentation for performance we could also consider:

  • Instrument server-side timing for Special:Homepage
  • client-side timing for all modules having loaded
  • Instrument various steps (search, API execution, AQS, RESTBase)

Event Timeline

Change 610756 had a related patch set uploaded (by Kosta Harlan; owner: Kosta Harlan):
[mediawiki/extensions/GrowthExperiments@master] Instrument server-side render execution of Special:Homepage

https://gerrit.wikimedia.org/r/610756

Change 610758 had a related patch set uploaded (by Kosta Harlan; owner: Kosta Harlan):
[mediawiki/extensions/GrowthExperiments@master] SuggestedEdits: Instrument time to complete loading the module

https://gerrit.wikimedia.org/r/610758

Change 610770 had a related patch set uploaded (by Kosta Harlan; owner: Kosta Harlan):
[mediawiki/extensions/GrowthExperiments@master] Instrument GrowthTasksApi methods

https://gerrit.wikimedia.org/r/610770

client-side timing for all modules having loaded

I think we could probably set this one to the side for now, I'm not sure it is too useful while we are mainly focused on a single, heavier module (Suggested Edits).

Change 610756 merged by jenkins-bot:
[mediawiki/extensions/GrowthExperiments@master] Instrument server-side render execution of Special:Homepage

https://gerrit.wikimedia.org/r/610756

Change 610758 merged by jenkins-bot:
[mediawiki/extensions/GrowthExperiments@master] SuggestedEdits: Instrument time to complete loading the module

https://gerrit.wikimedia.org/r/610758

Change 610770 merged by jenkins-bot:
[mediawiki/extensions/GrowthExperiments@master] Instrument GrowthTasksApi methods

https://gerrit.wikimedia.org/r/610770

kostajh added a subscriber: Etonkovidova.

@Etonkovidova I can post links to Grafana once these patches are in production.

Client-side metrics can be viewed in Grafana under growthExperiments.specialHomepage., there are sections for suggested edits time to complete loading and also for the various API requests we make (under growthExperiments.specialHomepage.growthTasksApi)

@kostajh -- the links you posted rewrite me just to grafana.wikimedia.org. Do you have to permission them or something?

@kostajh - checked grafana today. The all options are there and the load times, so far, do not look extreme. I also try run Lighthouse reports which showed relatively high overall ranking for performance (88%) which is kind of puzzling especially on betalabs where all filters+all difficulty levels gives timeout:

Fetching task suggestions failed: http {xhr: {…}, textStatus: "timeout", exception: "timeout"

Questions:

  • The data in grafana is scarce - the data collection has only been started in wmf.41?
  • it's only aggregate data not by wikis or anything?

@kostajh you might want to create an actual Grafana dashboard for these metrics, as those "explore" links only work when already logged into Grafana.

@kostajh -- my issue was that I was not logged in. I do have a login, but since some Grafana dashboards are accessible publicly, I thought I was logged in, just not permissioned on your graphs. Now that I have them open, though, I think I would need to be walked through how to read them. I also see very little data on them. Perhaps you can show them at a team meeting next week.

Just responding quickly to one point: there will be very little data until the train reaches group2, all the data right now is coming from test wiki.

Re-checked today - there are more data now. The above links are not actual dashboards? There is grafana Special:Hmepoage/Suggested Edits dashboard.

Moving for PM review - note my question about whether the data is completely aggregated in my comment T257371#6306872.

I will add some charts to the dashboard after I've played around with Grafana a bit more.

From our meeting a week or two ago:

  • We want to segment the performance metrics by wiki -- maybe not for everything, but probably for "time to suggested edits" as well as server-side rendering time
  • we'd like to be able to see quickly a percentage of users who fall into the different buckets (0 - 2s, 2s-4s, 4s+), this should be possible with some Grafana skills
  • add a timeshift to show this week versus previous week

Unassigning myself in case someone else wants to pick it up.

Now that we have server-side rendering of the first card, we should probably rework our performance instrumentation. In particular, the "time to suggested edits" metric no longer depends on the results from querying the API to fetch tasks before the module is ready. So the new "time to suggested edits" metric should be:

  • server side rendering time + initSuggestedEdits() but *not* the time included in fetching tasks.

If we do more work on this, we should probably also implement the necessary code to hook into Google Lighthouse reporting.

Boldly moving to ready for dev as something we could pick up sometime. I do think we should make these changes so that we continue to have meaningful performance instrumentation.

IMO time to suggested edits should simply be the time between the browser starting to load the homepage (knowable via NavigationTiming API) and the suggested edits being displayed to the user. We should have separate stats for how long some specific process took (e.g. time of loading a cached taskset) and how long it took for the user to be able to X (see the first task, interact with the first task etc). The first is good for identifying the source of regressions, and the second for getting a measure of the user experience in general; deriving the latter from the former is inaccurate and doesn't simplify the code much.

Change 720008 had a related patch set uploaded (by Kosta Harlan; author: Kosta Harlan):

[mediawiki/extensions/GrowthExperiments@master] Suggested Edits: add timing data for time to interactive

https://gerrit.wikimedia.org/r/720008

Change 720008 merged by jenkins-bot:

[mediawiki/extensions/GrowthExperiments@master] Suggested Edits: add timing data for time to interactive

https://gerrit.wikimedia.org/r/720008

kostajh claimed this task.

I've updated the Grafana charts for TTI https://grafana-rw.wikimedia.org/d/vGq7hbnMz/special-homepage-and-suggested-edits

image.png (1×3 px, 581 KB)

image.png (1×3 px, 307 KB)

I'm also marking this as resolved, as I don't think there's more to do here.

I wonder if it would be better to calculate the time since some Navigation Timing API event such as fetchStart. On one hand, it would be less useful for monitoring the performance effects caused by changes from us, since any number of other things could have an influence. On the other hand, it would match the industry interpretation of TTI and be reflective of actual user experience.

Change 726646 had a related patch set uploaded (by Kosta Harlan; author: Kosta Harlan):

[mediawiki/extensions/GrowthExperiments@master] Instrumentation: Track TTI including server-side start

https://gerrit.wikimedia.org/r/726646

Change 726646 merged by jenkins-bot:

[mediawiki/extensions/GrowthExperiments@master] Instrumentation: Track TTI including server-side start

https://gerrit.wikimedia.org/r/726646

This comment was removed by Sgs.