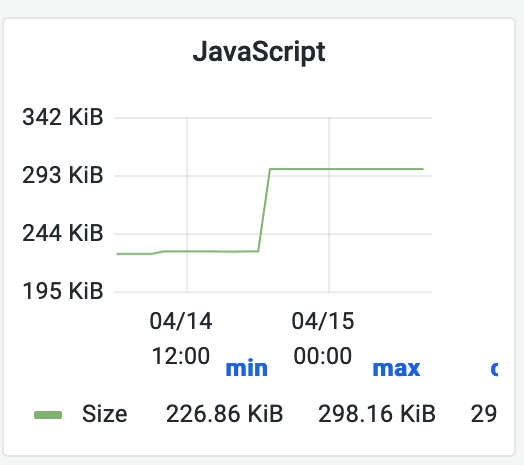
Problem
Grafana: WebPageReplay drillldown
Grafana: WebPageTest drilldown
Analysis
That's quite a hefty increase there all of a sudden.
The timeframe correlates to the 15 min window after the wmf.7 group2 deployment:
I reviewed the changelog at https://www.mediawiki.org/wiki/MediaWiki_1.39/wmf.7 but did not see anything obvious stand out here.
Fortunately, unfortunately, our alerts didn't fire as it did not immediately effect our lab measurements of rendering time (paint) and page load time (PLT). I'll note further down why that is.
And... because we didn't find it earlier via an alert, this means enough time has passed that we no longer have access to the detailed HAR files and browser profiles captured around that time. But.. this is big enough that we can probably see it stand out when just inspecting a page today.
Loading https://en.wikipedia.org/wiki/Barack_Obama in a private tab, I see the following in the Network tab:
Loading the OOUI library is suspect for sure, as we don't do client-side rendering on page load as a general principle (e.g. T112401, guidelines), and indeed there was no Layout Shift or major rendering step that I could spot that involved OOUI or anything else. Which means the payload is unused, and that explains why it didn't fire the alerts for visual completion, layout shifts, etc.
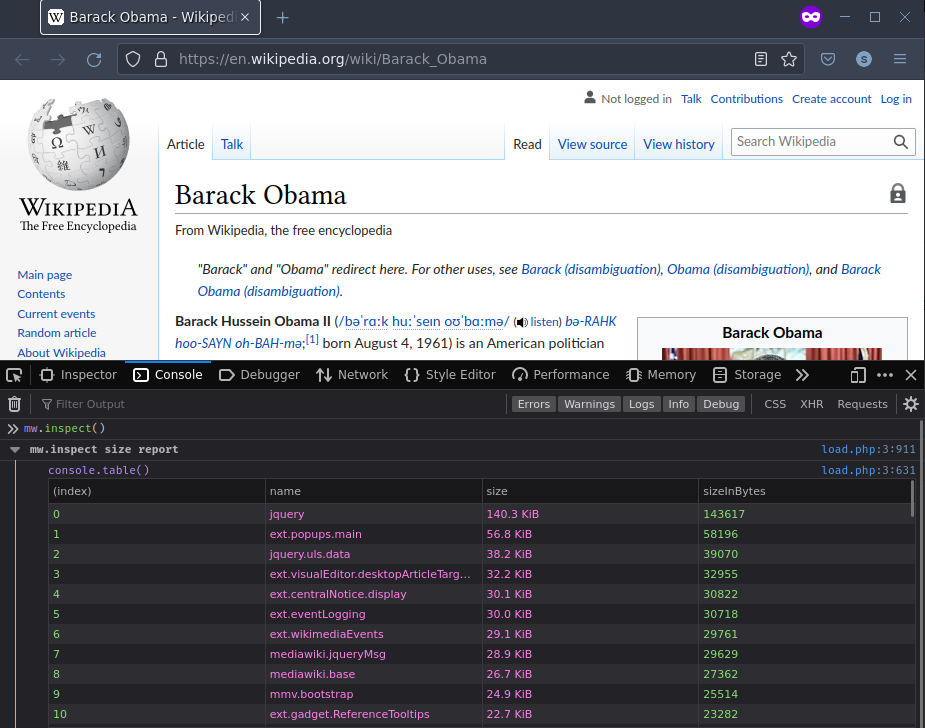
The payload can also be found in another way that's perhaps more user friendly, by invoking mw.inspect (docs, more docs):
mw.inspect size report
name size oojs-ui-core 176.0 KiB oojs-ui-widgets 101.6 KiB oojs-ui-core.styles 59.8 KiB ext.popups.main 56.8 KiB jquery.uls.data 38.1 KiB
And through a helper script of mine:
mw.loader.findReady('oojs-ui-widgets')
//> [ 0: Array [ "ext.uls.interface" ]
Indicates that ULS is the only entrypoint loaded directly on the page that brings in the module, so that's probably where the regression is coming from.
Going back to the wmf.7 changelog, there is only one ULS change:
- git #5e6838eb - Add actions menu inside content language selector (task T289840) by @santhosh

