Page MenuHomePhabricator

Phabricator master and slave crashed
Closed, ResolvedPublic

Description

˜/Reedy 10:40> #1290: The MariaDB server is running with the --read-only option so it cannot execute this statement
˜/icinga-wm 10:41> PROBLEM - haproxy failover on dbproxy1003 is CRITICAL: CRITICAL check_failover servers up 2 down 1
˜/icinga-wm 10:41> PROBLEM - haproxy failover on dbproxy1008 is CRITICAL: CRITICAL check_failover servers up 2 down 1

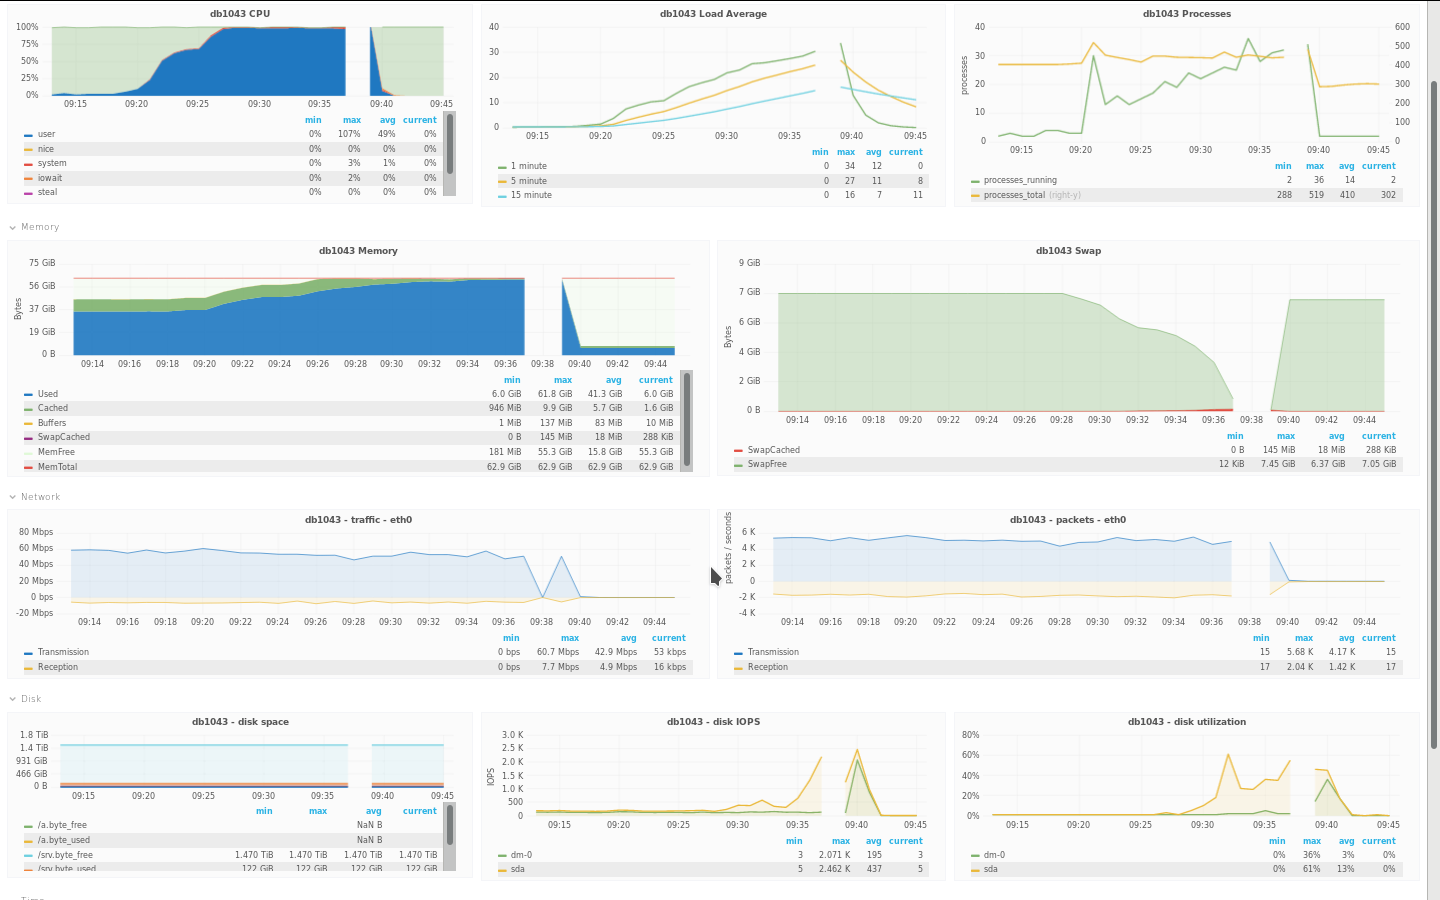
Looks like MySQL crashed:

170201  9:39:04 [ERROR] InnoDB:  InnoDB: Unable to allocate memory of size 8104.

2017-02-01 09:39:04 7fc382ee9700  InnoDB: Assertion failure in thread 140477692024576 in file ha_innodb.cc line 18984
InnoDB: We intentionally generate a memory trap.
InnoDB: Submit a detailed bug report to http://bugs.mysql.com.
InnoDB: If you get repeated assertion failures or crashes, even
InnoDB: immediately after the mysqld startup, there may be
InnoDB: corruption in the InnoDB tablespace. Please refer to
InnoDB: http://dev.mysql.com/doc/refman/5.6/en/forcing-innodb-recovery.html
InnoDB: about forcing recovery.
%%%%"%"""%%%%%%%%%%%%%%%%%%%%%%%%%%%%%%%%%%%%%%%%%%%%%"""%%%%%%%%""%%%%%%%%%"""""""""%"%"%%%%%%%%%%%%%%%%%%%%%%%%""%""170201  9:39:05 [ERROR] mysqld got signal 6 ;
This could be because you hit a bug. It is also possible that this binary
or one of the libraries it was linked against is corrupt, improperly built,
or misconfigured. This error can also be caused by malfunctioning hardware.

To report this bug, see http://kb.askmonty.org/en/reporting-bugs

We will try our best to scrape up some info that will hopefully help
diagnose the problem, but since we have already crashed,
something is definitely wrong and this may fail.

Server version: 10.0.23-MariaDB-log
key_buffer_size=134217728
read_buffer_size=131072
max_used_connections=1501
max_threads=1511
thread_count=157
It is possible that mysqld could use up to
key_buffer_size + (read_buffer_size + sort_buffer_size)*max_threads = 3448842 K  bytes of memory
Hope that's ok; if not, decrease some variables in the equation.

Thread pointer: 0x0x7fc3e8f49008
Killed
170201 09:39:11 mysqld_safe Number of processes running now: 0
170201 09:39:11 mysqld_safe mysqld restarted
170201  9:39:11 [Note] /opt/wmf-mariadb10/bin/mysqld (mysqld 10.0.23-MariaDB-log) starting as process 29023 ...
170201  9:39:11 [Warning] No argument was provided to --log-bin and neither --log-basename or --log-bin-index where used;  This may cause repliction to break when this server acts as a master and has its hostname changed! Please use '--log-basename=db1043' or '--log-bin=db1043-bin' to avoid this problem.
2017-02-01 09:39:11 7fa492504780 InnoDB: Warning: Using innodb_locks_unsafe_for_binlog is DEPRECATED. This option may be removed in future releases. Please use READ COMMITTED transaction isolation level instead, see http://dev.mysql.com/doc/refman/5.6/en/set-transaction.html.
170201  9:39:11 [Note] InnoDB: Using mutexes to ref count buffer pool pages
170201  9:39:11 [Note] InnoDB: The InnoDB memory heap is disabled
170201  9:39:11 [Note] InnoDB: Mutexes and rw_locks use GCC atomic builtins
170201  9:39:11 [Note] InnoDB: Memory barrier is not used
170201  9:39:11 [Note] InnoDB: Compressed tables use zlib 1.2.3
170201  9:39:11 [Note] InnoDB: Using Linux native AIO
170201  9:39:11 [Note] InnoDB: Using CPU crc32 instructions
170201  9:39:11 [Note] InnoDB: Initializing buffer pool, size = 47.0G
170201  9:39:14 [Note] InnoDB: Completed initialization of buffer pool
170201  9:39:14 [Note] InnoDB: Highest supported file format is Barracuda.
170201  9:39:14 [Note] InnoDB: Log scan progressed past the checkpoint lsn 1975103475491
170201  9:39:14 [Note] InnoDB: Database was not shutdown normally!
170201  9:39:14 [Note] InnoDB: Starting crash recovery.
170201  9:39:14 [Note] InnoDB: Reading tablespace information from the .ibd files...
170201  9:39:16 [Note] InnoDB: Restoring possible half-written data pages
170201  9:39:16 [Note] InnoDB: from the doublewrite buffer...
InnoDB: Doing recovery: scanned up to log sequence number 1975108718080
InnoDB: Doing recovery: scanned up to log sequence number 1975113960960
InnoDB: Doing recovery: scanned up to log sequence number 1975119203840
InnoDB: Doing recovery: scanned up to log sequence number 1975124446720
InnoDB: Doing recovery: scanned up to log sequence number 1975129689600
InnoDB: Doing recovery: scanned up to log sequence number 1975134932480
InnoDB: Doing recovery: scanned up to log sequence number 1975140175360
InnoDB: Doing recovery: scanned up to log sequence number 1975145418240
InnoDB: Doing recovery: scanned up to log sequence number 1975150661120
InnoDB: Doing recovery: scanned up to log sequence number 1975155904000
InnoDB: Doing recovery: scanned up to log sequence number 1975161146880
InnoDB: Doing recovery: scanned up to log sequence number 1975166389760
InnoDB: Doing recovery: scanned up to log sequence number 1975171632640
InnoDB: Doing recovery: scanned up to log sequence number 1975176875520
InnoDB: Doing recovery: scanned up to log sequence number 1975182118400
InnoDB: Doing recovery: scanned up to log sequence number 1975187361280
InnoDB: Doing recovery: scanned up to log sequence number 1975192604160
InnoDB: Doing recovery: scanned up to log sequence number 1975197847040
InnoDB: Doing recovery: scanned up to log sequence number 1975203089920
InnoDB: Doing recovery: scanned up to log sequence number 1975208332800
InnoDB: Doing recovery: scanned up to log sequence number 1975213575680
InnoDB: Doing recovery: scanned up to log sequence number 1975218818560
InnoDB: Doing recovery: scanned up to log sequence number 1975224061440
InnoDB: Doing recovery: scanned up to log sequence number 1975229304320
InnoDB: Doing recovery: scanned up to log sequence number 1975234547200
InnoDB: Doing recovery: scanned up to log sequence number 1975239790080
InnoDB: Doing recovery: scanned up to log sequence number 1975245032960
InnoDB: Doing recovery: scanned up to log sequence number 1975250275840
InnoDB: Doing recovery: scanned up to log sequence number 1975255518720
InnoDB: Doing recovery: scanned up to log sequence number 1975260761600
InnoDB: Doing recovery: scanned up to log sequence number 1975266004480
InnoDB: Doing recovery: scanned up to log sequence number 1975271247360
InnoDB: Doing recovery: scanned up to log sequence number 1975276490240
InnoDB: Doing recovery: scanned up to log sequence number 1975281733120
InnoDB: Doing recovery: scanned up to log sequence number 1975286976000
InnoDB: Doing recovery: scanned up to log sequence number 1975292218880
InnoDB: Doing recovery: scanned up to log sequence number 1975297461760
InnoDB: Doing recovery: scanned up to log sequence number 1975302704640
InnoDB: Doing recovery: scanned up to log sequence number 1975307947520
InnoDB: Doing recovery: scanned up to log sequence number 1975313190400
InnoDB: Doing recovery: scanned up to log sequence number 1975318433280
InnoDB: Doing recovery: scanned up to log sequence number 1975323676160
InnoDB: Doing recovery: scanned up to log sequence number 1975328919040
InnoDB: Doing recovery: scanned up to log sequence number 1975334161920
InnoDB: Doing recovery: scanned up to log sequence number 1975339404800
InnoDB: Doing recovery: scanned up to log sequence number 1975344647680
InnoDB: Doing recovery: scanned up to log sequence number 1975349890560
InnoDB: Doing recovery: scanned up to log sequence number 1975355133440
InnoDB: Doing recovery: scanned up to log sequence number 1975360376320
InnoDB: Doing recovery: scanned up to log sequence number 1975365619200
InnoDB: Doing recovery: scanned up to log sequence number 1975370862080
InnoDB: Doing recovery: scanned up to log sequence number 1975376104960
InnoDB: Doing recovery: scanned up to log sequence number 1975377824940
170201  9:39:22 [Note] InnoDB: Starting an apply batch of log records to the database...
InnoDB: Progress in percent: 0 1 2 3 4 5 6 7 8 9 10 11 12 13 14 15 16 17 18 19 20 21 22 23 24 25 26 27 28 29 30 31 32 33 34 35 36 37 38 39 40 41 42 43 44 45 46 47 48 49 50 51 52 53 54 55 56 57 58 59 60 61 62 63 64 65 66 67 68 69 70 71 72 73 74 75 76 77 78 79 80 81 82 83 84 85 86 87 88 89 90 91 92 93 94 95 96 97 98 99
InnoDB: Apply batch completed
InnoDB: Last MySQL binlog file position 0 365290759, file name ./db1043-bin.001478
170201  9:39:37 [Note] InnoDB: 128 rollback segment(s) are active.
170201  9:39:37 [Note] InnoDB: Waiting for purge to start
170201  9:39:37 [Note] InnoDB:  Percona XtraDB (http://www.percona.com) 5.6.26-76.0 started; log sequence number 1975377824940
2017-02-01 09:39:37 7f97a67f9700 InnoDB: Loading buffer pool(s) from .//ib_buffer_pool
2017-02-01 09:39:37 7f97a67f9700 InnoDB: Cannot open './/ib_buffer_pool' for reading: No such file or directory
170201  9:39:37 [ERROR] Plugin 'unix_socket' already installed
170201  9:39:37 [Note] Recovering after a crash using db1043-bin
170201  9:39:39 [Note] Starting crash recovery...
170201  9:39:39 [Note] Crash recovery finished.
170201  9:39:39 [Note] Server socket created on IP: '::'.
170201  9:39:39 [Warning] 'user' entry 'phstats@iridium' ignored in --skip-name-resolve mode.
170201  9:39:39 [Warning] 'db' entry 'phabricator_user phstats@iridium' ignored in --skip-name-resolve mode.
170201  9:39:39 [Warning] 'proxies_priv' entry '@% root@db1043' ignored in --skip-name-resolve mode.
170201  9:39:39 [Note] Event Scheduler: scheduler thread started with id 2
170201  9:39:39 [Warning] Neither --relay-log nor --relay-log-index were used; so replication may break when this MySQL server acts as a slave and has his hostname changed!! Please use '--log-basename=#' or '--relay-log=db1043-relay-bin' to avoid this problem.
170201  9:39:39 [Note] /opt/wmf-mariadb10/bin/mysqld: ready for connections.
Version: '10.0.23-MariaDB-log'  socket: '/tmp/mysql.sock'  port: 3306  MariaDB Server
170201  9:39:40 [ERROR] mysqld: Table './heartbeat/heartbeat' is marked as crashed and should be repaired
170201  9:39:40 [Warning] Checking table:   './heartbeat/heartbeat'
170201  9:39:46 [ERROR] Slave I/O: error connecting to master 'repl@db1048.eqiad.wmnet:3306' - retry-time: 60  retries: 86400  message: SSL connection error: error:00000000:lib(0):func(0):reason(0), Internal MariaDB error code: 2026
170201  9:40:46 [Note] Slave I/O thread: connected to master 'repl@db1048.eqiad.wmnet:3306',replication started in log 'db1048-bin.001436' at position 359
170201  9:40:46 [ERROR] Error reading packet from server: Could not find first log file name in binary log index file ( server_errno=1236)
170201  9:40:46 [ERROR] Slave I/O: Got fatal error 1236 from master when reading data from binary log: 'Could not find first log file name in binary log index file', Internal MariaDB error code: 1236
170201  9:40:46 [Note] Slave I/O thread exiting, read up to log 'db1048-bin.001436', position 359

This is running 10.0.23 which is not affected by the bug that hit: T156373

Event Timeline

check_ferm invoked oom-killer: gfp_mask=0x2420848, order=0, oom_score_adj=0
check_ferm cpuset=/ mems_allowed=0-1
CPU: 9 PID: 29001 Comm: check_ferm Tainted: G          I     4.4.0-2-amd64 #1 Debian 4.4.2-3+wmf4
Hardware name: Dell Inc. PowerEdge R510/0DPRKF, BIOS 1.5.3 10/25/2010
 0000000000000286 00000000486870cd ffffffff812ee1d5 ffff880e7801ba50
 0000000000000000 ffffffff811d6ac5 ffff88080b395100 ffff88080b395378
 ffff88080b395100 0000000001196f90 ffff88100866b280 ffff88080b3956f0
Call Trace:
 [<ffffffff812ee1d5>] ? dump_stack+0x5c/0x77
 [<ffffffff811d6ac5>] ? dump_header+0x62/0x1d7
 [<ffffffff8116c261>] ? oom_kill_process+0x211/0x3d0
 [<ffffffff8116c6a1>] ? out_of_memory+0x231/0x490
 [<ffffffff8117211e>] ? __alloc_pages_nodemask+0xb6e/0xbf0
 [<ffffffff811b701a>] ? alloc_pages_current+0x8a/0x110
 [<ffffffff8116964d>] ? pagecache_get_page+0xcd/0x1a0
 [<ffffffff8120f78b>] ? __getblk_slow+0xcb/0x2b0
 [<ffffffffa01cf48e>] ? __ext4_get_inode_loc+0x10e/0x3e0 [ext4]
 [<ffffffff811f4c74>] ? iget_locked+0x164/0x180
 [<ffffffffa01d2c8c>] ? ext4_iget+0x8c/0xb50 [ext4]
 [<ffffffffa01dd927>] ? ext4_lookup+0xf7/0x1f0 [ext4]
 [<ffffffff811e3429>] ? lookup_real+0x19/0x60
 [<ffffffff811e375f>] ? __lookup_hash+0x3f/0x60
 [<ffffffff811e4f76>] ? walk_component+0x236/0x500
 [<ffffffff811e5514>] ? path_init+0x1f4/0x3d0
 [<ffffffff811e5d5d>] ? path_lookupat+0x5d/0x110
 [<ffffffff811e9401>] ? filename_lookup+0xb1/0x180
 [<ffffffff81067c7f>] ? pte_alloc_one+0x2f/0x40
 [<ffffffff811e903f>] ? getname_flags+0x6f/0x1e0
 [<ffffffff811de629>] ? vfs_fstatat+0x59/0xb0
 [<ffffffff811deb8a>] ? SYSC_newstat+0x2a/0x60
 [<ffffffff8102195f>] ? fpu__restore+0xef/0x150
 [<ffffffff815950f6>] ? system_call_fast_compare_end+0xc/0x6b
Mem-Info:
active_anon:15328194 inactive_anon:1021036 isolated_anon:128
 active_file:603 inactive_file:476 isolated_file:0
 unevictable:1751 dirty:0 writeback:26 unstable:0
 slab_reclaimable:8804 slab_unreclaimable:9520
 mapped:10620 shmem:238637 pagetables:37784 bounce:0
 free:46265 free_pcp:125 free_cma:0
Node 0 Normal free:35744kB min:33844kB low:42304kB high:50764kB active_anon:30961296kB inactive_anon:1821592kB active_file:1528kB inactive_file:1612kB unevictable:4364kB isolated(anon):0kB isolated(file):0kB present:33554432kB managed:33027276kB mlocked:4364kB dirty:0kB writeback:64kB mapped:8968kB shmem:79504kB slab_reclaimable:17744kB slab_unreclaimable:22068kB kernel_stack:5232kB pagetables:86416kB unstable:0kB bounce:0kB free_pcp:148kB local_pcp:136kB free_cma:0kB writeback_tmp:0kB pages_scanned:92436 all_unreclaimable? yes
lowmem_reserve[]: 0 0 0 0
Node 1 DMA32 free:118964kB min:3380kB low:4224kB high:5068kB active_anon:2653928kB inactive_anon:531020kB active_file:8kB inactive_file:0kB unevictable:700kB isolated(anon):0kB isolated(file):0kB present:3394656kB managed:3318368kB mlocked:700kB dirty:0kB writeback:0kB mapped:3028kB shmem:117208kB slab_reclaimable:1252kB slab_unreclaimable:1300kB kernel_stack:256kB pagetables:7964kB unstable:0kB bounce:0kB free_pcp:120kB local_pcp:0kB free_cma:0kB writeback_tmp:0kB pages_scanned:68 all_unreclaimable? yes
lowmem_reserve[]: 0 28925 28925 28925
Node 1 Normal free:30352kB min:30352kB low:37940kB high:45528kB active_anon:27697552kB inactive_anon:1731532kB active_file:876kB inactive_file:300kB unevictable:1940kB isolated(anon):512kB isolated(file):0kB present:30146560kB managed:29619992kB mlocked:1940kB dirty:0kB writeback:40kB mapped:30484kB shmem:757836kB slab_reclaimable:16220kB slab_unreclaimable:14712kB kernel_stack:2768kB pagetables:56756kB unstable:0kB bounce:0kB free_pcp:232kB local_pcp:232kB free_cma:0kB writeback_tmp:0kB pages_scanned:93272 all_unreclaimable? yes
lowmem_reserve[]: 0 0 0 0
Node 0 Normal: 7914*4kB (UMEH) 439*8kB (UMEH) 27*16kB (UMEH) 4*32kB (UMH) 3*64kB (M) 0*128kB 0*256kB 0*512kB 0*1024kB 0*2048kB 0*4096kB = 35920kB
Node 1 DMA32: 507*4kB (UME) 306*8kB (UME) 209*16kB (UME) 166*32kB (UE) 80*64kB (UME) 37*128kB (UME) 21*256kB (ME) 19*512kB (UME) 7*1024kB (UME) 2*2048kB (UM) 17*4096kB (UME) = 118988kB
Node 1 Normal: 6970*4kB (ME) 85*8kB (UME) 8*16kB (ME) 4*32kB (M) 24*64kB (UM) 1*128kB (M) 0*256kB 0*512kB 0*1024kB 0*2048kB 0*4096kB = 30480kB
Node 0 hugepages_total=0 hugepages_free=0 hugepages_surp=0 hugepages_size=2048kB
Node 1 hugepages_total=0 hugepages_free=0 hugepages_surp=0 hugepages_size=2048kB
240881 total pagecache pages
28 pages in swap cache
Swap cache stats: add 2066159, delete 2066131, find 55393/109151
Free swap  = 0kB
Total swap = 7811068kB
16773912 pages RAM
0 pages HighMem/MovableOnly
282503 pages reserved
0 pages hwpoisoned
[ pid ]   uid  tgid total_vm      rss nr_ptes nr_pmds swapents oom_score_adj name
[  798]     0   798    28755    16132      62       3       39             0 systemd-journal
[  800]     0   800    10319      383      22       3      228         -1000 systemd-udevd
[ 1195]     0  1195     9270       15      23       3       87             0 rpcbind
[ 1204]   107  1204     9320      373      23       3      146             0 rpc.statd
[ 1220]     0  1220     5839        0      14       3       53             0 rpc.idmapd
[ 1238]     0  1238     6876      306      17       3       48             0 cron
[ 1239]     0  1239    13979       46      28       3      122             0 lldpd
[ 1242]     0  1242     4756      322      15       3       39             0 atd
[ 1244]   110  1244    73350     3564      45       3     1109             0 diamond
[ 1249]     0  1249   125635     4458     108       4     6210             0 salt-minion
[ 1252]   108  1252    13979      208      27       3      119             0 lldpd
[ 1256]     0  1256     4964      195      15       3       42             0 systemd-logind
[ 1300]     0  1300     3180      238      11       3       38             0 mcelog
[ 1305]   106  1305    10531      254      25       3       60          -900 dbus-daemon
[ 1317]     0  1317     1064      361       8       3       35             0 acpid
[ 1330]     0  1330     3604      373      12       3       37             0 agetty
[ 1332]     0  1332     3559      372      12       3       38             0 agetty
[ 2962]     0  2962     1084      340       8       3       35             0 mysqld_safe
[ 3272]   998  3272 18958914 16080972   36735      76  1849262             0 mysqld
[23518]   113 23518   253802     2280      56       6      365             0 prometheus-mysq
[22132]     0 22132    65721      426      32       3        0             0 rsyslogd
[  878]     0   878     6454      497      16       3        0             0 screen
[  879]     0   879     5475      567      15       3        0             0 bash
[ 9019]     0  9019    44819     7724      59       3        0             0 perl
[ 9423]   112  9423     5985      432      16       3        0             0 nrpe
[  385]     0   385    42375     4602      50       3        0             0 perl
[10883]   113 10883   223586     3110      56       6        0             0 prometheus-node
[15745]   111 15745     8454      571      21       3        0             0 ntpd
[15421]     0 15421    13904      377      31       3        0         -1000 sshd
[ 3622]   105  3622    13313      509      27       3        0             0 exim4
[12968]   999 12968    17657     1229      38       3        0             0 gmond
[12609]     0 12609     4823     1753      15       3        0             0 atop
[28982]   112 28982     5985      360      16       3        0             0 nrpe
[28986]   112 28986     5986      148      14       3        0             0 nrpe
[28987]   112 28987     1084      142       8       3        0             0 sh
[28988]     0 28988    10135      420      23       3        0             0 sudo
[28994]     0 28994     3307      586      11       3        0             0 check_ferm
[28996]   112 28996     5985      204      16       3        0             0 nrpe
[28998]   112 28998     5985      337      16       3        0             0 nrpe
[28999]     0 28999     3307      377      11       3        0             0 check_ferm
[29000]     0 29000     3307       56      11       3        0             0 check_ferm
[29001]     0 29001     3307       56      11       3        0             0 check_ferm
Out of memory: Kill process 3272 (mysqld) score 974 or sacrifice child
Killed process 3272 (mysqld) total-vm:75835656kB, anon-rss:64323888kB, file-rss:0kB

There are some really slow queries running at the time: https://tendril.wikimedia.org/report/slow_queries?host=%5Edb1043&user=&schema=&qmode=eq&query=&hours=1

The replicat (db1048 also crashed at the same time) so I am going to check the binlogs to see what happened at that time.

This is the last insert we got before the crash (of both, master and slave)

INSERT INTO `search_documentfield`
          (phid, phidType, field, auxPHID, corpus, stemmedCorpus) VALUES ('PHID-TASK-wiuz5mmruodmyfo33aqc', 'TASK', 'body', NULL, 'Replace the button\'s name and link from \"Zur Hauptseite des Wikis\" (en: to the main page of the wiki) which leads to the mainpage of Wikimedia Commons with \"Zur Hauptseite von Wikipedia\" (en: to the main page of Wikipedia) which would lead to the mainpage of Wikipedia.', 'replac the button name and link from zur hauptseit des wiki main page wiki which lead mainpag wikimedia common with von wikipedia would lead')
/*!*/;
# at 365290732
#170201  9:39:04 server id 171970592  end_log_pos 365290759     Xid = 6912796981

Both, master, db1043 and slave db1048 crashed, but db2012 didn't crash.

Marostegui renamed this task from Phabricator master crashed to Phabricator master and slave crashed.Feb 1 2017, 10:32 AM
Marostegui triaged this task as High priority.
Marostegui added a subscriber: jcrespo.

I have tried to reproduce that insert on the following versions on my lab:

  • 10.0.23
  • 10.0.28

And they didn't crash (just checking if has something to do with: T156373)

However, db1048 (the slave) also crashed and that one is only supposed to have the replication thread running right?
https://grafana.wikimedia.org/dashboard/file/server-board.json?var-server=db1048&var-network=eth0&from=now-3h&to=now

Although there are some selects there too (the rootuser was me):
https://tendril.wikimedia.org/report/slow_queries?host=%5Edb1048&user=&schema=&qmode=eq&query=&hours=2

These search matches the time of the crash on both servers and it was also executed on BOTH servers:

https://tendril.wikimedia.org/report/slow_queries_checksum?checksum=ab39d10e892fa3ec23a56a20ebde12db&host=%5Edb1043&user=&schema=&hours=2
https://tendril.wikimedia.org/report/slow_queries_checksum?checksum=2ac761d7e1455ec309713cce6c827a51&host=%5Edb1048&user=&schema=&hours=2

The SELECT is:

SELECT documentPHID, MAX(fieldScore) AS documentScore FROM (SELECT document.phid AS documentPHID, IF(field.field = 'titl', 1024, 0) + MATCH(corpus, stemmedCorpus) AGAINST ('+\"affecting\" +\"translatewiki.net\"' IN BOOLEAN MODE) AS fieldScore FROM `search_document` document JOIN `search_documentfield` field ON field.phid = document.phid JOIN `search_documentrelationship` AS `statuses` ON `statuses`.phid = document.phid AND `statuses`.relation = 'open' WHERE MATCH(corpus, stemmedCorpus) AGAINST ('+\"affecting\" +\"translatewiki.net\"' IN BOOLEAN MODE) AND field.phidType IN ('TASK') AND document.documentType IN ('TASK') LIMIT 1000) query JOIN `search_document` root ON query.documentPHID = root.phid GROUP BY documentPHID ORDER BY documentScore DESC LIMIT 0, 100

On the master it started at 9:21 and as per tendril it took 1029 seconds which is around 17 minutes, that make us to reach: 09:38
The crash happened (as per mysql logs) at 9:39:04 so it looks pretty similar.

If we look at the slave, db1048, the SELECT started at: 09:39:23 and it run for 19 seconds (got killed because the server crashed) and the server crashed at: 09:39:46 which matches the timing too.

@Marostegui hi, it looks like the server is running version Server version: 10.0.23-MariaDB-log

Should we update it to 10.0.29 the package that @jcrespo built?

However, db1048 (the slave) also crashed and that one is only supposed to have the replication thread running right?

No, at around 09:39:31, phabricator's proxy, dbproxy1003 failed over to db1048 because it lost contact with its master.

@Marostegui hi, it looks like the server is running version Server version: 10.0.23-MariaDB-log

Should we update it to 10.0.29 the package that @jcrespo built?

Hi!
I guess we will eventually upgrade it. But in this case I don't think it is related to the FTS indexes. So far it looks like a slow/massive query overloaded the server and make it run out of memory.
Remember that db1048, which also crashed, is running the new version.

The only server that didn't crash was db2012 because it never got that SELECT.

does this mean that phabricator needs improvements to it's query?

does this mean that phabricator needs improvements to it's query?

I believe so, or at least on that particular query, which made two servers crash pretty much at the same time, specially on db1048 which crashed 20 seconds after starting to process it.

We are evaluating some remedy ideas to prevent this from server side, but these are just temporary and hard patches.
@epriestley do you have any thoughts on this?

Thanks!

Mentioned in SAL (#wikimedia-operations) [2017-02-01T13:21:37Z] <marostegui> Clean up db1043 replication thread (it was replicating from db1048 which looks like an old thing) - T156905

I'm not sure why the query is slow or requires a significant amount of memory. The structure of the query specifically tries to avoid this, by sacrificing result quality to limit the cost of the query, but perhaps the structure of the query can be improved.

Here's the overall problem I have tried to solve with this query:

  • If a user queries for a very common term, they may match an extremely large number of results.
  • Matching all those results and then ranking them could potentially require a large amount of memory.
  • Avoid this by sacrificing result quality: initially match no more than 1,000 results, then rank just those results.

The intent is to give users results quickly when they execute an excessively broad search. The theory is: their search is probably too broad anyway, even if we rank the entire set of documents; and the cost of examining the entire set of documents is potentially very large.

The inner query is:

SELECT document.phid AS documentPHID, IF(field.field = 'titl', 1024, 0) + MATCH(corpus, stemmedCorpus) AGAINST ('+\"affecting\" +\"translatewiki.net\"' IN BOOLEAN MODE) AS fieldScore
  FROM `search_document` document
  JOIN `search_documentfield` field ON field.phid = document.phid
  JOIN `search_documentrelationship` AS `statuses` ON `statuses`.phid = document.phid AND `statuses`.relation = 'open'
  WHERE MATCH(corpus, stemmedCorpus) AGAINST ('+\"affecting\" +\"translatewiki.net\"' IN BOOLEAN MODE) AND field.phidType IN ('TASK') AND document.documentType IN ('TASK') LIMIT 1000

Note that this is a LIMIT 1000 with no ORDER clause. The intent is to let the database select the first 1,000 rows it can find (here: open tasks matching the search terms), without needing to build or sort a large result set. The intent is that if a user queries for search terms with a very large number of matches, we throw away 99% of them immediately in order to keep the working set small.

The outer query just groups and sorts the 1,000 results returned by the inner query.

It would be helpful to understand:

  • Is the inner query the problem on its own? When run in isolation, does it execute quickly? What does EXPLAIN look like?
  • Is the outer query the problem on its own? If you SELECT the inner query into a temporary table, then run the outer query on it, does it execute quickly? What does EXPLAIN look like?
  • Is the combination of the two queries the problem?

More broadly: Assuming the inner query is the issue, why does the inner query take a long time to return? Why does it consume a large amount of memory given that it has LIMIT 1000 with no ORDER clause? (This query may be written in a bad way that I'm just out of my depth on, and I'm not sure what to do in order to try to answer these questions.)

One vague possibility is that you may have a few documents which are extremely large: for example, perhaps someone wrote a 1GB comment on a task somewhere, including the words "translatewiki". We do not currently truncate content when building the search index, so I could imagine that this might explain the large apparent size of the working set. This seems very unlikely to be the issue, but it's the only thing I could immediately think of.

Hey @epriestley - thanks for the fast response!

I'm not sure why the query is slow or requires a significant amount of memory. The structure of the query specifically tries to avoid this, by sacrificing result quality to limit the cost of the query, but perhaps the structure of the query can be improved.

Here's the overall problem I have tried to solve with this query:

  • If a user queries for a very common term, they may match an extremely large number of results.
  • Matching all those results and then ranking them could potentially require a large amount of memory.
  • Avoid this by sacrificing result quality: initially match no more than 1,000 results, then rank just those results.

The intent is to give users results quickly when they execute an excessively broad search. The theory is: their search is probably too broad anyway, even if we rank the entire set of documents; and the cost of examining the entire set of documents is potentially very large.

The inner query is:

SELECT document.phid AS documentPHID, IF(field.field = 'titl', 1024, 0) + MATCH(corpus, stemmedCorpus) AGAINST ('+\"affecting\" +\"translatewiki.net\"' IN BOOLEAN MODE) AS fieldScore
  FROM `search_document` document
  JOIN `search_documentfield` field ON field.phid = document.phid
  JOIN `search_documentrelationship` AS `statuses` ON `statuses`.phid = document.phid AND `statuses`.relation = 'open'
  WHERE MATCH(corpus, stemmedCorpus) AGAINST ('+\"affecting\" +\"translatewiki.net\"' IN BOOLEAN MODE) AND field.phidType IN ('TASK') AND document.documentType IN ('TASK') LIMIT 1000

Note that this is a LIMIT 1000 with no ORDER clause. The intent is to let the database select the first 1,000 rows it can find (here: open tasks matching the search terms), without needing to build or sort a large result set. The intent is that if a user queries for search terms with a very large number of matches, we throw away 99% of them immediately in order to keep the working set small.

The outer query just groups and sorts the 1,000 results returned by the inner query.

It would be helpful to understand:

  • Is the inner query the problem on its own? When run in isolation, does it execute quickly? What does EXPLAIN look like?

The inner query takes QUITEto execute:

root@MISC m3[phabricator_search]>   select @@hostname;
+------------+
| @@hostname |
+------------+
| db1048     |
+------------+
1 row in set (0.00 sec)

SELECT document.phid AS documentPHID, IF(field.field = 'titl', 1024, 0) + MATCH(corpus, stemmedCorpus) AGAINST ('+\"affecting\" +\"translatewiki.net\"' IN BOOLEAN MODE) AS fieldScore
    ->   FROM `search_document` document
    ->   JOIN `search_documentfield` field ON field.phid = document.phid
    ->   JOIN `search_documentrelationship` AS `statuses` ON `statuses`.phid = document.phid AND `statuses`.relation = 'open'
    ->   WHERE MATCH(corpus, stemmedCorpus) AGAINST ('+\"affecting\" +\"translatewiki.net\"' IN BOOLEAN MODE) AND field.phidType IN ('TASK') AND document.documentType IN ('TASK') LIMIT 1000;
5 rows in set (22 min 32.80 sec)

This is the explain:

root@MISC m3[phabricator_search]> explain SELECT document.phid AS documentPHID, IF(field.field = 'titl', 1024, 0) + MATCH(corpus, stemmedCorpus) AGAINST ('+\"affecting\" +\"translatewiki.net\"' IN BOOLEAN MODE) AS fieldScore   FROM `search_document` document   JOIN `search_documentfield` field ON field.phid = document.phid   JOIN `search_documentrelationship` AS `statuses` ON `statuses`.phid = document.phid AND `statuses`.relation = 'open'   WHERE MATCH(corpus, stemmedCorpus) AGAINST ('+\"affecting\" +\"translatewiki.net\"' IN BOOLEAN MODE) AND field.phidType IN ('TASK') AND document.documentType IN ('TASK') LIMIT 1000;
+------+-------------+----------+----------+------------------+------------+---------+-------------------------------+------+-------------+
| id   | select_type | table    | type     | possible_keys    | key        | key_len | ref                           | rows | Extra       |
+------+-------------+----------+----------+------------------+------------+---------+-------------------------------+------+-------------+
|    1 | SIMPLE      | field    | fulltext | phid,key_corpus  | key_corpus | 0       |                               |    1 | Using where |
|    1 | SIMPLE      | statuses | ref      | phid,relation    | phid       | 66      | phabricator_search.field.phid |    1 | Using where |
|    1 | SIMPLE      | document | eq_ref   | PRIMARY,key_type | PRIMARY    | 66      | phabricator_search.field.phid |    1 | Using where |
+------+-------------+----------+----------+------------------+------------+---------+-------------------------------+------+-------------+
3 rows in set (0.00 sec)
  • Is the outer query the problem on its own? If you SELECT the inner query into a temporary table, then run the outer query on it, does it execute quickly? What does EXPLAIN look like?

The outer query

It takes ages to get the explain plan:

root@MISC m3[phabricator_search]> explain SELECT documentPHID, MAX(fieldScore) AS documentScore FROM (SELECT document.phid AS documentPHID, IF(field.field = 'titl', 1024, 0) + MATCH(corpus, stemmedCorpus) AGAINST ('+\"affecting\" +\"translatewiki.net\"' IN BOOLEAN MODE) AS fieldScore FROM `search_document` document JOIN `search_documentfield` field ON field.phid = document.phid JOIN `search_documentrelationship` AS `statuses` ON `statuses`.phid = document.phid AND `statuses`.relation = 'open' WHERE MATCH(corpus, stemmedCorpus) AGAINST ('+\"affecting\" +\"translatewiki.net\"' IN BOOLEAN MODE) AND field.phidType IN ('TASK') AND document.documentType IN ('TASK') LIMIT 1000) query JOIN `search_document` root ON query.documentPHID = root.phid GROUP BY documentPHID ORDER BY documentScore DESC LIMIT 0, 100;
+------+-------------+------------+----------+------------------+------------+---------+-------------------------------+------+------
| id   | select_type | table      | type     | possible_keys    | key        | key_len | ref                           | rows | Extra
+------+-------------+------------+----------+------------------+------------+---------+-------------------------------+------+------
|    1 | PRIMARY     | <derived2> | ALL      | NULL             | NULL       | NULL    | NULL                          |    2 | Using
|    1 | PRIMARY     | root       | eq_ref   | PRIMARY          | PRIMARY    | 66      | query.documentPHID            |    1 | Using
|    2 | DERIVED     | field      | fulltext | phid,key_corpus  | key_corpus | 0       |                               |    1 | Using
|    2 | DERIVED     | statuses   | ref      | phid,relation    | phid       | 66      | phabricator_search.field.phid |    1 | Using
|    2 | DERIVED     | document   | eq_ref   | PRIMARY,key_type | PRIMARY    | 66      | phabricator_search.field.phid |    1 | Using
+------+-------------+------------+----------+------------------+------------+---------+-------------------------------+------+------
5 rows in set (11 min 49.06 sec)

The query itself, I tried it again but killed it manually after 10 minutes as I didn't want to kill the server.
But I noticed this:

| 50776 | root            | localhost        | phabricator_search | Query   |   605 | **//FULLTEXT initialization//**                                                     | SELECT document.phid AS documentPHID, IF(field.field = 'titl', 1024, 0) + MATCH(corpus, stemmedCorpu
  • Is the combination of the two queries the problem?

More broadly: Assuming the inner query is the issue, why does the inner query take a long time to return? Why does it consume a large amount of memory given that it has LIMIT 1000 with no ORDER clause? (This query may be written in a bad way that I'm just out of my depth on, and I'm not sure what to do in order to try to answer these questions.)

| 50776 | root            | localhost        | phabricator_search | Query   |   605 | **//FULLTEXT initialization//**                                                     | SELECT document.phid AS documentPHID, IF(field.field = 'titl', 1024, 0) + MATCH(corpus, stemmedCorpu

So could that FULLTEXT initialization be eating up all the memory?
it definitely put some load on the server: https://grafana.wikimedia.org/dashboard/file/server-board.json?var-server=db1048&var-network=eth0&from=now-6h&to=now

Hrrm. For comparison, a similar inner query on secure.phabricator.com (searching for "phabricator" instead of "affecting translatewiki.net"; and we're on MySQL, not MariaDB) executes in 1.3s. You have something like 10x more data than we do, but the query takes 1,300x longer to execute.

How long does this simpler query -- which only uses the FULLTEXT index -- take?

SELECT phid FROM `search_documentfield` field
  WHERE MATCH(corpus, stemmedCorpus) AGAINST ('+\"affecting\" +\"translatewiki.net\"' IN BOOLEAN MODE) LIMIT 1000;

What if we dropped the phabricator_search table then re created and then do the reindexing for mysql, would that work?

Hrrm. For comparison, a similar inner query on secure.phabricator.com (searching for "phabricator" instead of "affecting translatewiki.net"; and we're on MySQL, not MariaDB) executes in 1.3s. You have something like 10x more data than we do, but the query takes 1,300x longer to execute.

How long does this simpler query -- which only uses the FULLTEXT index -- take?

SELECT phid FROM `search_documentfield` field
  WHERE MATCH(corpus, stemmedCorpus) AGAINST ('+\"affecting\" +\"translatewiki.net\"' IN BOOLEAN MODE) LIMIT 1000;

It took:

12 rows in set (11 min 6.48 sec)

And this ate most of the time:

575 | FULLTEXT initialization

Here's another possible formulation of the query based on Googling "FULLTEXT initialization", although I haven't yet found a real description of what's going on, just a lot of Stackoverflow posts about MySQL misbehaving. I'd expect this to do worse than the original query in a world where MySQL FULLTEXT indexes behave mostly like other indexes:

SELECT document.phid AS documentPHID, IF(field.field = 'titl', 1024, 0) + MATCH(corpus, stemmedCorpus) AGAINST ('+\"affecting\" +\"translatewiki.net\"' IN BOOLEAN MODE) AS fieldScore,
  field.phidType,
  document.documentType
FROM `search_document` document
JOIN (
  SELECT * FROM search_documentfield
  WHERE MATCH(corpus, stemmedCorpus) AGAINST ('+\"affecting\" +\"translatewiki.net\"' IN BOOLEAN MODE)
  AND phidType IN ('TASK')
) field ON field.phid = document.phid
JOIN `search_documentrelationship` AS `statuses` ON `statuses`.phid = document.phid AND `statuses`.relation = 'open'
WHERE document.documentType = 'TASK'
LIMIT 1000;

Maybe tuning innodb_ft_cache_size and innodb_ft_total_cache_size is needed. Little to no tuning was done after converting the table from MyISAM to InnoDB.

Ah! That seems pretty broken -- the same simple query takes 0.03s on secure.phabricator.com, so yours is ~22,000x slower for ~10x more data.

There's one StackOverflow answer here which suggests this can happen if a lot of rows have been deleted (which realistically has happened during reindexing), and that a possible fix is just to OPTIMIZE the table:

http://dba.stackexchange.com/a/106628

That feels pretty flimsy to me, but if we can't get the simple case (just ...WHERE MATCH... with no fancy stuff) working quickly we don't have any easy solutions on the Phabricator side.

Is that something you're comfortable trying?

Is that something you're comfortable trying?

Yes, that makes lot of sense, too.

Tuning innodb_ft_* parameters may also be fruitful, but I don't have any direct experience with it to provide guidance.

Ah! That seems pretty broken -- the same simple query takes 0.03s on secure.phabricator.com, so yours is ~22,000x slower for ~10x more data.

There's one StackOverflow answer here which suggests this can happen if a lot of rows have been deleted (which realistically has happened during reindexing), and that a possible fix is just to OPTIMIZE the table:

http://dba.stackexchange.com/a/106628

That feels pretty flimsy to me, but if we can't get the simple case (just ...WHERE MATCH... with no fancy stuff) working quickly we don't have any easy solutions on the Phabricator side.

Is that something you're comfortable trying?

Yes, we can try that on the slave and see what happens.

It is interesting that I was running your query above, and tried to kill it and it looks like killed but still there trying to initiate the Full Text index.

| 54541 | root            | localhost        | phabricator_search | Killed  |   387 | FULLTEXT initialization                                                     | SELECT document.phid AS documentPHID, IF(field.field = 'titl', 1024, 0) + MATCH(corpus, stemmedCorpu

I will optimize the tables once the kill has happened.

Maybe tuning innodb_ft_cache_size and innodb_ft_total_cache_size is needed. Little to no tuning was done after converting the table from MyISAM to InnoDB.

Indeed - I had a chat with @Paladox earlier today and we were looking into that

Mentioned in SAL (#wikimedia-operations) [2017-02-01T16:18:45Z] <marostegui> Optimizing table search_documentfield on db1048 - T156905

If we can't get the trivial SELECT * WHERE MATCH(...) case performing quickly, I believe the engine isn't going to be usable no matter how clever we are with nesting queries and doing joins, and we have to move away from it.

I'd like to understand exactly why the FULLTEXT index is degrading to what looks like a table scan in the basic case, but that might be a long road to go down.

To move away from the engine, I think there are two major ways forward:

  1. move to ElasticSearch (or some similar dedicated indexing server);
  2. write a custom fulltext engine using normal MySQL tables and indexes instead of FULLTEXT, which we just write off as irreparably broken.

(2) isn't quite as insane as it sounds: we already implement an "ngram" engine for substring search (https://secure.phabricator.com/T9979). This would also give us control over all the weird edge cases where users expect duck.quack to tokenize in a particular way. It would give us a pathway toward Chinese/Japanese/Korean fulltext support, too.

In the near term, the advantage of implementing fulltext using normal MySQL primitives is that we could drive it entirely on our side and just have you run a couple scripts at the end, while ElasticSearch requires more setup and ongoing operational support on your side. However, I think a lot of that is already in production in some capacity (T155299?) so the barriers around ElasticSearch may be fairly low.

Of course, ideally the OPTIMIZE just works, solves the problem, and then we maybe look at having bin/storage upgrade periodically run it during adjustment so you can forget about it.

We have elastic search as an experimental option. You can enable it through the pref by going to Developer Settings and under the elastic search section.

Though elastic earch could still gain some improvements in it's searching in phablet. It find things that mysql couldn't.

@mmodell has been working hard on improving elastic search support :)

We could possibly forward the updates @mmodell did to support elasticsearch 2. He also further improved support for elasticsearch 5. But needs a fix to prevent the index warning about elasticsearch for elasticsearch 5.

Good news:

root@MISC m3[phabricator_search]> optimize table search_documentfield;
Stage: 1 of 2 'copy to tmp table'  0.023% of stage done
Stage: 1 of 2 'copy to tmp table'   40.9% of stage done
+-----------------------------------------+----------+----------+-------------------------------------------------------------------+
| Table                                   | Op       | Msg_type | Msg_text                                                          |
+-----------------------------------------+----------+----------+-------------------------------------------------------------------+
| phabricator_search.search_documentfield | optimize | note     | Table does not support optimize, doing recreate + analyze instead |
| phabricator_search.search_documentfield | optimize | status   | OK                                                                |
+-----------------------------------------+----------+----------+-------------------------------------------------------------------+
2 rows in set (7 min 28.26 sec)

Now the query that @epriestley suggested and that previously took 11 minutes:

root@MISC m3[phabricator_search]> SELECT phid FROM `search_documentfield` field                                                          ->   WHERE MATCH(corpus, stemmedCorpus) AGAINST ('+\"affecting\" +\"translatewiki.net\"' IN BOOLEAN MODE) LIMIT 1000;
<snip>
18 rows in set (1 min 59.10 sec)

The inner query that took around 22 minutes before now takes:

root@MISC m3[phabricator_search]> SELECT document.phid AS documentPHID, IF(field.field = 'titl', 1024, 0) + MATCH(corpus, stemmedCorpus) AGAINST ('+\"affecting\" +\"translatewiki.net\"' IN BOOLEAN MODE) AS fieldScore
    ->   FROM `search_document` document
    ->   JOIN `search_documentfield` field ON field.phid = document.phid
    ->   JOIN `search_documentrelationship` AS `statuses` ON `statuses`.phid = document.phid AND `statuses`.relation = 'open'
    ->   WHERE MATCH(corpus, stemmedCorpus) AGAINST ('+\"affecting\" +\"translatewiki.net\"' IN BOOLEAN MODE) AND field.phidType IN ('TASK') AND document.documentType IN ('TASK') LIMIT 1000;
<snip>
13 rows in set (1 min 59.58 sec)

I am going to try the big query too.

And the big query finished in 5 rows in set (1 min 59.41 sec):

root@MISC m3[phabricator_search]> SELECT documentPHID, MAX(fieldScore) AS documentScore FROM (SELECT document.phid AS documentPHID, IF(field.field = 'titl', 1024, 0) + MATCH(corpus, stemmedCorpus) AGAINST ('+\"affecting\" +\"translatewiki.net\"' IN BOOLEAN MODE) AS fieldScore FROM `search_document` document JOIN `search_documentfield` field ON field.phid = document.phid JOIN `search_documentrelationship` AS `statuses` ON `statuses`.phid = document.phid AND `statuses`.relation = 'open' WHERE MATCH(corpus, stemmedCorpus) AGAINST ('+\"affecting\" +\"translatewiki.net\"' IN BOOLEAN MODE) AND field.phidType IN ('TASK') AND document.documentType IN ('TASK') LIMIT 1000) query JOIN `search_document` root ON query.documentPHID = root.phid GROUP BY documentPHID ORDER BY documentScore DESC LIMIT 0, 100;
<snip>
5 rows in set (1 min 59.41 sec)

I am going to go ahead and optimize this table on db2012 and on the master

but our only problem with elasticsearch is you can't reindex both indexes. So elasticsearch index is out of date.

we need someway to be able to index both at the same time and probly allow users to choose between elastic search and mysql either if one or the other is enabled :)

Let's still try to tune the innodb parameters. 2 minutes is also too much for a simple search.

Run optimize after an upgrade is something we should keep in mind for the future.

Screenshot for reference:

db1043-30min.png (900×1 px, 171 KB)

wow that's a lot of memory being used especially look at the cpu.

Let's still try to tune the innodb parameters. 2 minutes is also too much for a simple search.

yep, but that is done through puppet though. (I mean phabricator's my.conf file is done through puppet.)

Mentioned in SAL (#wikimedia-operations) [2017-02-01T16:54:22Z] <marostegui> Optimize table phabricator_search.search_documentfield on db2012 - T156905

Let's still try to tune the innodb parameters. 2 minutes is also too much for a simple search.

Agreed!
db2012 was optimized and will do the master tomorrow morning as we'll have less traffic.
This optimize WILL LOCK the table as it contains a full text index.

Normally optimize table can be done online, but it is not supported for full text indexes.

Hey @epriestley - thanks for the fast response!

I'm not sure why the query is slow or requires a significant amount of memory. The structure of the query specifically tries to avoid this, by sacrificing result quality to limit the cost of the query, but perhaps the structure of the query can be improved.

Here's the overall problem I have tried to solve with this query:

  • If a user queries for a very common term, they may match an extremely large number of results.
  • Matching all those results and then ranking them could potentially require a large amount of memory.
  • Avoid this by sacrificing result quality: initially match no more than 1,000 results, then rank just those results.

The intent is to give users results quickly when they execute an excessively broad search. The theory is: their search is probably too broad anyway, even if we rank the entire set of documents; and the cost of examining the entire set of documents is potentially very large.

The inner query is:

SELECT document.phid AS documentPHID, IF(field.field = 'titl', 1024, 0) + MATCH(corpus, stemmedCorpus) AGAINST ('+\"affecting\" +\"translatewiki.net\"' IN BOOLEAN MODE) AS fieldScore
  FROM `search_document` document
  JOIN `search_documentfield` field ON field.phid = document.phid
  JOIN `search_documentrelationship` AS `statuses` ON `statuses`.phid = document.phid AND `statuses`.relation = 'open'
  WHERE MATCH(corpus, stemmedCorpus) AGAINST ('+\"affecting\" +\"translatewiki.net\"' IN BOOLEAN MODE) AND field.phidType IN ('TASK') AND document.documentType IN ('TASK') LIMIT 1000

Note that this is a LIMIT 1000 with no ORDER clause. The intent is to let the database select the first 1,000 rows it can find (here: open tasks matching the search terms), without needing to build or sort a large result set. The intent is that if a user queries for search terms with a very large number of matches, we throw away 99% of them immediately in order to keep the working set small.

The outer query just groups and sorts the 1,000 results returned by the inner query.

It would be helpful to understand:

  • Is the inner query the problem on its own? When run in isolation, does it execute quickly? What does EXPLAIN look like?

The inner query takes QUITEto execute:

root@MISC m3[phabricator_search]>   select @@hostname;
+------------+
| @@hostname |
+------------+
| db1048     |
+------------+
1 row in set (0.00 sec)

SELECT document.phid AS documentPHID, IF(field.field = 'titl', 1024, 0) + MATCH(corpus, stemmedCorpus) AGAINST ('+\"affecting\" +\"translatewiki.net\"' IN BOOLEAN MODE) AS fieldScore
    ->   FROM `search_document` document
    ->   JOIN `search_documentfield` field ON field.phid = document.phid
    ->   JOIN `search_documentrelationship` AS `statuses` ON `statuses`.phid = document.phid AND `statuses`.relation = 'open'
    ->   WHERE MATCH(corpus, stemmedCorpus) AGAINST ('+\"affecting\" +\"translatewiki.net\"' IN BOOLEAN MODE) AND field.phidType IN ('TASK') AND document.documentType IN ('TASK') LIMIT 1000;
5 rows in set (22 min 32.80 sec)

This is the explain:

root@MISC m3[phabricator_search]> explain SELECT document.phid AS documentPHID, IF(field.field = 'titl', 1024, 0) + MATCH(corpus, stemmedCorpus) AGAINST ('+\"affecting\" +\"translatewiki.net\"' IN BOOLEAN MODE) AS fieldScore   FROM `search_document` document   JOIN `search_documentfield` field ON field.phid = document.phid   JOIN `search_documentrelationship` AS `statuses` ON `statuses`.phid = document.phid AND `statuses`.relation = 'open'   WHERE MATCH(corpus, stemmedCorpus) AGAINST ('+\"affecting\" +\"translatewiki.net\"' IN BOOLEAN MODE) AND field.phidType IN ('TASK') AND document.documentType IN ('TASK') LIMIT 1000;
+------+-------------+----------+----------+------------------+------------+---------+-------------------------------+------+-------------+
| id   | select_type | table    | type     | possible_keys    | key        | key_len | ref                           | rows | Extra       |
+------+-------------+----------+----------+------------------+------------+---------+-------------------------------+------+-------------+
|    1 | SIMPLE      | field    | fulltext | phid,key_corpus  | key_corpus | 0       |                               |    1 | Using where |
|    1 | SIMPLE      | statuses | ref      | phid,relation    | phid       | 66      | phabricator_search.field.phid |    1 | Using where |
|    1 | SIMPLE      | document | eq_ref   | PRIMARY,key_type | PRIMARY    | 66      | phabricator_search.field.phid |    1 | Using where |
+------+-------------+----------+----------+------------------+------------+---------+-------------------------------+------+-------------+
3 rows in set (0.00 sec)
  • Is the outer query the problem on its own? If you SELECT the inner query into a temporary table, then run the outer query on it, does it execute quickly? What does EXPLAIN look like?

The outer query

It takes ages to get the explain plan:

root@MISC m3[phabricator_search]> explain SELECT documentPHID, MAX(fieldScore) AS documentScore FROM (SELECT document.phid AS documentPHID, IF(field.field = 'titl', 1024, 0) + MATCH(corpus, stemmedCorpus) AGAINST ('+\"affecting\" +\"translatewiki.net\"' IN BOOLEAN MODE) AS fieldScore FROM `search_document` document JOIN `search_documentfield` field ON field.phid = document.phid JOIN `search_documentrelationship` AS `statuses` ON `statuses`.phid = document.phid AND `statuses`.relation = 'open' WHERE MATCH(corpus, stemmedCorpus) AGAINST ('+\"affecting\" +\"translatewiki.net\"' IN BOOLEAN MODE) AND field.phidType IN ('TASK') AND document.documentType IN ('TASK') LIMIT 1000) query JOIN `search_document` root ON query.documentPHID = root.phid GROUP BY documentPHID ORDER BY documentScore DESC LIMIT 0, 100;
+------+-------------+------------+----------+------------------+------------+---------+-------------------------------+------+------
| id   | select_type | table      | type     | possible_keys    | key        | key_len | ref                           | rows | Extra
+------+-------------+------------+----------+------------------+------------+---------+-------------------------------+------+------
|    1 | PRIMARY     | <derived2> | ALL      | NULL             | NULL       | NULL    | NULL                          |    2 | Using
|    1 | PRIMARY     | root       | eq_ref   | PRIMARY          | PRIMARY    | 66      | query.documentPHID            |    1 | Using
|    2 | DERIVED     | field      | fulltext | phid,key_corpus  | key_corpus | 0       |                               |    1 | Using
|    2 | DERIVED     | statuses   | ref      | phid,relation    | phid       | 66      | phabricator_search.field.phid |    1 | Using
|    2 | DERIVED     | document   | eq_ref   | PRIMARY,key_type | PRIMARY    | 66      | phabricator_search.field.phid |    1 | Using
+------+-------------+------------+----------+------------------+------------+---------+-------------------------------+------+------
5 rows in set (11 min 49.06 sec)

The query itself, I tried it again but killed it manually after 10 minutes as I didn't want to kill the server.
But I noticed this:

| 50776 | root            | localhost        | phabricator_search | Query   |   605 | **//FULLTEXT initialization//**                                                     | SELECT document.phid AS documentPHID, IF(field.field = 'titl', 1024, 0) + MATCH(corpus, stemmedCorpu
  • Is the combination of the two queries the problem?

More broadly: Assuming the inner query is the issue, why does the inner query take a long time to return? Why does it consume a large amount of memory given that it has LIMIT 1000 with no ORDER clause? (This query may be written in a bad way that I'm just out of my depth on, and I'm not sure what to do in order to try to answer these questions.)

Looking at the order by, there is some performance improvements in mariadb 10.1. See https://mariadb.com/kb/en/mariadb/improvements-to-order-by/ please.

Also see http://s.petrunia.net/blog/?p=103

This has happened again and crashed the master and the slave.
I have run the ALTER table to optimize the table on the master while we were on read only.

I wonder why the slave crashed if the query, when I tried it, took 2 minutes....(reminder: this server had the table optimized).
So looks like we haven't solved the issue...

Paladox raised the priority of this task from High to Unbreak Now!.Feb 1 2017, 7:29 PM

Due to it taking down the db + forcing us to switch to elastic search. I am upping the priority to unbreak.

greg lowered the priority of this task from Unbreak Now! to High.Feb 1 2017, 7:32 PM
greg subscribed.

Issue has been mitigated (we're using the ES backend for everyone now), lowering priority but keeping open for any followup wrt mariadb.

removing m3 from dbstore2001: db1043-bin.001457:753455796

Mentioned in SAL (#wikimedia-operations) [2017-02-02T07:41:54Z] <marostegui> Restart MySQL on db2012 to tune some innodb_ft flags - T156905

Hi,

Some tests I have been doing:

  • Executed the same query on db1048 (slave that crashed - OOM). Query took 2 minutes (as it did yesterday) but the server didn't crash.

Checked the last insert on that host before the crash just in case, but it is not even related to the problematic table

INSERT INTO `search_indexversion` (objectPHID, extensionKey, version)
        VALUES ('PHID-TASK-sobshatb24lkqo26e54u', 'fulltext', '2679053:none')
        ON DUPLICATE KEY UPDATE version = VALUES(version)
  • Tunning innodb_ft_cache_size and innodb_ft_total_cache_size on db2012:

I have been changing their values (and rebuilding the index, and trying to get the table in memory) and there has not been any significant change in performance.
The last test I did was setting innodb_ft_total_cache_size to its max allowed value (1.6G) and innodb_ft_cache_size to the max value too (80MB). There has been no significant changes to the query speed.

  • I have run 10 parallel threads on db2012 (several times) with the big query and I have not brought down db2012 even though I have generated more load than the one db1048 had when it crashed yesterday. I have run those 10 threads with and without the defaults values for innodb_ft_cache_size and innodb_ft_total_cache_size :

db2012: https://grafana.wikimedia.org/dashboard/file/server-board.json?var-server=db2012&var-network=eth0&from=now-24h&to=now
db1048: https://grafana.wikimedia.org/dashboard/file/server-board.json?var-server=db1048&var-network=eth0&from=now-24h&to=now

Note that db2012 wasn't using as much memory as db1048 when it crashed.

Also running two threads with the big query on db1048 didn't make it crash. There was just a small increase on memory (expected), but that is it. Not like yesterday where before the crash it go a 10GB of used RAM increase (and swapped)

I think the problem was compounded by search-as-you-type which fires off a bunch of queries in rapid succession as you type a search term in the 'edit related tasks' dialog box.

Marostegui claimed this task.

I am going to close this for now as the short-term solution was to move search to ES and this hasn't happened again ever since.
If it happens again we can reopen it.
Thanks everyone for the help!!

Elasticsearch is actually a long term fix. I think we have permanently moved to it. We were preparing to move to it before. :)

Elasticsearch is actually a long term fix. I think we have permanently moved to it. We were preparing to move to it before. :)

Thanks - I meant the initial way to triage it :-)
But I agree, ES is probably a better way to handle the search than MySQL for this particular case. I guess you guys were planning to move to ES eventually but maybe this rushed it a tiny bit ;-)
Thanks!!

Yep, @mmodell has improved searching by a lot :)