Page MenuHomePhabricator

Strong reduction of computing time at Wikivoyage needed
Closed, ResolvedPublic

Description

If you are looking for the profiling data at the article "Halle (Saale)" at the German Wikivoyage (https://de.wikivoyage.org/wiki/Halle_%28Saale%29) you will learn that the total computing time is between 8 an 10 seconds. It is much time because the maximum Lua time is restricted to 10 s. I think it is too much. A few weeks ago it took only about 4 seconds. I do not know what happened but we made only minor changes to our scripts. Unfortunately we have no protocol to analyze the time consumption. Of course the article of Halle (Saale) is a test case to learn what would be happen if we are using Wikidata data on a grand scale.

Most of the computing time is necessary for the vCard template. On average it takes about 15 ms if no Wikidata call is made and about 65 ms with Wikidata calls.

There are 170 expensive Lua calls:

  • 50 mw.title.new('Media:' .. image).exists calls, about 10 ms each
  • 120 mw.wikibase.getEntity( id ) calls, about 50 ms each

Of course this is a huge number of getEntity() calls. But this can be happen also on Wikipedias for instance for fetching reference data.

As I said I do not know why the computing time is as much. So I think of several reasons:

  • Wikivoyage is hosted on a low-performance server. In the last days there were often long-term loading times for articles, for edit mode and watch lists. Maybe there are too many accesses to Wikivoyage. The Alexa page rank is now about 16.000 similar to Wikidata (about 14.000).
  • Wikidata is hosted on a low-performance server.
  • We are trying to prevent mw.title.new('Media:' .. image) calls. The 50 image checks mentioned are for invisible images because they are shown only on the map. We need this for maintenance. We proved already several ways to overcome this (T179636, T189406). But for now we have no other opportunity. But finally we will get a reduction of time consumption of about half a second.
  • If you use a template without a module invocation it takes about 5 ms, with a module invocation about 15 ms and more. Maybe there is an opportunity for optimization. In case of many template/module calls parallel computing could be a mean reducing the time for waiting (of course not the computing time itself). It could be helpful to store Lua data for the whole parsing process which will not be deleted after a module call.
  • Of course the main optimization has to undertaken at Wikidata itself. If we cannot reduce the Wikidata access time Wikidata will be become useless. We have only one mw.wikibase.getEntity( id ) call per template. Several tables like https://de.wikivoyage.org/wiki/Modul:CountryData/Geography help us to prevent additional Wikidata calls. We already checked all opportunities to reduce the Wikidata access time and made a proposal to reduce the computing time for mw.wikibase.getEntity( id ) calls (T179638).

I hope you can help us for the reduction of computing time.
Event Timeline

Just FYI, all wikis are hosted on the same cluster.

Reedy subscribed.

It sounds more like a DB issue... page existence and getEntity() are going to cause DB hits (if there is no cache in-between)

And as Max said, there's no difference between the app servers that wikidata/wikivoyage run in in comparison to Wikipedia for example. Their is a difference between database servers though

And as Max said, there's no difference between the app servers that wikidata/wikivoyage run in in comparison to Wikipedia for example. Their is a difference between database servers though

On the other hand, I believe it's the same database servers being hit for Wikidata data whether it's Wikipedia or Wikivoyage fetching the data.

There are 170 expensive Lua calls:

  • 50 mw.title.new('Media:' .. image).exists calls, about 10 ms each
  • 120 mw.wikibase.getEntity( id ) calls, about 50 ms each

I don't know how you determined those timings, but they don't seem to represent actual CPU usage.

Enabling Scribunto's sampling profiler on Wikimedia wikis is annoyingly complicated (you have to hack in a "forceprofile" parameter in the submission of a preview with the 2010 wikitext editor, e.g. by appending "&forceprofile=1" to the <form> tag's action attribute, or use the action API's action=parse), but for https://de.wikivoyage.org/wiki/Halle_%28Saale%29 I see (on one preview)

Scribunto_LuaSandboxCallback::addStatementUsage		4280 ms	52.2%
Scribunto_LuaSandboxCallback::callParserFunction		1680 ms	20.5%
Scribunto_LuaSandboxCallback::addSiteLinksUsage		780 ms	9.5%
Scribunto_LuaSandboxCallback::getEntity		700 ms	8.5%
Scribunto_LuaSandboxCallback::gsub		280 ms	3.4%
recursiveClone	<mwInit.lua:41>	100 ms	1.2%
Scribunto_LuaSandboxCallback::fullUrl		60 ms	0.7%
Scribunto_LuaSandboxCallback::getEntityStatements		60 ms	0.7%
Scribunto_LuaSandboxCallback::getExpandedArgument		40 ms	0.5%
Scribunto_LuaSandboxCallback::match		40 ms	0.5%
[others]		180 ms	2.2%

Note the granularity of the sampling is 20ms, so those 40ms and 60ms measurements are probably noise. If you want a clearer picture, you'd probably want to collect data from multiple previews of the page and compare.

That points to Wikibase code as using most of the time. addStatementUsage, as far as I can tell, is called when you access anything in the claims table of an entity. Are you doing a lot of that?

Another 1.6 seconds are used inside frame:callParserFunction() (or possibly frame:extensionTag(), which uses that internally). Are you doing a lot of that?

I note that getEntity() only clocks in at 700ms, not the 6000ms from your "120 mw.wikibase.getEntity( id ) calls, about 50 ms each". That's not too surprising. "Expensive" functions are usually marked as such since they do database accesses that could be problematic if too many are done during the processing of a page, but waiting on a database access doesn't use CPU time. But I also note the total wall clock time for the preview is only 1 second longer than the total CPU time used, so there's still not as much waiting going on there as your numbers imply.

In case of many template/module calls parallel computing could be a mean reducing the time for waiting (of course not the computing time itself).

That's not terribly likely, since neither PHP nor Lua support that very well as far as I know.

It could be helpful to store Lua data for the whole parsing process which will not be deleted after a module call.

You can already do that with mw.loadData(), for static data or data that you can compute without reference to the parameters of any particular #invoke. There's intentionally no way for one #invoke to save data to be used by a later #invoke, however (see T67258).

Thanks very much for your answers.

As I told now parsing takes now between 8 to 10 s, a few weeks ago it was only 4 s. I have no explanations for this phenomenon of the 100 % increase of the computing time. Is there anybody who knows the reason?

I estimated the timings from the profiling data in the html script comparing vCard templates with and without Wikidata usage. If I add Scribunto_LuaSandboxCallback::getEntity and Scribunto_LuaSandboxCallback::addStatementUsage times then I get about 5000 ms as I estimated it above. But I thought that most of the time was used for Scribunto_LuaSandboxCallback::getEntity not for accessing the claims table.

Our intention is to use Wikidata as much as possible. This is necessary for multiple use in a multi-language project like Wikivoyage. For instance, we are fetching almost all data from data sets like https://www.wikidata.org/wiki/Q42016015. So we have of course many (sometimes up to 20) accesses to the claims table. As it was told to me by the Wikidata team this is less expensive than using mw.wikibase.getBestStatements( id, p ) for each property. Maybe there was a change of the anEntity:getBestStatements( p ) function causing that considerable increase in the computing time.

Of course, we are using frame:extensionTag() once per template call. It is done in Module:Map generating a <maplink> tag. There is no other way to do this.

The DB servers serving wikivoyage databases and wikidata have the same HW. We haven't replaced/change any HW for any of those sections:

The servers in s3 (wikivoyage) are the same (512GB + SSDs): the vslow server is the slowest one, but it only receives 5% of the main traffic (and 100% of the vslow/dump traffic).
The servers in s8 (wikidata) are all the same (512GB + SSDs).

Again, we have not changed/replaced HW in any of those sections in the past weeks.

Change 418887 had a related patch set uploaded (by Thiemo Kreuz (WMDE); owner: Thiemo Kreuz (WMDE)):
[mediawiki/extensions/Wikibase@master] Fix UsageDeduplicator accidentially being called way to often

https://gerrit.wikimedia.org/r/418887

Change 418900 had a related patch set uploaded (by Thiemo Kreuz (WMDE); owner: Thiemo Kreuz (WMDE)):
[mediawiki/extensions/Wikibase@master] Micro-optimization of EntityUsage::getIdentityString

https://gerrit.wikimedia.org/r/418900

Change 418906 had a related patch set uploaded (by Thiemo Kreuz (WMDE); owner: Thiemo Kreuz (WMDE)):
[mediawiki/extensions/Wikibase@master] Test UsageDeduplicator not beeing called more than once

https://gerrit.wikimedia.org/r/418906

Change 418887 merged by jenkins-bot:
[mediawiki/extensions/Wikibase@master] Fix UsageDeduplicator accidentially being called way to often

https://gerrit.wikimedia.org/r/418887

Thanks a lot for the incredibly helpful investigation, @Anomie! The addStatementUsage appearing at the top of the list made me very curious. This call should be cheap. And indeed, I found an actual bug we introduced via https://gerrit.wikimedia.org/r/405013 a few weeks ago. See https://gerrit.wikimedia.org/r/418887 for the fix.

@RolandUnger, can you please wait for the next "MediaWiki train" for Wikivoyage (should happen Wednesday night, see https://wikitech.wikimedia.org/wiki/Deployments#Wednesday,_March_14), repeat the test you did and report here if something changed, and how? That would be very helpful. Thank you!

Change 418900 merged by jenkins-bot:
[mediawiki/extensions/Wikibase@master] Micro-optimization of EntityUsage::getIdentityString

https://gerrit.wikimedia.org/r/418900

@thiemowmde Of course I can wait until Wednesday/Thursday to test it again. The report will follow.

Change 418906 merged by jenkins-bot:
[mediawiki/extensions/Wikibase@master] Test UsageDeduplicator not being called more than once

https://gerrit.wikimedia.org/r/418906

Today the computing time was similar to the values a few weeks ago. For https://de.wikivoyage.org/wiki/Halle_%28Saale%29, we have now 3700-3900 ms as compared to about yesterday's 8000 ms for 237 vCard templates. Comparing with other articles I estimated a computing time of about 11 ms for a vCard without Wikidata access and about 20 ms for a vCard with Wikidata access. The difference seems to be mainly attributed to mw.wikibase.getEntity( id ) calls.

thiemowmde triaged this task as Medium priority.Mar 15 2018, 9:47 AM
thiemowmde removed a project: Patch-For-Review.
thiemowmde moved this task from needs discussion or investigation to monitoring on the Wikidata board.

This sounds like the fixes @hoo and I made cut the runtime in half. That's awesome! @RolandUnger, does this mean we can close this ticket as resolved? I would love to, so we can focus on other tickets again. Closing this does not mean we reached an end of possible optimizations – the contrary. We are investigating the Wikibase Lua library right now (see T182147: more convenience functions for Lua). This includes looking closely at the performance of the existing and new Lua features we will introduce.

FYI, Scribunto's profiler now reports

Scribunto_LuaSandboxCallback::callParserFunction		1560 ms	45.1%
Scribunto_LuaSandboxCallback::getEntity		580 ms	16.8%
Scribunto_LuaSandboxCallback::gsub		320 ms	9.2%
Scribunto_LuaSandboxCallback::addStatementUsage		300 ms	8.7%
?		100 ms	2.9%
Scribunto_LuaSandboxCallback::preprocess		100 ms	2.9%
recursiveClone	<mwInit.lua:41>	60 ms	1.7%
Scribunto_LuaSandboxCallback::getExpandedArgument		60 ms	1.7%
Scribunto_LuaSandboxCallback::getFileInfo		40 ms	1.2%
Scribunto_LuaSandboxCallback::fullUrl		40 ms	1.2%
[others]		300 ms	8.7%

for a preview of that page.

Thanks again to @Anomie for the profiler details. The fixes made by @thiemowmde could help to reduce the computing time of the Wikibase related calls from former 5000 ms to 900 ms now. I agree with thiemowmde to investigate further improvements in frame of T182147.

I propose to separate the problem of expensive parser-function calls to another task. Most of these calls are made to create the Kartographer <maplink> extension tags. That's why I created the task T189769. From my point of view this seems to be the best way to prevent expensive parser-function calls.

We can close this task if you agree with the separation of the Kartographer calls.

thiemowmde claimed this task.

Yes, that Maps (Kartographer) issue needs to have it's own ticket. Thanks for filling one!

I can not as well a constant growth of computing time in Lua, especially in

recursiveClone <mwInit.lua:41>

which is now the topmost time-spender in pages using many Lua calls (even without using Wikidata at all).

As well there's a constant need to get the Mediawiki expansion of "{{int:Lang}}", which is also very costly from Lua, even if the parser expasion is cached (it should not change across multiple "#invoke" calls from the same parsed page): this expansions is still needed because Scribunto, unfortunately, still does NOT expose the "userLanguage", in the "mw.*" properties, even if that property is exposed in the PHP API (that Scribunto natively has access to!) And there's no other way to get this (Scribunto only exposes the site's default language). When will there be a "mw.userLanguage" property in Scribunto ? (possibly other variables exposed in the PHP API), put together into a read-only table). This would allow us to drop costly calls to the "frame:expand()" from Lua back to Mediawiki (which is slow simply because it also performs an internal costly "recursiveClone()" call.

Note that the "recursiveClone()" is called multiple times instead of keeping the SAME clone for reuse in further calls again from MediaWiki (then to Lua back then back to the MediaWiki parser) in a cache, preserved as long as the current page is being fully parsed: that Mediawiki parser clone is just used to preprocess fragments of pages (e.g. a single template transclusion, or parser function call, or magic keyword expansion). And because these clones are not persistant, they don't seen to have their expansion cached (so if you call from Lua to Mediawiki for such expansion of the same string, the result of that expansion is visibly never kept, or jsut kept in the cache of the "recursive clone", which is never reused later.

I don't know what "recursiveClone()" does, but it is by evidence constantly doing more and more over time (some Wikimedia servers will cope with this, but their performance varies a lot (for example the "mw1411" parser is MUCH faster than "mw1269": we cannot predict which server will be selected randomly, but there's evidence that they are not balanced accordingly even if they haver the same limit of 10 seconds to parse any page: on "mw1269" now we have systematic failures, but on "mw1411" this works. But other time, less and less servers are capable to supprot the same pages, as they need more time to do their job and there's very little we can do to optimize the page and save processing time, or memory).

So I am convinced that Scribunto now a severe stability problem and that the more you update it, to cover corner cases, the more it needs time and resources to do exactly the same intended things (and I note as well that Scribunto constantly need more memory). Scribunto requires a stronger analysis of its performances and to know what it wastes (may be the bug is not in Scribunto itself but in the PHP engine?).

First off, I don't know why you're resurrecting a bug that was closed over 3 years ago. File a new one.

I don't know what "recursiveClone()" does, but it is by evidence constantly doing more and more over time (some Wikimedia servers will cope with this, but their performance varies a lot (for example the "mw1411" parser is MUCH faster than "mw1269": we cannot predict which server will be selected randomly, but there's evidence that they are not balanced accordingly even if they haver the same limit of 10 seconds to parse any page: on "mw1269" now we have systematic failures, but on "mw1411" this works. But other time, less and less servers are capable to supprot the same pages, as they need more time to do their job and there's very little we can do to optimize the page and save processing time, or memory).

mw1411 is newer than mw1269.

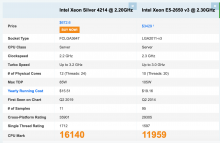
mw1411: Intel(R) Xeon(R) Silver 4214 CPU @ 2.20GHz
mw1269: Intel(R) Xeon(R) CPU E5-2650 v3 @ 2.30GHz

https://www.cpubenchmark.net/compare/Intel-Xeon-Silver-4214-vs-Intel-Xeon-E5-2650-v3/3535vs2344

Circa 5 years difference on the CPU release date; it's not really a surprise there's a difference.

Then there's obviously the potential of differing load amounts and patterns on different machines.

Screenshot 2021-04-04 at 01.05.17.png (1×1 px, 155 KB)

While you may be right that some performance and optimisation work is needed on Scribunto (though Ori has been poking a few bits recently), you have to be aware the modules also get more complex and people do more. And it works faster on newer machines, so then people add more... Repeat.