Page MenuHomePhabricator

ReadingLists performance degradation
Closed, ResolvedPublic

Assigned To
Authored By
Tgr
Apr 30 2018, 5:30 PM

Description

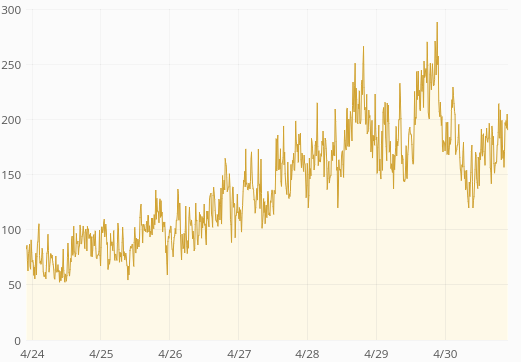
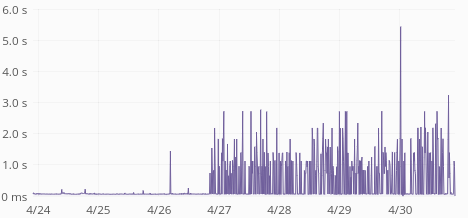
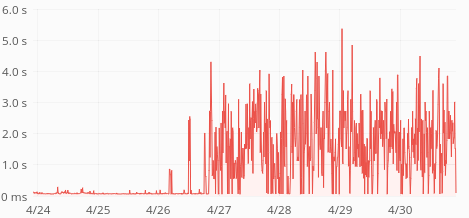
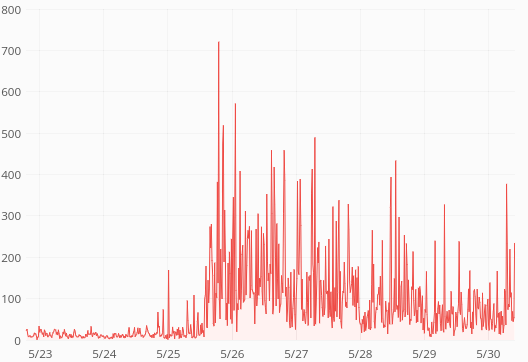
ReadingLists API response times have skyrocketed last week:

medianp99
reading-lists-median.png (218×468 px, 90 KB)
reading-lists-p99.png (218×469 px, 110 KB)

https://grafana.wikimedia.org/dashboard/db/reading-list-service

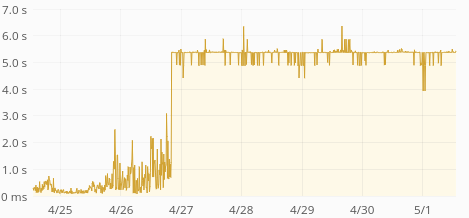
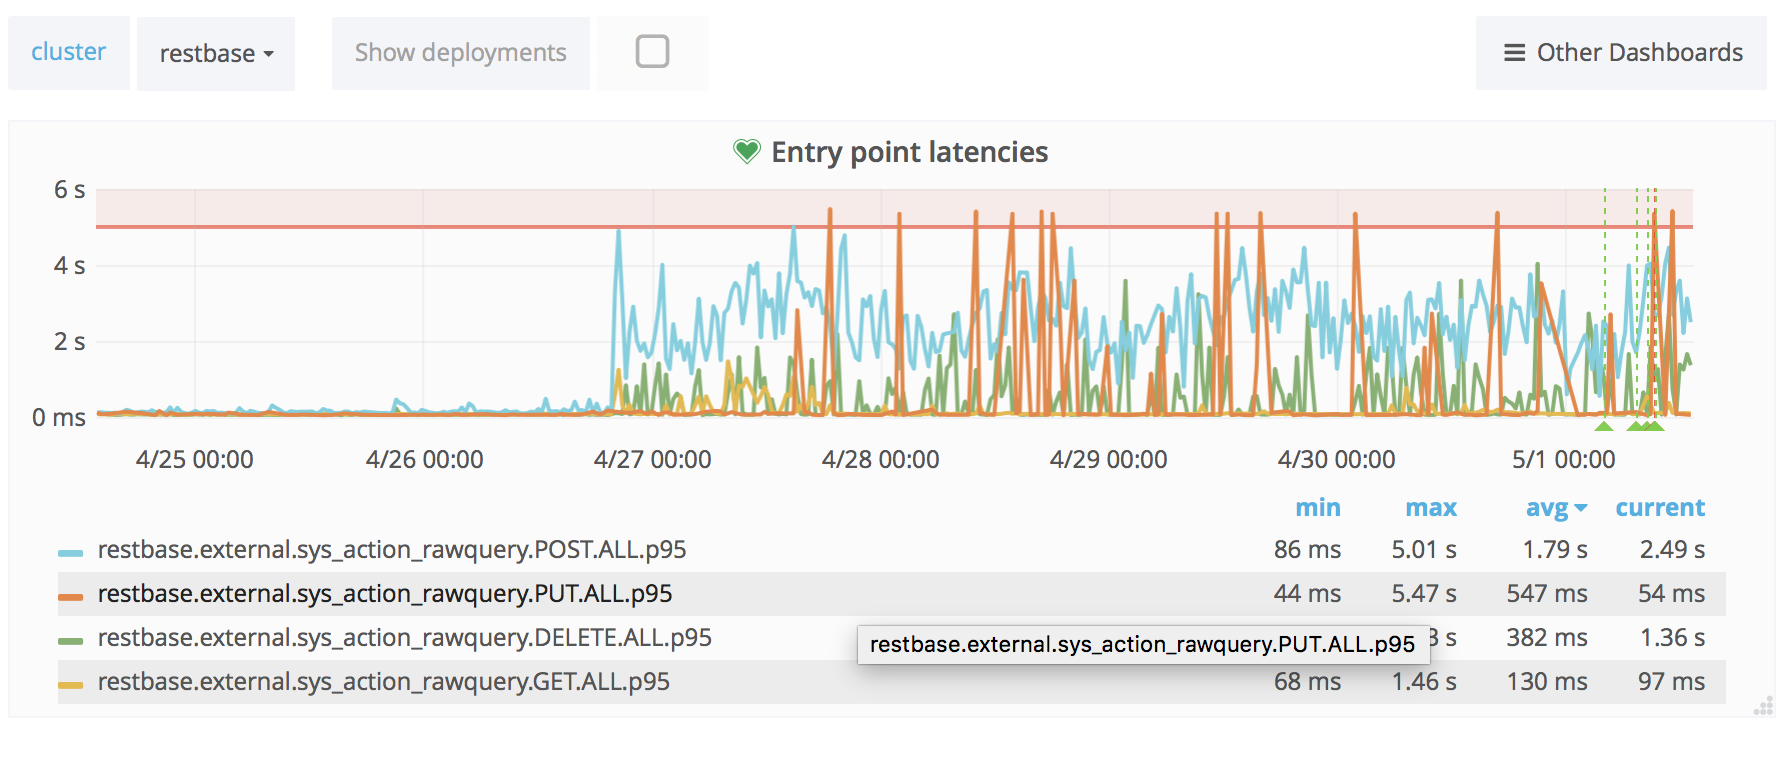
Average response time is up from 60ms to 400ms. p75 is up from 80ms to 1s. p95 is up from 250ms to 3.5s. p99 is up from 0.5s to 5s. Median is unchanged (around 50ms) so this only affects 30-40% of the requests.

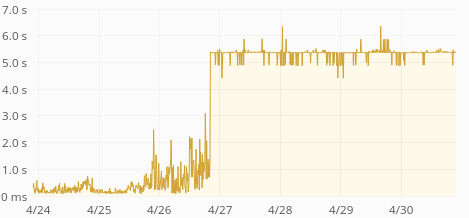
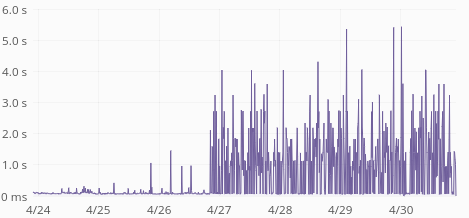
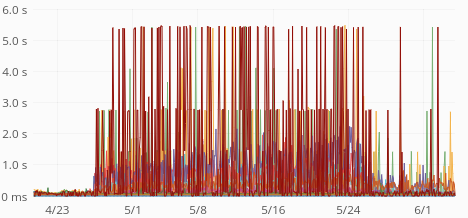
The jump coincides with the MW train deploy:

restbase-rawquery.png (407×1 px, 193 KB)

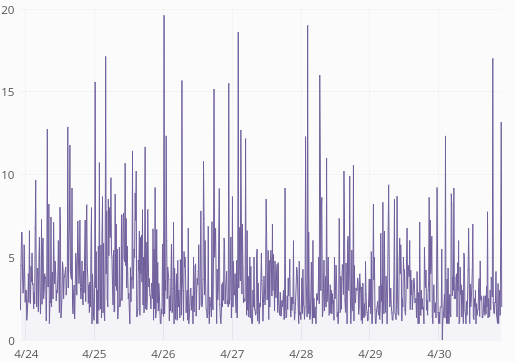
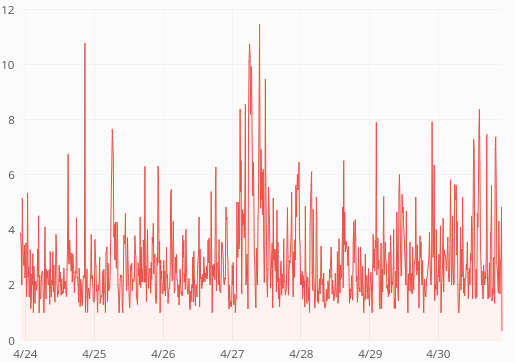
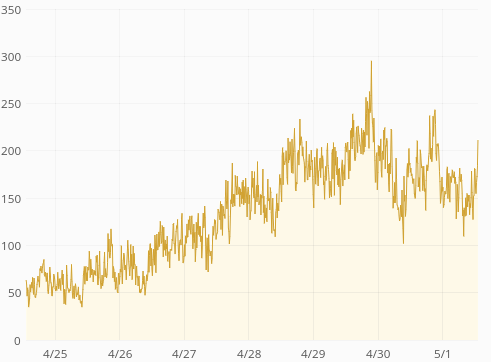
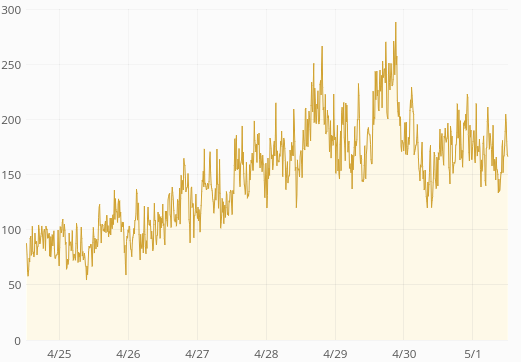
There was traffic growth during the period but not nearly so abrupt as the response time change (and the traffic comes from mobile apps so traffic patterns are not affected by the train).

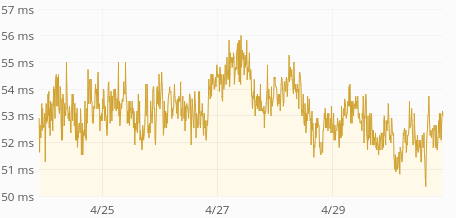
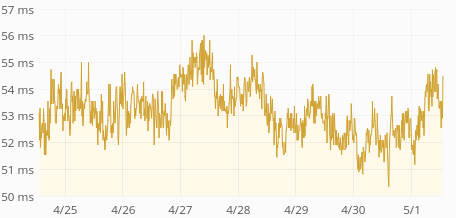
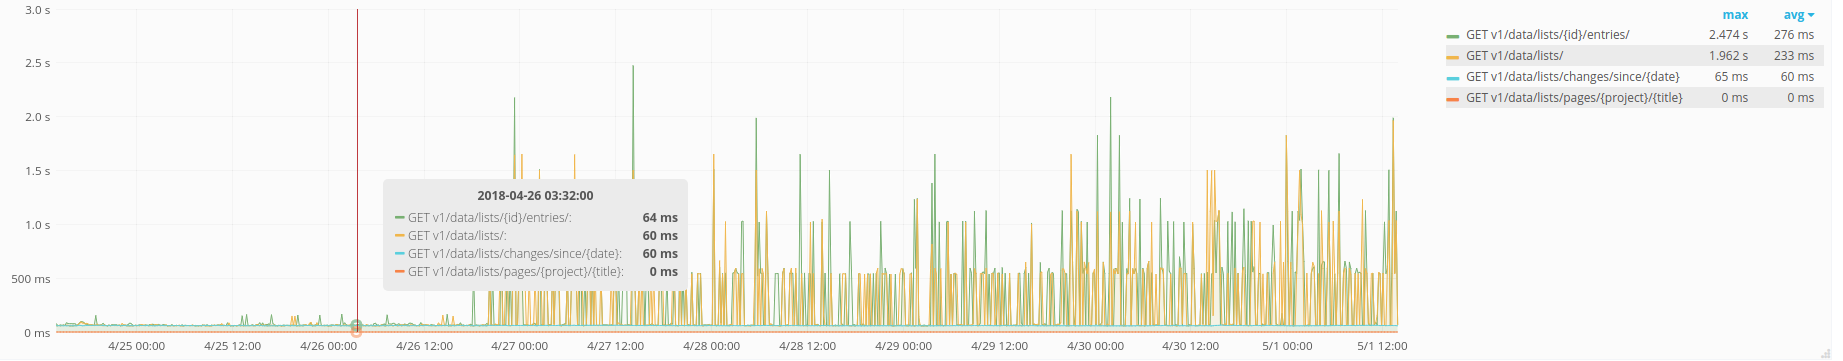
Action API logs claim almost all request finish well under 50ms, but might be inaccurate due to T193484: API request time logs should happen after DB commit.

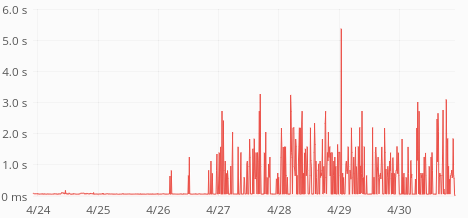
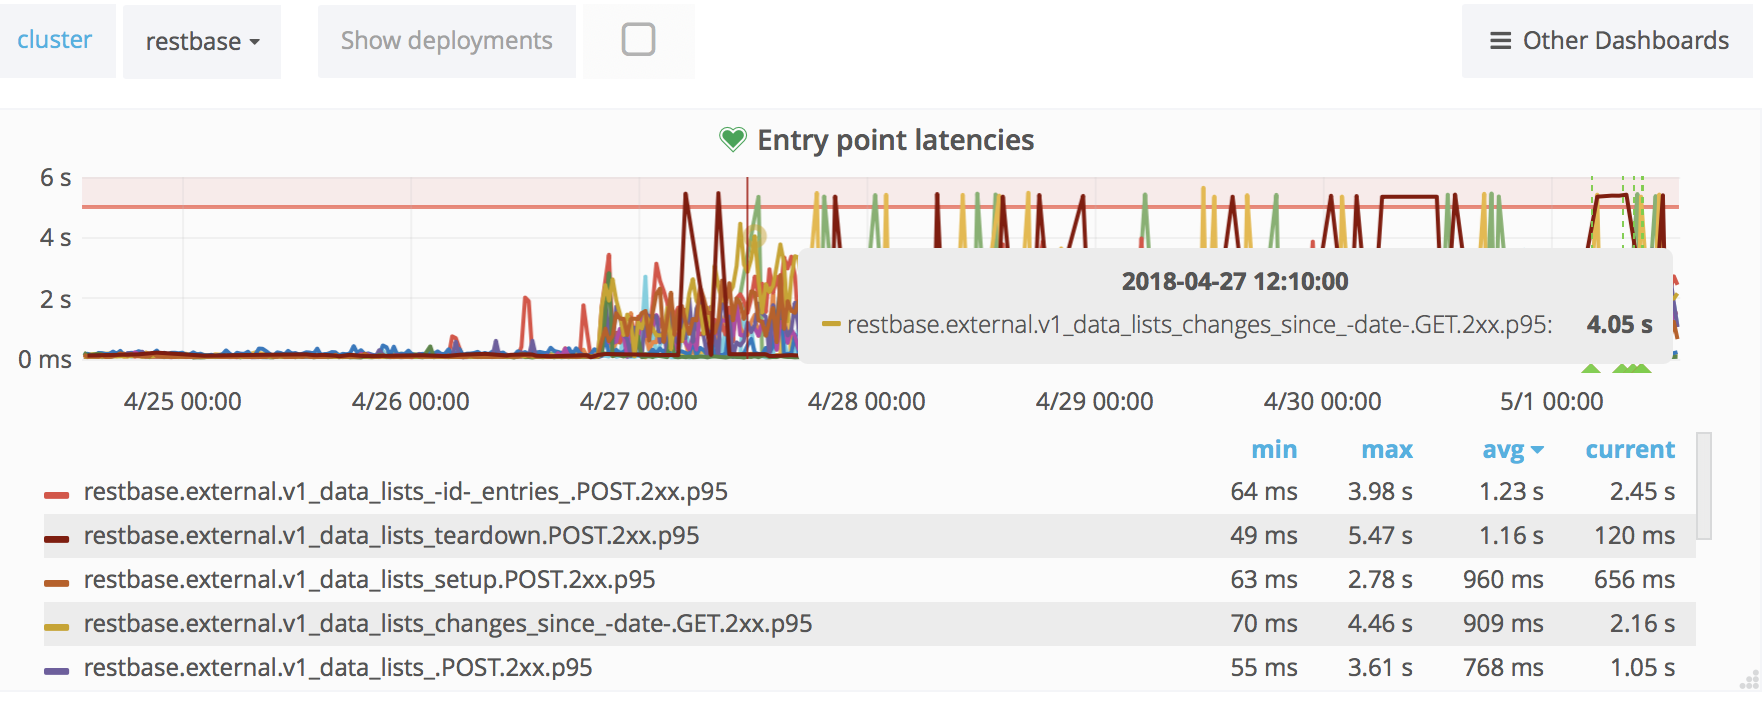
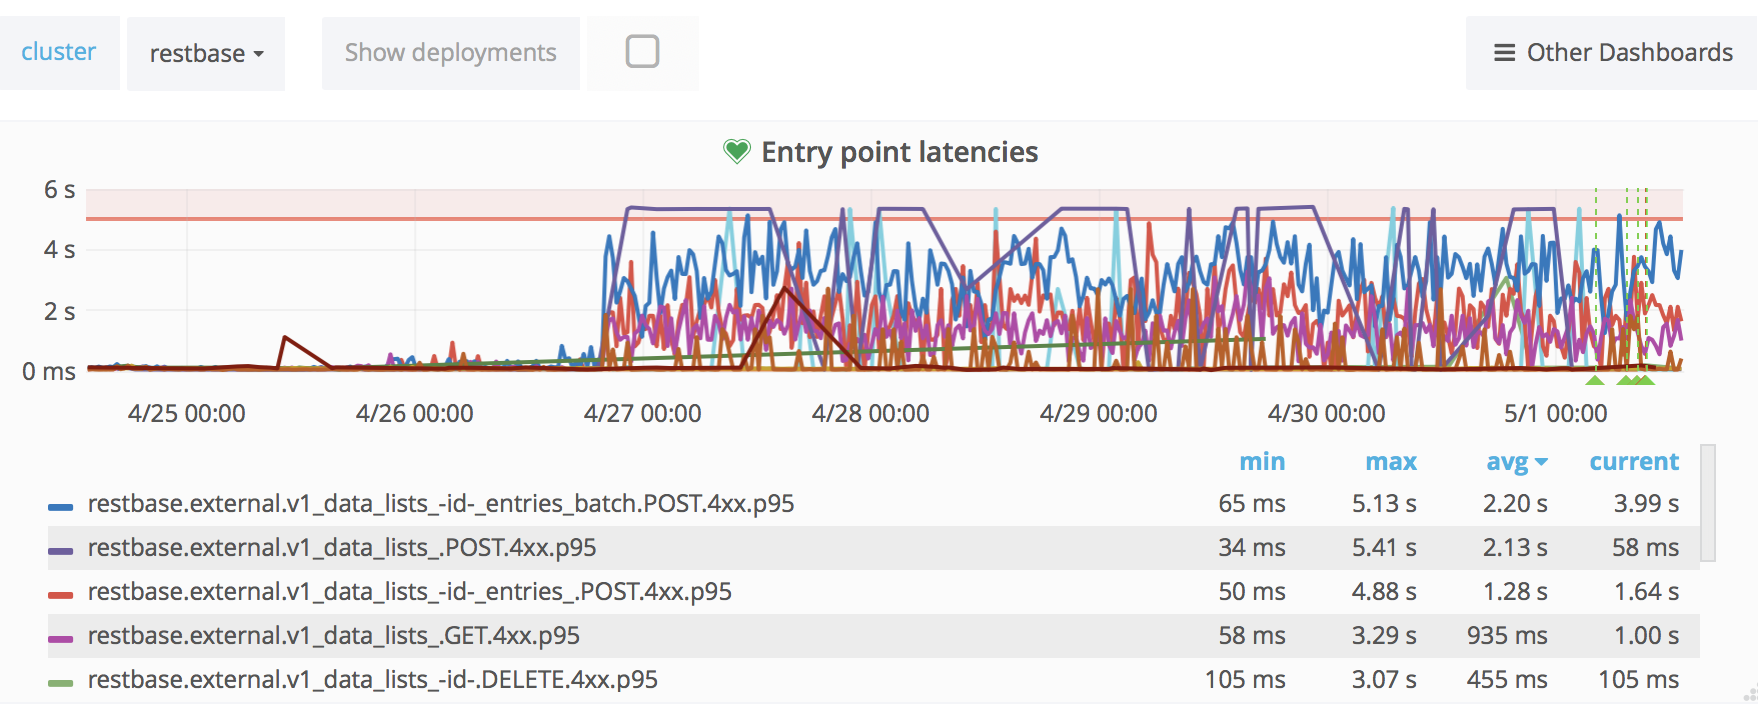
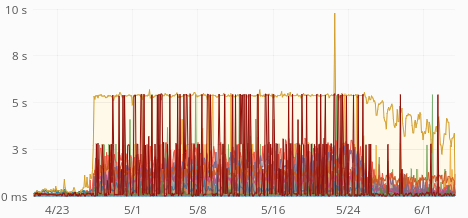
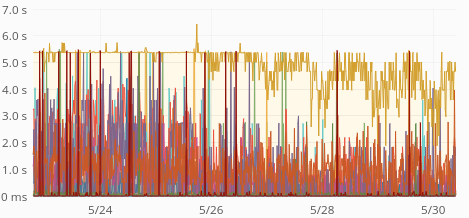
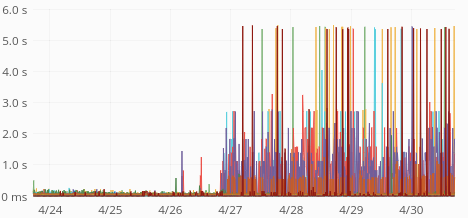
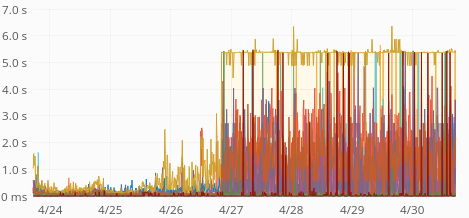
The time increase seems to be happening in increments of 500ms, with a ceiling of 5s:

GET request times, p75GET request times, p95
readinglists-dashboard-p75.png (361×1 px, 155 KB)
readinglists-dashboard-p95.png (376×1 px, 220 KB)

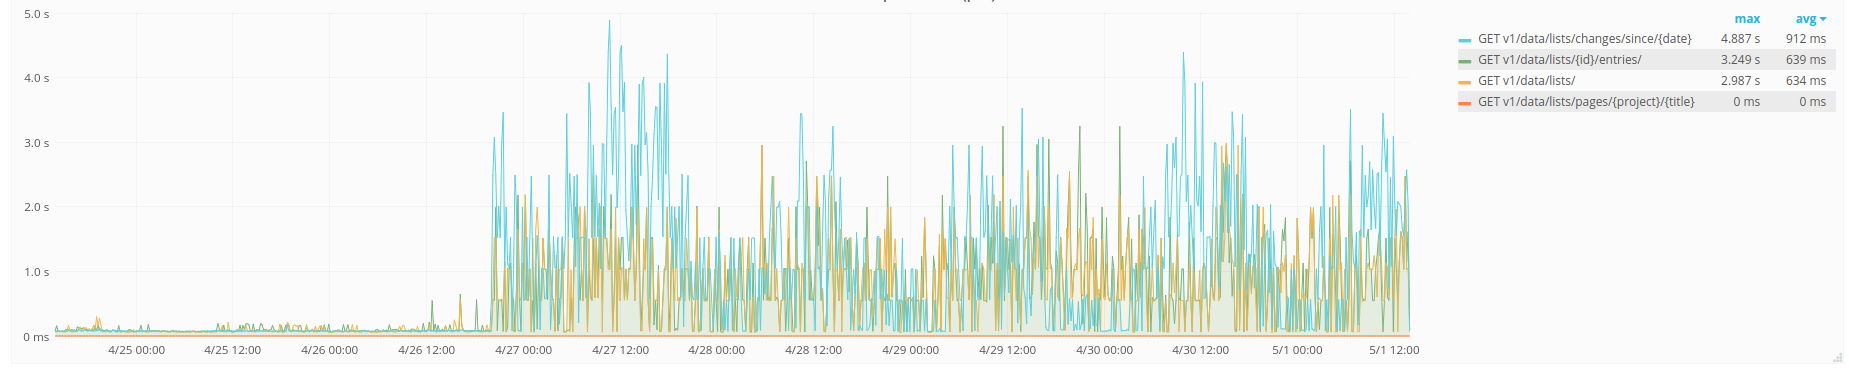
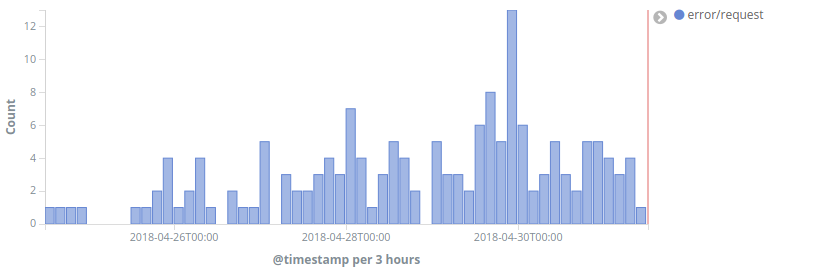
That suggest some operation times out and is retried 10 times. There are no timeout (or other) errors though and none of the requests seem to be failing.

Event Timeline

Most of the change is from the sync endpoint producing lotsof 5s responses, but the others also show slower responses, event though their request count didn't really change.

GET /changes/since/...
number of callsmedian response timep99 response time
readinglists-changes_since-count.png (362×521 px, 74 KB)
readinglists-changes_since-median.png (218×456 px, 52 KB)
readinglists-changes_since-p99.png (218×469 px, 30 KB)
POST /lists
readinglists-post-lists-count.png (362×515 px, 125 KB)
readinglists-post_lists-median.png (218×468 px, 46 KB)
readinglists-post_lists-p99.png (218×469 px, 63 KB)
POST /lists/{id}/entries/
readinglists-post_list_entries-count.png (362×515 px, 118 KB)
readinglists-post-lists-median.png (218×468 px, 47 KB)
readinglists-post-lists-p99.png (218×469 px, 69 KB)

@Fjalapeno have not had the time to do much useful about this, will continue tomorrow. At a glance though, times on the MediaWiki side (as reported by ApiAction) don't seem long.

Queried MW backend times from ApiAction with

select day, params['action'], params['command'], !params['list'], !params['meta'], avg(timeSpentBackend) from ApiAction where year = 2018 and month = 4 and day >= 20 and (params['action'] = 'readinglists' or params['meta'] = 'readinglists' or params['list'] = 'readinglistentries') group by day, params['action'], params['command'], !params['list'], !params['meta'];

(results and some stats here); those are suspiciously fast (20-40ms), not sure how much that can be trusted.

@mobrovac @Pchelolo does RESTBase log anything that I could use to cross-correlate MW API request durations?

@Dbrant @JoeWalsh did you notice anything strange or any error reports from users? Most sync requests result in a 4xx error, but with T192896: Frequent client-side errors for reading list service and lack of more detailed logging of those kinds of errors ATM (T189360) it's hard to tell if that's normal or not.

Another ApiAction query with p99 times:

select day, case when params['list'] is not null then 'readinglists' when params['meta'] is not null then 'readinglistentries' else params['command'] end action, hadError, avg(timeSpentBackend) avg_time, percentile_approx(timeSpentBackend, 0.99) p99_time from ApiAction where year = 2018 and month = 4 and day >= 20 and (params['action'] = 'readinglists' or params['meta'] = 'readinglists' or params['list'] = 'readinglistentries') group by day, case when params['list'] is not null then 'readinglists' when params['meta'] is not null then 'readinglistentries' else params['command'] end, hadError

(added to the same sheet)

The processing times are tiny and don't change over time. Either the ApiAction numbers are completely wrong or the delays are after the API has generated the response. The API logs these times before committing the open DB transaction, so maybe that's where the delays happen.

with T192896: Frequent client-side errors for reading list service and lack of more detailed logging of those kinds of errors ATM (T189360) it's hard to tell if that's normal or not.

Breakdown is in T192896#4170798, seems all normal (unless ApiAction does not log certain errors at all... RESTBase statsd logs say approx. 200K successful requests and 165K 4xx errors since the 27th, ApiAction logs say 700K successful requests and 560K 4xx errors, which both give a ~40% error rate, so while statsd sampling probably changes the request counts somehow, it doesn't seem like a large class of failed requests are missing from one or the other log.)

(Also, looks like T189360 was fixed already, cool!)

There are a few 504 errors from MediaWiki but not too many (260 for the last few days), and they seem to correlate with the sync request count but not with the sudden jump in response times: https://logstash.wikimedia.org/goto/8009262e31d5a1a6eb6a520125a8c292

Sync (/data/lists/changed/since/...) stats for the last 7 days (choosing sync as it's about 80% of total ReadingLists traffic):

sync request count, 2xxsync request count, 4xxsync response time, mediansync response time, p99504 response count
readinglists-sync-error-count.png (362×491 px, 66 KB)
readinglists-successful-sync-count.png (362×521 px, 76 KB)
readinglitsts-sync-time-median.png (218×456 px, 53 KB)
readinglitsts-sync-time-p99.png (218×469 px, 31 KB)
readinglists-504-errors.png (276×821 px, 22 KB)

@mobrovac @Pchelolo does RESTBase log anything that I could use to cross-correlate MW API request durations?

We do log slow requests with a 1% probability, and it's not per-request type, but across the board. There is a couple of log entries for reading lists here: https://logstash.wikimedia.org/goto/6a66a622663f986a90221b0f8d35fadf

Also, playing with latencies dashboard on RESTBase level, we have the ability to separate latencies by response code and I can see the same degradation for 2xx as for 4xx:

2XX Responses:

Screen Shot 2018-05-01 at 10.26.23 AM.png (714×1 px, 286 KB)

4xx Responses:

Screen Shot 2018-05-01 at 10.26.51 AM.png (714×1 px, 455 KB)

3xx and 5xx are negligible in rate, so no way to properly say whether their latencies changed or not.

Thanks @Pchelolo, that doesn't really tell me anything about where the time is spent though. What I would like to confirm is that only a trivial amount of time is spent on the RESTBase side and it's the action API subrequest that's slow.

@Tgr we don't have stats JUST for the Action API request itself, but we do have stats for calls to the action.js module. Since it's such a thin wrapper over a pure request to the Action API, an since for reading lists we only use rawquery that is even thinner, I guess the stats for restbase.external.sys_action_rawquery.ALL.ALL.p95 woul be a decent representation of the actual latencies we see in requests from RESTBase to Action API:

Screen Shot 2018-05-01 at 10.31.42 AM.png (762×1 px, 424 KB)

One thing that jumps out is that the long requests typically take some multiple of 500ms to finish:

GET request times, p75GET request times, p95
readinglists-dashboard-p75.png (361×1 px, 155 KB)
readinglists-dashboard-p95.png (376×1 px, 220 KB)

That suggests something times out and gets retried but I have no idea what that something might be.

That suggests something times out and gets retried but I have no idea what that something might be.

The RESTBase -> Action API the connect timeout is 5s and request timeout is 2 minutes, so it's not initiated by RESTBase.

GET and POST queries show the same pattern of behavior, so it probably is not related to the bug above or to transaction commit times:

restbase-rawquery.png (407×1 px, 193 KB)

Tgr updated the task description. (Show Details)

FWIW I don't believe we've seen any direct user complaints about slowdowns or breakage of syncing...

Response times have been slowly improving since May 25 or so, but still way worse than in the past:

medianp99
grafana.wikimedia.org_dashboard_db_reading-list-service_refresh=5m&orgId=1&from=now-45d&to=now (1).png (218×468 px, 146 KB)
grafana.wikimedia.org_dashboard_db_reading-list-service_refresh=5m&orgId=1&from=now-45d&to=now.png (218×468 px, 103 KB)

Possibly coordinated with getting rid of the invalid domain names, might be coincidental though:

median response times
grafana.wikimedia.org_dashboard_db_reading-list-service_orgId=1&from=1527015202000&to=1527674002620 (1).png (218×469 px, 156 KB)
non-batch list entry creation count
grafana.wikimedia.org_dashboard_db_reading-list-service_orgId=1&from=1527015202000&to=1527674002620.png (362×528 px, 90 KB)
Tgr reassigned this task from Tgr to aaron.
Tgr added a subscriber: aaron.

After T190082#4277676, load times now seem to be back to their original levels. Thanks @aaron!

Vvjjkkii renamed this task from ReadingLists performance degradation to mydaaaaaaa.Jul 1 2018, 1:12 AM
Vvjjkkii reopened this task as Open.
Vvjjkkii removed aaron as the assignee of this task.
Vvjjkkii triaged this task as High priority.
Vvjjkkii updated the task description. (Show Details)
Vvjjkkii removed a subscriber: Aklapper.
bearND renamed this task from mydaaaaaaa to ReadingLists performance degradation.Jul 1 2018, 4:34 AM
bearND closed this task as Resolved.
bearND assigned this task to aaron.
bearND raised the priority of this task from High to Needs Triage.
bearND updated the task description. (Show Details)
bearND added a subscriber: Aklapper.