Page MenuHomePhabricator

Analyze effect of huwiki FlaggedRevs configuration change on problematic edits and new user retention
Closed, ResolvedPublic

Description

On 2018-04-09 FlaggedRevs on Hungarian Wikipedia was reconfigured: before, articles were displayed to readers in their last reviewed version, afterwards articles were always shown in their latest version and FlaggedRevs was only used to coordinate patrolling activity. Now that the test period for the change is over, we need to evaluate the effect and decide whether to keep the change.

The main questions to answer:

  • did the ratio of problematic edits increase after the change?
  • was new editor retention affected?

The secondary question would be to quantify how often readers saw bad changes due to the new configuration, and how often they didn't see new changes due to the old configuration.

You can find the analysis here.
Event Timeline

@Tgr: Who to analyze this?

The huwiki community (help is of course welcome if anyone is interested :).

Registrations:

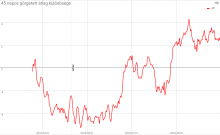
new registrations, dailyrunning average, 45 daysdiff in running average
new regs.png (627×1 px, 199 KB)
new regs rolling.png (633×1 px, 71 KB)
diff in new regs rolling.png (632×1 px, 51 KB)

(with apologies to everyone who actually knows how to do statistics)

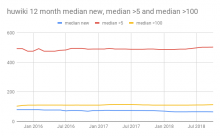
The 12 month running median is very stable for huwiki. There slight increase in monthly >5 trend after configuration change but in other ways it is almost flat.

huwiki 12 month median new, median _5 and median _100.png (371×600 px, 11 KB)

Source

@Halfak said he has some ideas for this (thanks!)

One thing I would like to do here is an analysis of the number of vandal edits (as estimated by ORES), but I'd like to have more confidence in ORES prediction quality first.

I would like to understand what i am actually looking here: (ie in one year huwiki's "active anonymous editors" editing level raised to same level than in fiwiki. Before that they were editing with accounts and now they are making edits without logging in?

https://stats.wikimedia.org/v2/#/hu.wikipedia.org/contributing/active-editors/normal|line|all|editor_type~anonymous*group-bot*name-bot*user|monthly

I'd expect a drop in active logged-in editors in that case, so this does seems like a real increase in contributors. OTOH if you look at editors (https://stats.wikimedia.org/v2/#/hu.wikipedia.org/contributing/editors/normal|line|all|editor_type~anonymous*user|monthly|editors - "active editor" means 5+ edits last month in the wikistats vocabulary, "editor" means 1+ edits last month), they have started growing significantly sooner (although there seems to be an uptick when flagrev was disabled? hard to tell by the naked eye), so there seems to be something else going on there and it's not obvious to what extent is the flagrev switch the cause.

That said I would be mainly interested in changes to the number of new users (more anon edits is not trivially a good thing, although ORES might help in better evaluating it), which shows no obvious change, but new registrations tend to be dominated by users who never edit (and probably never meant to edit in the first place) and that might drown out the signal so we probably need some filtering there to get a meaningful graph.

I updated the flagged revs reviews stats graphs and fiwiki as reference.

Note for fiwiki bot reviews arent filttered out and ~10% of manual reviews of 2018-> are actually made by SeulojaBot (based on ORES and other rules)

(Note to self because someone asked and I had to search for it: the original enabling was in 2009 June 2008 Nov: T17568#198689.)

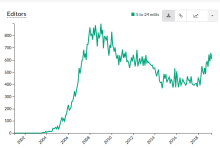
Users with 5-24 edits are up too, that's encouraging (unless that stat somehow includes anons): https://stats.wikimedia.org/v2/#/hu.wikipedia.org/contributing/editors/normal|line|all|activity_level~5..24-edits|monthly

huwiki editors with 5-24 edits.png (481×715 px, 32 KB)

I checked the registration year of users with 5/25+ edits in the last 30 days to get an estimate of how much these new editors are converted into long-term productive editors (5+, 25+) but didn't see any clear trend. (The numbers are too small and noisy for a graph to be useful.)

I started to prepare a page with a statistical analysis here (in Hungarian only, yet, but mainly with easy to understand figures):
https://hu.wikipedia.org/wiki/Wikip%C3%A9dia:Jel%C3%B6lt_lapv%C3%A1ltozatok/Statisztik%C3%A1k
I will fill up with the main conclusions in the following days (most of them are obvious from the graphs anyway).

@Samat Is there any comments from community to the results?

@Zache not really yet...

Additionally to the editor&edit numbers, we tried to analyze the vandal/damaging ratio inside the increased number of casual and anon editors in order to have a better picture, but the results are not clear (based on the old ORES judging). We are waiting for the ORES update (T228078), hoping it gives us more information about this aspect of the change.

After that, I will try to close the open issue with a community vote.

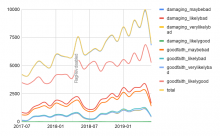
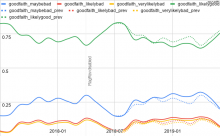
Here are the ORES stats:

totalsdamaging ratiogoodfaith ratio
anon edits
huwiki flagrev ores absolute.png (371×600 px, 39 KB)
huwiki flagrev ores damaging.png (371×600 px, 27 KB)
huwiki flagrev ores goodfaith.png (371×600 px, 31 KB)
sourcesourcesource
non-anon edits
huwiki flagrev ores non-anon absolute.png (371×600 px, 33 KB)
huwiki flagrev ores non-anon damaging.png (371×600 px, 14 KB)
huwiki flagrev ores non-anon goodfaith.png (371×600 px, 17 KB)
sourcesourcesource

(Non-anon edits only show maybebad ratios due to huge scale differences, the source has the rest. Dotted lines show the data from previous year.)

In short:

  • ~33% increase in number of anon edits
  • no change in number of non-anon edits
  • slight increase in ratio of bad anon edits (e.g. goodfaith/likelybad up from ~11% to ~13%, damaging/likelybad up from ~32% to ~35% - those two are roughly the same ratio as our anecdotal estimates of vandalism and edits needing fixup, respectively)
  • a similar increase in the ratio of bad non-anon edits, surprisingly
  • for anon edits, total impact on patrollers (from more anon edits + more frequent bad anon edits) is something like 500 vandal edits, 800 well-intentioned problematic edits monthly
  • conversely, useful anonymous edits have increased by about 2000 per month

I checked the registration year of users with 5/25+ edits in the last 30 days to get an estimate of how much these new editors are converted into long-term productive editors (5+, 25+) but didn't see any clear trend. (The numbers are too small and noisy for a graph to be useful.)

Quarterly numbers graph more nicely:

5+25+
distribution-of-registration-time-for-users-with-5-edits-huwiki.png (371×600 px, 18 KB)
distribution-of-registration-time-for-users-with-25-edits-huwiki.png (371×600 px, 21 KB)
sourcesource

So no significant change. (The big spike is in 2018 February, well before the config change, and seems to have something to do with a large number of global bots being registered, probably due to some SUL-related change. The spike at the very end is an artifact of the metric - there are many more freshly registered 5+ editors than 5+ editors who have survived multiple months.)

Users with 5-24 edits are up too, that's encouraging (unless that stat somehow includes anons): https://stats.wikimedia.org/v2/#/hu.wikipedia.org/contributing/editors/normal|line|all|activity_level~5..24-edits|monthly

It does include anons, confusingly: https://meta.wikimedia.org/wiki/Research_talk:Wikistats_metrics/Editors
So either the FlagRev change significantly increased the number of anons who return regularly to make edits (as much as 25+ per month), or, more plausibly, this is an artifact of shared IPs (not really used in Hungary for residential internet connections I think, but could be school/workplace IPs).

Number of registrations per month where the user reached a certain number of edits within 30 days (a proxy for productive new editors - we know new editors who make a larger number of edit in their first month are much more likely to become long-term editors):

5+25+100+
Number of registrations followed by 5+ edits within a month.png (371×600 px, 54 KB)
Number of registrations followed by 25+ edits within a month.png (371×600 px, 61 KB)
Number of registrations followed by 100+ edits within a month.png (371×600 px, 63 KB)
sourcesourcesource

(trendlines are for 12 months, dotted lines / thin trendlines are same curve shifted by 12 months)

Again no obvious effect (although given the noisyness of the data it would have to be a very large effect to jump out in the graph).

Tgr claimed this task.

The main questions to answer:

  • did the ratio of problematic edits increase after the change?

Yes, but very little. (The number of problematic edits did increase, though, since we have a lot more anonymous edits now.)
Interestingly for non-anonymous edits the increase was much larger, but those edits are far too few in absolute numbers to matter.

  • was new editor retention affected?

As far as we can tell, not at all.

This concludes the analysis (although I'd still be interested in what other statistics would be worth looking at).

One note I want to make is about patroller workload. When considering how much work a patroller needs to do, the % of vandalism is kind of irrelevant. We should instead look at the number of edits that need to be reviewed in order to catch most of the vandalism. Without something like ORES in place, this is really just a factor of the total number of edits. With ORES in place, this would be the % of edits that cross some useful threshold of "probability" of damaging. E.g. https://ores.wikimedia.org/v3/scores/huwiki/?models=damaging&model_info=statistics.thresholds.true."maximum%20filter_rate%20@%20recall%20>=%200.90" suggests that any edit that scores above 0.061 should be reviewed and that using this threshold will reduce patrollers' overall workload by 92%. It looks like you're getting at this in your plots from T209224#5493029. It would be nice to see that as a raw number. I can help run a statistical test to see if the differences we see are significant.

I need p -- the proportion of edits that would be flagged as needing review before and after the change and N the total number of edits before and after the change. If it's a pain to apply the threshold I came up with, the "May have problems" threshold is pretty close to what I have in mind.

... We should instead look at the number of edits that need to be reviewed in order to catch most of the vandalism. Without something like ORES in place, this is really just a factor of the total number of edits. ...

With flaggedrevs this is balanced via autoreview user right. Generally, most of edits from the regular users are autoreviewed anyway so their edits should be excluded from the effect.

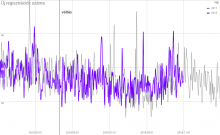
Well, we can just count the number of reviews directly: https://quarry.wmflabs.org/query/39245

chart.png (371×600 px, 22 KB)

Just by eyeballing there seems to have been an ~50% growth, but the chart is noisy enough that it's hard to say whether that's a trend or just random fluctuation.
(Reviews only happen on good edits, so the number of reverts is the other half of the story, but that's harder to get.)

One thing to check would how the change affected the review workload and review backlog. Ie was there effect on the number of reviewers and how reviews per the reviewer are distributed between users.