Description
Description
Details
Details
| Subject | Repo | Branch | Lines +/- | |
|---|---|---|---|---|
| Performance: Language dropdown menu should be hidden when ULS is enabled | mediawiki/skins/Vector | master | +27 -0 |
Related Objects
Related Objects
Event Timeline
Comment Actions
I could see this both with our WebPageReplay tests and our direct tests. When I compared the HAR file nothing stands out except that the https://ca.wikipedia.org/w/load.php?lang=ca&modules=startup&only=scripts&raw=1&skin=vector-2022 has changed and that we got a longer CPU long tasks before first paint with the new changes.
Looking at the data in Prometheus just for group 1 gives me to unstable data to actually say anything.
Comment Actions


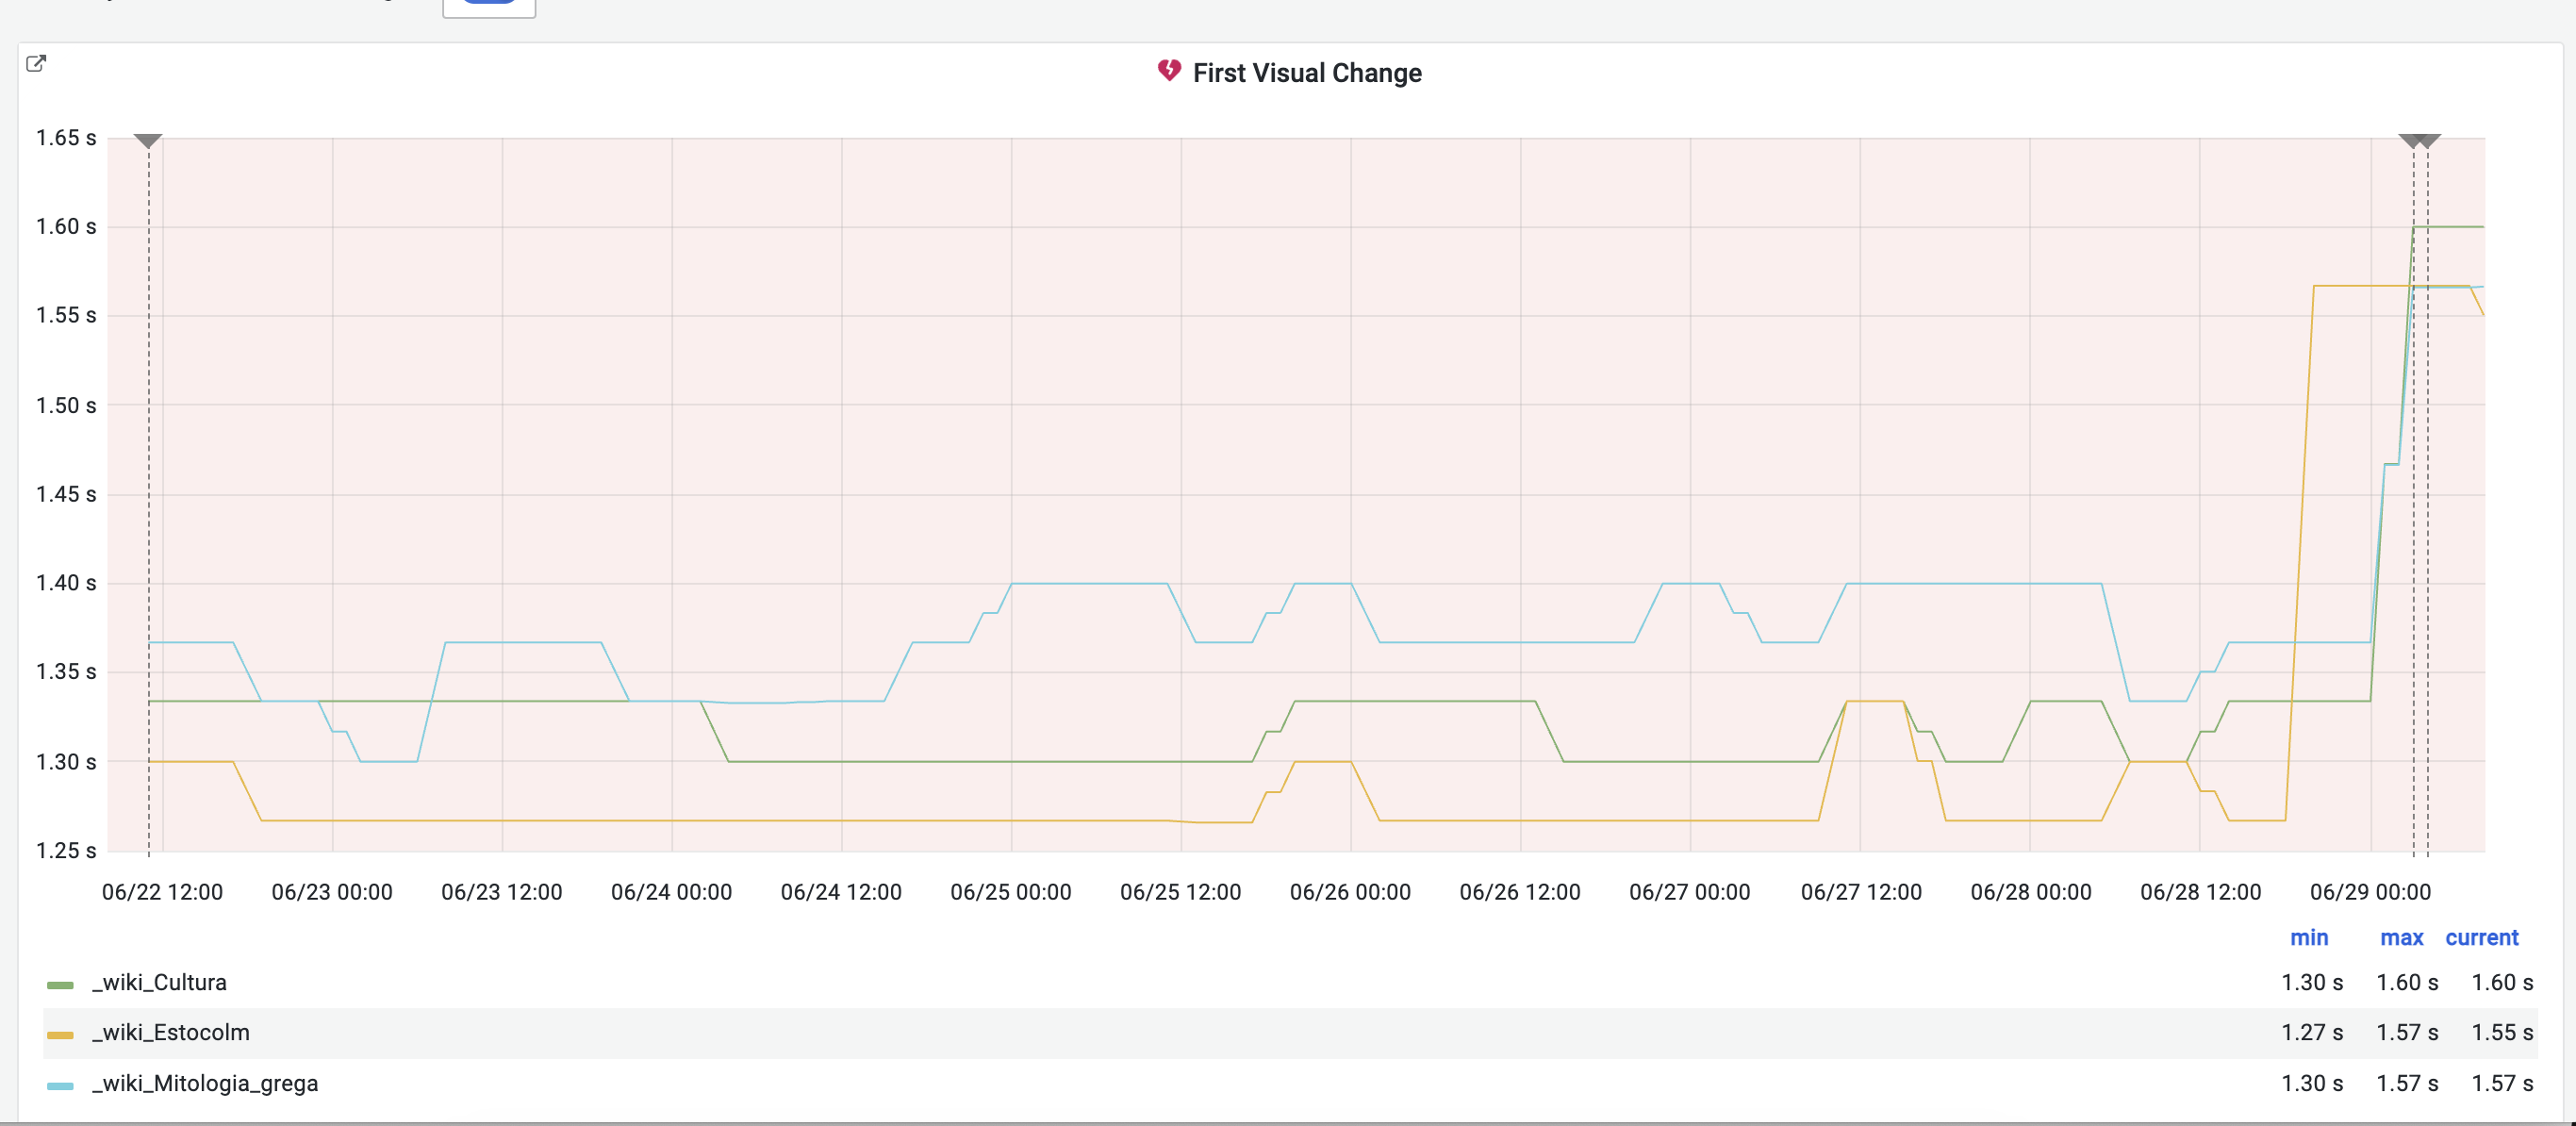
This is also visible in the metrics from our real users looking at p75 for all users on desktop for first paint. Green is the current value, yellow is what it looks like one week back, they usually match pretty good:
https://grafana.wikimedia.org/d/000000038/navigation-timing-by-platform?orgId=1&var-metric=firstPaint&var-platform=desktop&var-users=anonymous&var-percentile=All&from=now-7d&to=now&viewPanel=30
This also visible when I look at the median:
Also the synthetic tests fired on en.wiki when the changes where made there.
Comment Actions

It's also affecting largest content full paint. In this graph we can see the amount of traffic that have better Largest Contentful Paint than 4 seconds (the Google limit for bad performance).
We can see that the amount there is about one percent more of the traffic that we measure that not reaches that limit (have bad performance according to Google):
https://grafana.wikimedia.org/d/rum/real-user-monitoring?orgId=1&viewPanel=125
For the 2.5s limit "need improvement" it looks like this (something like a 1.3% drop):
Comment Actions

Attached to traces that we can drag/drop into Chrome devtools performance tab. I can see that the latest trace after the regression touches more elements in the Recalculate style and Layout phase (the layout phase is longer) but we don't get any deeper info than that, I wonder maybe there's a way to configure Chrome to get more info.
Before the change:
After:
Traces:
Comment Actions
The HAR files have the content of the HTML/JS so I can make a diff, or if someone else maybe knows what could have caused it: https://www.mediawiki.org/wiki/MediaWiki_1.41/wmf.15
Comment Actions
I did quick check and couldn't see any obvious things in the diffs. I'll sign off the task for now (got vacation first three days next week) but I'll check in and see if I can help in any way.
Comment Actions
There were a number of patches related to the media work I'm doing (search Arlo on https://www.mediawiki.org/wiki/MediaWiki_1.41/wmf.15) but that stuff isn't enabled on enwiki yet.
Comment Actions


Now when it's been a couple of days this is easy to spot on overall traffics. You can see that in following graph:
https://grafana.wikimedia.org/d/rum/real-user-monitoring?orgId=1&viewPanel=25
And attaching 50/75p/95p:
Comment Actions
It's also pretty cool that we can see this in the CPU longtasks that we are tracking:
https://grafana.wikimedia.org/d/rum/real-user-monitoring?orgId=1&viewPanel=135
What we can see here, is that we have 3% decrease of our users that has long tasks faster than 1 second.
These also affects loadEventEnd so we have those alerts firing.
Comment Actions
Moving to sprint for further investigation. We shouldn't spend more than half a day trying to collect as much information about this issue as possible to help us narrow down what the cause might be.
Comment Actions
I deployed a config change on June 29 that effects a relevant code path, though I don't see how it would cause this: https://gerrit.wikimedia.org/r/c/operations/mediawiki-config/+/933453.
The change should only affect job runner load.
Comment Actions
The graph matches last deployment of MediaWiki 1.41.0-wmf.15 to all wikis
06/29th
18:16 <brennen@deploy1002> rebuilt and synchronized wikiversions files: group2 wikis to 1.41.0-wmf.15 refs T340243
Comment Actions
I pulled down an old version of the Estocolm article using Wayback machine from May https://web.archive.org/web/20230519031646/https://ca.wikipedia.org/wiki/Estocolm and compared it with July and the number of DOM nodes is in the same magnitude so I don't think it relates to number of DOM nodes.
@Arlolra pointed out an interesting theory - previously language list was "display: none" and is now "visibility: hidden" - that might explain a significant rendering change on page load. I introduced some CSS to test his hypothesis: https://ca.wikipedia.org/wiki/MediaWiki:Vector-2022.css but I'm not sure how instant we'd expect a result here (and doesn't seem to be any change in the graph so far).
Comment Actions
I expanded the templates of that ca:Estocolm page and then added the resulting wikitext to a local wiki. Then I artificially added some languages to,
https://github.com/wikimedia/mediawiki/blob/master/includes/skins/Skin.php#L1187 so that the selector had a similar count of around ~230.
Then clearly reverting the following patch accounts for the difference in the number of nodes in the trace at T340715#8980086,
https://gerrit.wikimedia.org/r/c/mediawiki/skins/Vector/+/931998/2/resources/skins.vector.styles/components/LanguageDropdown.less
Comment Actions
Change 936302 had a related patch set uploaded (by Jdlrobson; author: Jdlrobson):
[mediawiki/skins/Vector@master] Performance: Language dropdown menu should be hidden when ULS is enabled
Comment Actions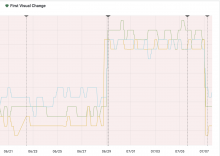
The change in https://ca.wikipedia.org/wiki/MediaWiki:Vector-2022.css has led to the graph restoring itself! So I think we can safely conclude that @Arlolra's theory is correct here (nice!):

The change in https://gerrit.wikimedia.org/r/c/mediawiki/skins/Vector/+/931998/ made the language dropdown visibility: hidden - which had implications on layout. The above patch should fix this.
Comment Actions
Change 936302 merged by jenkins-bot:
[mediawiki/skins/Vector@master] Performance: Language dropdown menu should be hidden when ULS is enabled
Comment Actions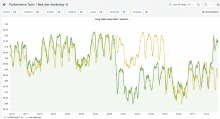
The graphs are all looking good to me. @Peter feel free to reopen if anything still looks off.
Long graphs for example at:
