Following up from T315510#9314495:
- Try to reproduce locally
- Set up https://github.com/arnaud-lb/php-memory-profiler and see what's hogging all the memory
- Try to make sense of the results
| matmarex | |
| Nov 21 2023, 3:38 PM |
| F41721518: pprof-flamegraph.png | |
| Jan 27 2024, 3:52 AM |
| F41721517: pprof-flamegraph.svg | |
| Jan 27 2024, 3:52 AM |
| F41721451: pprof-flamegraph.png | |
| Jan 27 2024, 3:29 AM |
| F41721450: pprof-flamegraph.svg | |
| Jan 27 2024, 3:29 AM |
| F41721349: pprof.png | |
| Jan 27 2024, 3:12 AM |
| F41721348: pprof-flamegraph.png | |
| Jan 27 2024, 3:12 AM |
| F41721346: pprof.svg | |
| Jan 27 2024, 3:12 AM |
| F41721347: pprof-flamegraph.svg | |
| Jan 27 2024, 3:12 AM |
Following up from T315510#9314495:
| Status | Subtype | Assigned | Task | ||
|---|---|---|---|---|---|
| Open | None | T314973 Improve Topic Subscription support for discussions that are merged, moved, or deleted | |||
| Open | None | T315050 Enable people to visit the page the discussion they were subscribed to has been moved to | |||
| Open | None | T318449 [Tracking] Improve the sharing of MediaWiki content | |||
| Open | None | T318446 [Tracking] Improve sharing link functionality of pages | |||
| Open | None | T315507 Introduce support for topic and comment permanent links within the Android and iOS apps | |||
| Open | None | T349353 Expose comment/topic permanent links on Special:Contributions | |||
| Open | None | T265269 Assist with linking to other comments within the Reply Tool | |||
| Open | None | T302011 [Release Ticket] Introduce permalinks on wikitext talk pages | |||
| Open | matmarex | T315353 Create database tables for permalinks in production wikis, and enable the feature | |||
| Stalled | matmarex | T315510 Start maintenance script to backfill talk page comment database | |||
| Resolved | matmarex | T351732 Debug memory leak in maintenance script |
Change 993020 had a related patch set uploaded (by Bartosz Dziewoński; author: Bartosz Dziewoński):
[mediawiki/core@master] DeprecationHelper: Don't copy the info into every instance
I set up php-memory-profiler and instrumented the code as follows:
diff --git a/maintenance/persistRevisionThreadItems.php b/maintenance/persistRevisionThreadItems.php
index 61873715..0a59ca03 100644
--- a/maintenance/persistRevisionThreadItems.php
+++ b/maintenance/persistRevisionThreadItems.php
@@ -190,6 +190,10 @@ class PersistRevisionThreadItems extends Maintenance {
 		$duration = microtime( true ) - $start;
 		$durationFormatted = $this->lang->formatTimePeriod( $duration );
 		$this->output( "Finished in $durationFormatted\n" );
+
+		gc_collect_cycles();
+		memprof_dump_callgrind( fopen( "a.callgrind", "w" ) );
+		file_put_contents( "a.json", json_encode( memprof_dump_array() ) );
 	}

 	/**
@@ -208,6 +212,10 @@ class PersistRevisionThreadItems extends Maintenance {

 				// Store permalink data (even when store is disabled - T334258)
 				$changed = $this->itemStore->insertThreadItems( $rev, $threadItemSet );
+
+				if ( !memprof_enabled() ) {
+					memprof_enable();
+				}
 			}
 		} catch ( Throwable $e ) {
 			$this->output( "Error while processing revid=$row->rev_id, pageid=$row->rev_page\n" );
This should output the information about which functions allocated all of the memory after the 2nd iteration of the script (this should allow us to skip most of the data used by various initialization code) that is still live when the script finishes.
I got this:
Then I tried to make sense of the results in QCacheGrind.
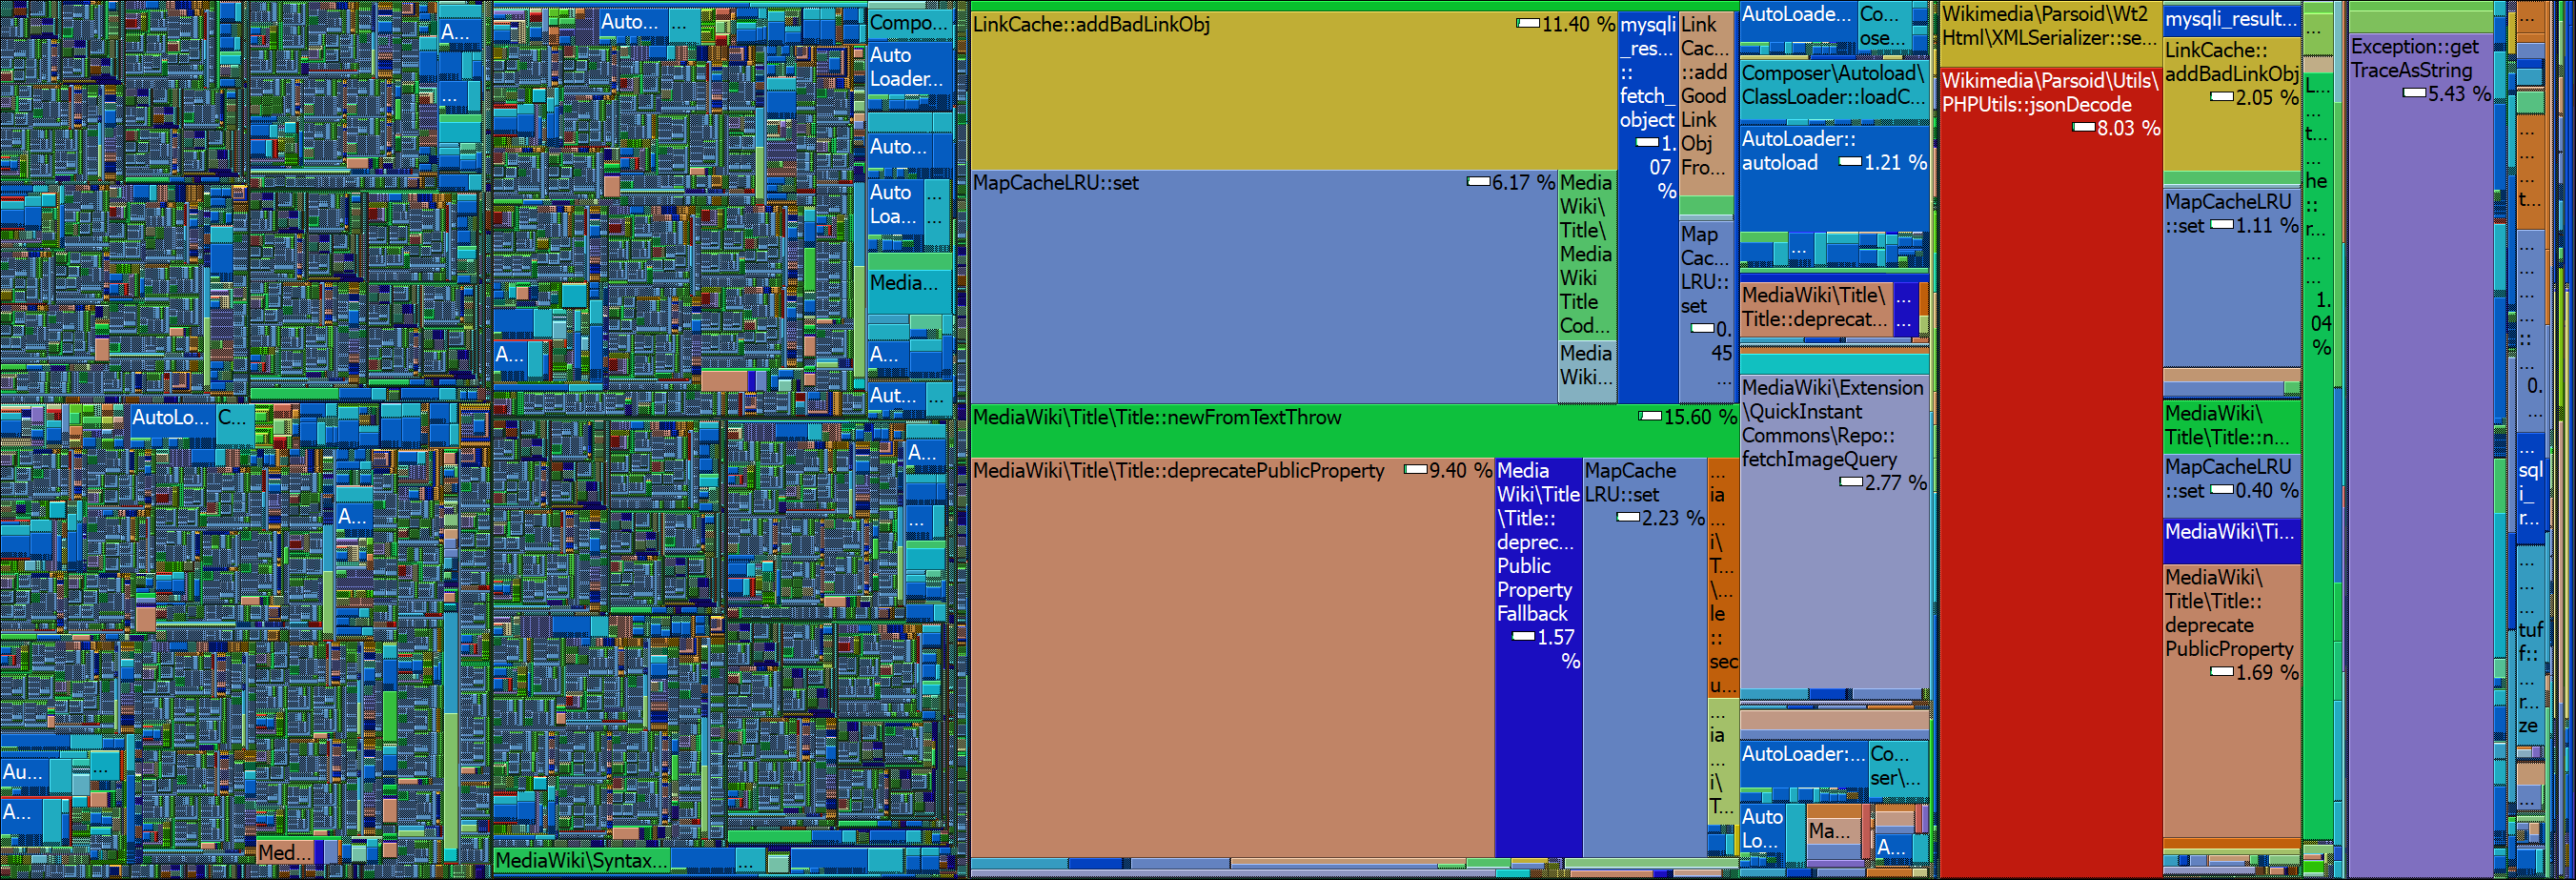
I also wrote myself a script to summarize the JSON output.
{
  "AutoLoader::autoload": 2803248,
  "MediaWiki\\Title\\Title::deprecatePublicProperty": 2353008,
  "MapCacheLRU::set": 2174224,
  "Composer\\Autoload\\ClassLoader::loadClass": 1544156,
  "Wikimedia\\Parsoid\\Utils\\PHPUtils::jsonDecode": 1405208,
  "LinkCache::addBadLinkObj": 956920,
  "Exception::getTraceAsString": 950272,
  "MediaWiki\\Extension\\QuickInstantCommons\\Repo::fetchImageQuery": 509896,
  "MediaWiki\\Title\\Title::newFromTextThrow": 443520,
  "MediaWiki\\Title\\Title::deprecatePublicPropertyFallback": 392168,
  "mysqli_result::fetch_object": 366264,
  "Preprocessor_Hash::buildDomTreeArrayFromText": 213560,
  "LocalisationCache::readPHPFile": 182288,
  "MediaWiki\\Extension\\Scribunto\\Engines\\LuaStandalone\\LuaStandaloneInterpreterFunction::incrementRefCount": 161688,
  "SqlBagOStuff::unserialize": 160080,
  "Preprocessor_Hash::preprocessToObj": 160064,
  "LinkCache::addGoodLinkObjFromRow": 147768,
  "array_flip": 132848,
  "MediaWiki\\Title\\MediaWikiTitleCodec::getPrefixedDBkey": 125584,
  "Wikimedia\\Parsoid\\Wt2Html\\XMLSerializer::serialize": 116328,
  "MediaWiki\\Extension\\CLDR\\LanguageNames::loadLanguage": 110496,
  "MediaWiki\\Title\\Title::secureAndSplit": 85768,
  "file_get_contents": 83680,
  "MediaWiki\\Extension\\ParserFunctions\\ParserFunctions::time": 78096,
  "Wikimedia\\CSS\\Grammar\\FunctionMatcher::__construct": 71688,
  "MediaWiki\\SyntaxHighlight\\Pygmentize::getLexers": 70936,
  "require /var/www/html/w/extensions/TimedMediaHandler/includes/TimedTextPage.php": 69704,
  "MapCacheLRU::setField": 67536,
  "MediaWiki\\Title\\MediaWikiTitleCodec::formatTitle": 66824,
  "DOMElement::getAttribute": 62688
}
I am not entirely sure what I'm looking at, to be honest. I think I understood some things, though:
I repeated the test after that patch, with expected results – MediaWiki\Title\Title::deprecatePublicProperty no longer features prominently:
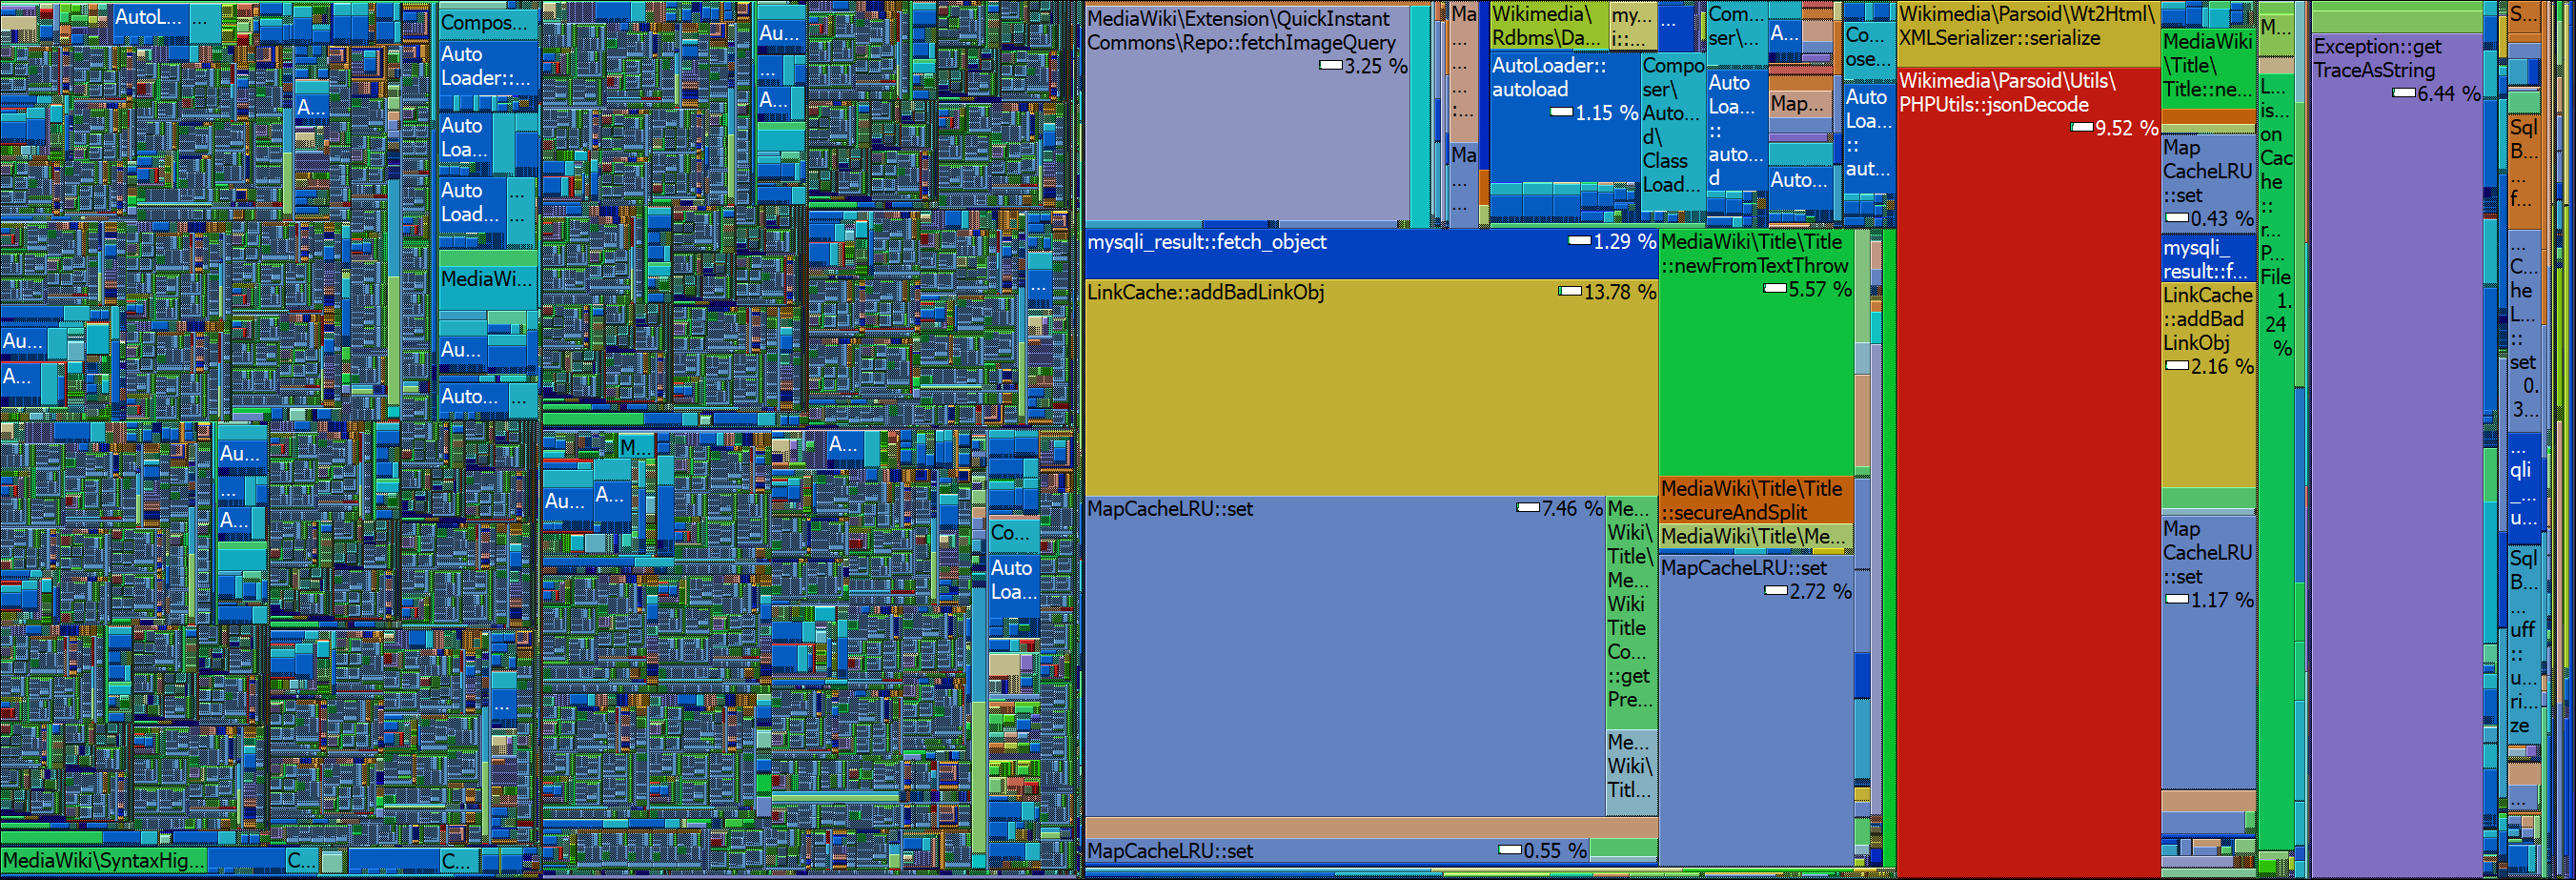
To be continued, I guess…
So basically there are three problems with these visualizations:
I didn't quite solve them, but I think I solved 95% of them, and I feel like now we're getting somewhere:
I now have these instrumentation hacks:
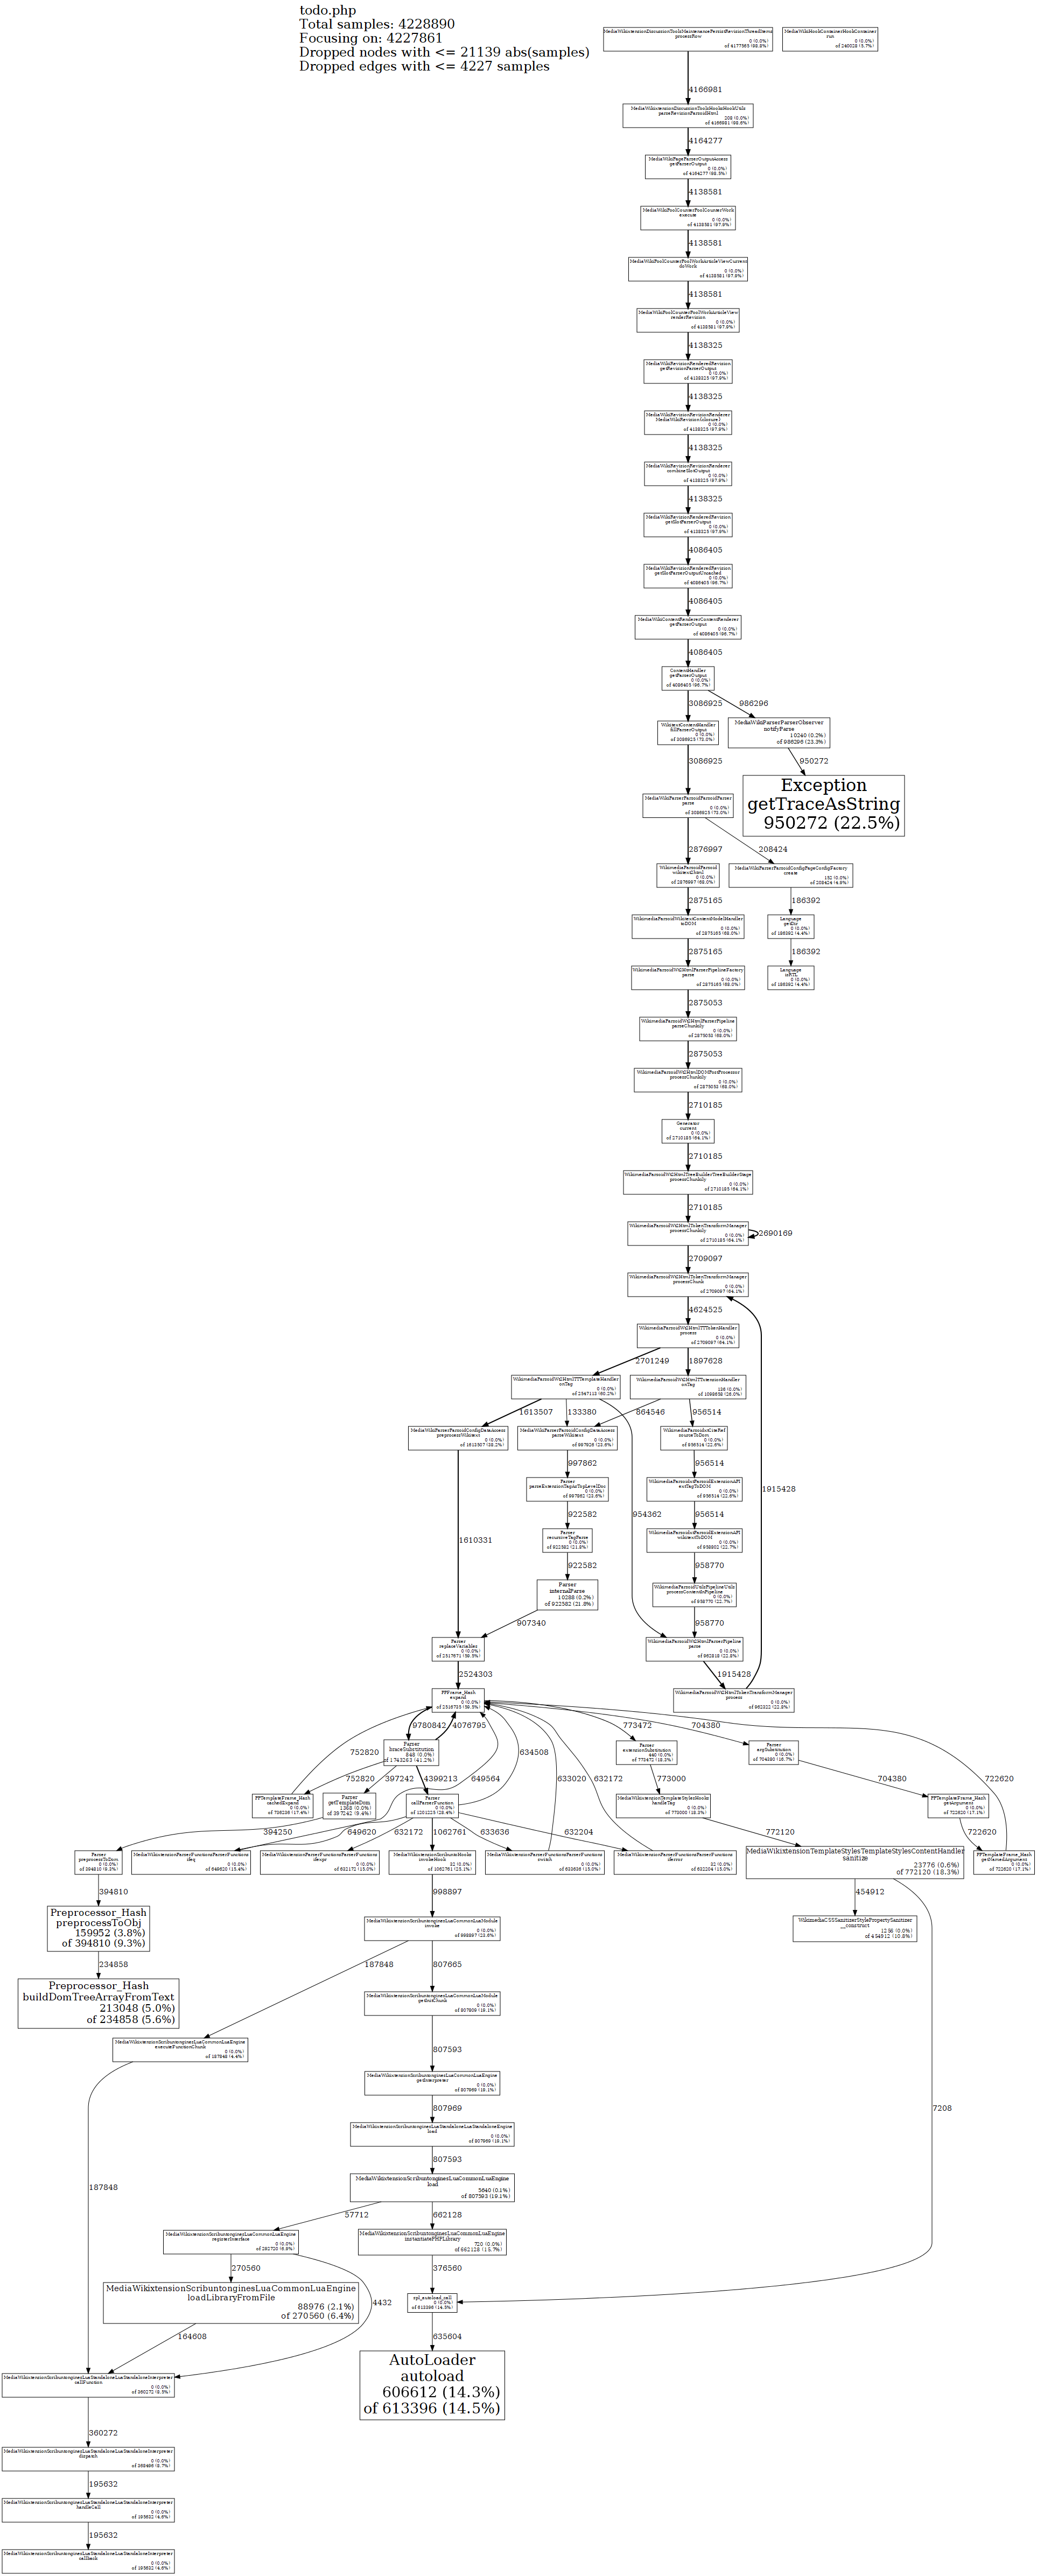
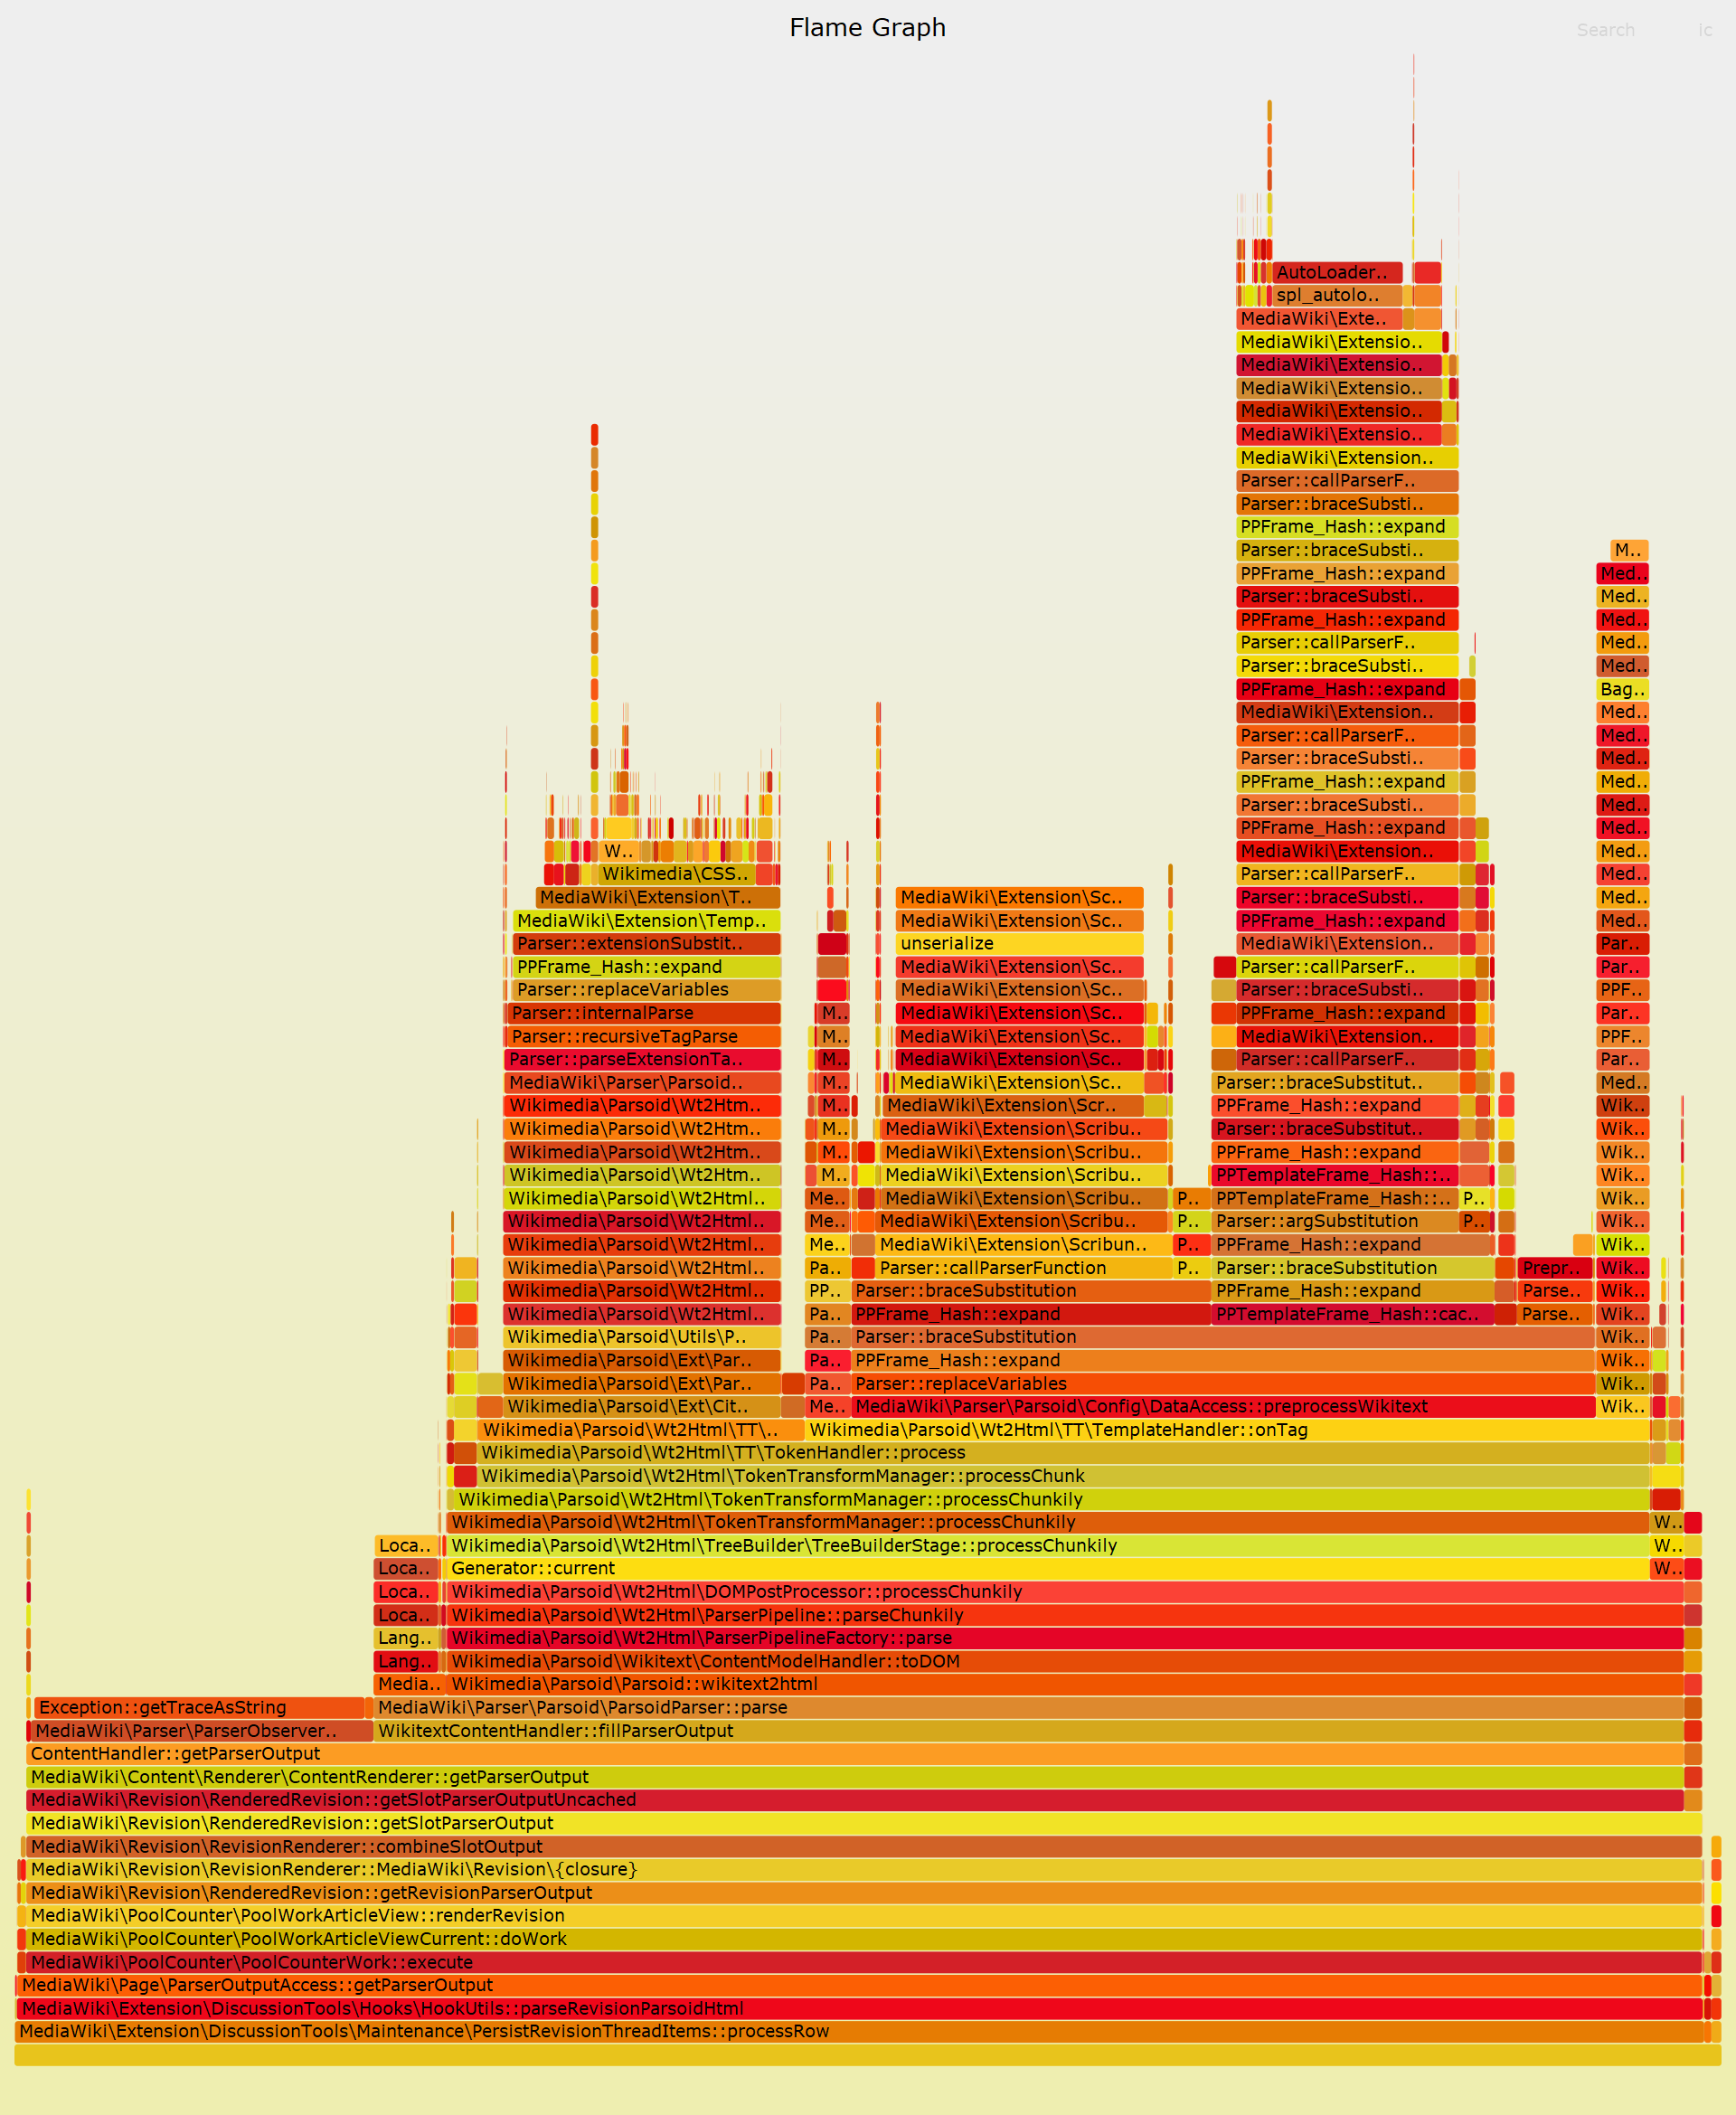
And these results (a flamegraph and pprof's own visualization):
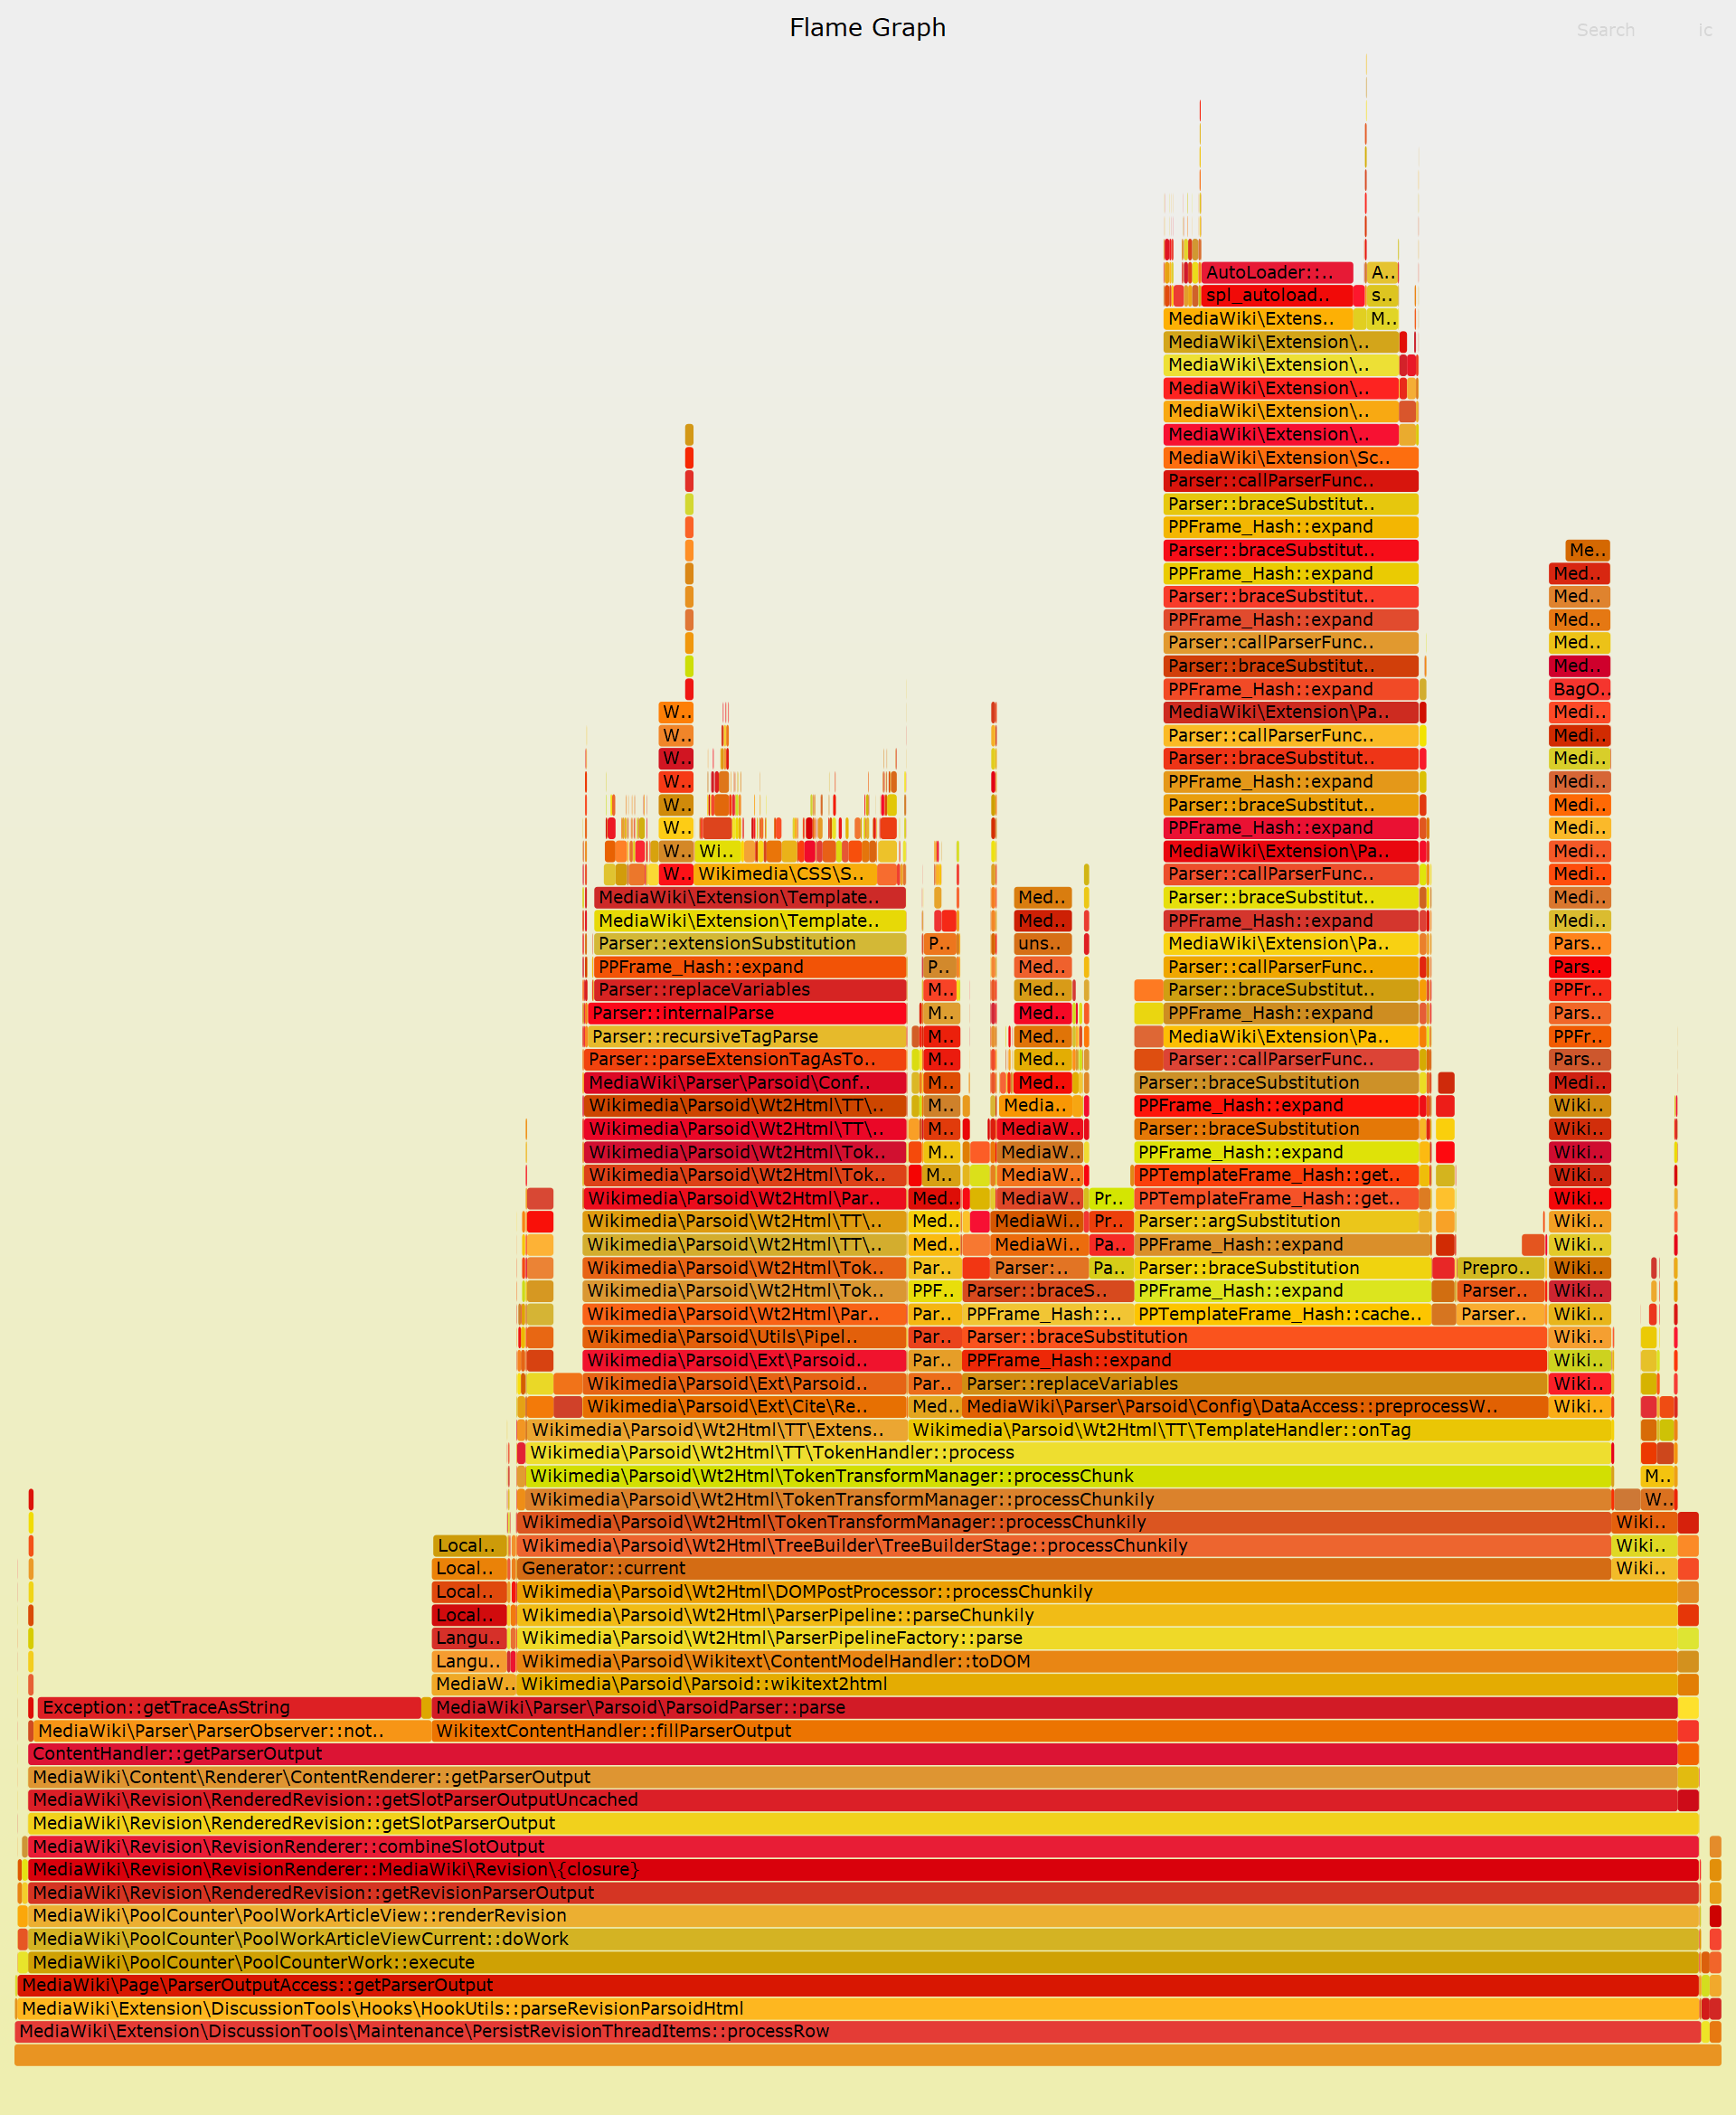
(note that this is a flamegraph of memory size – not of time, as is usual)
Observations (left-to-right on the flamegraph):
I think I'm going to stop here, and pin the blame on MediaWiki\Parser\ParserObserver::notifyParse, until something proves otherwise.
Big suspicious things are going on (…) I don't know if they're leaks, well-behaved caches, one-time initialization, or some measurement artifacts.
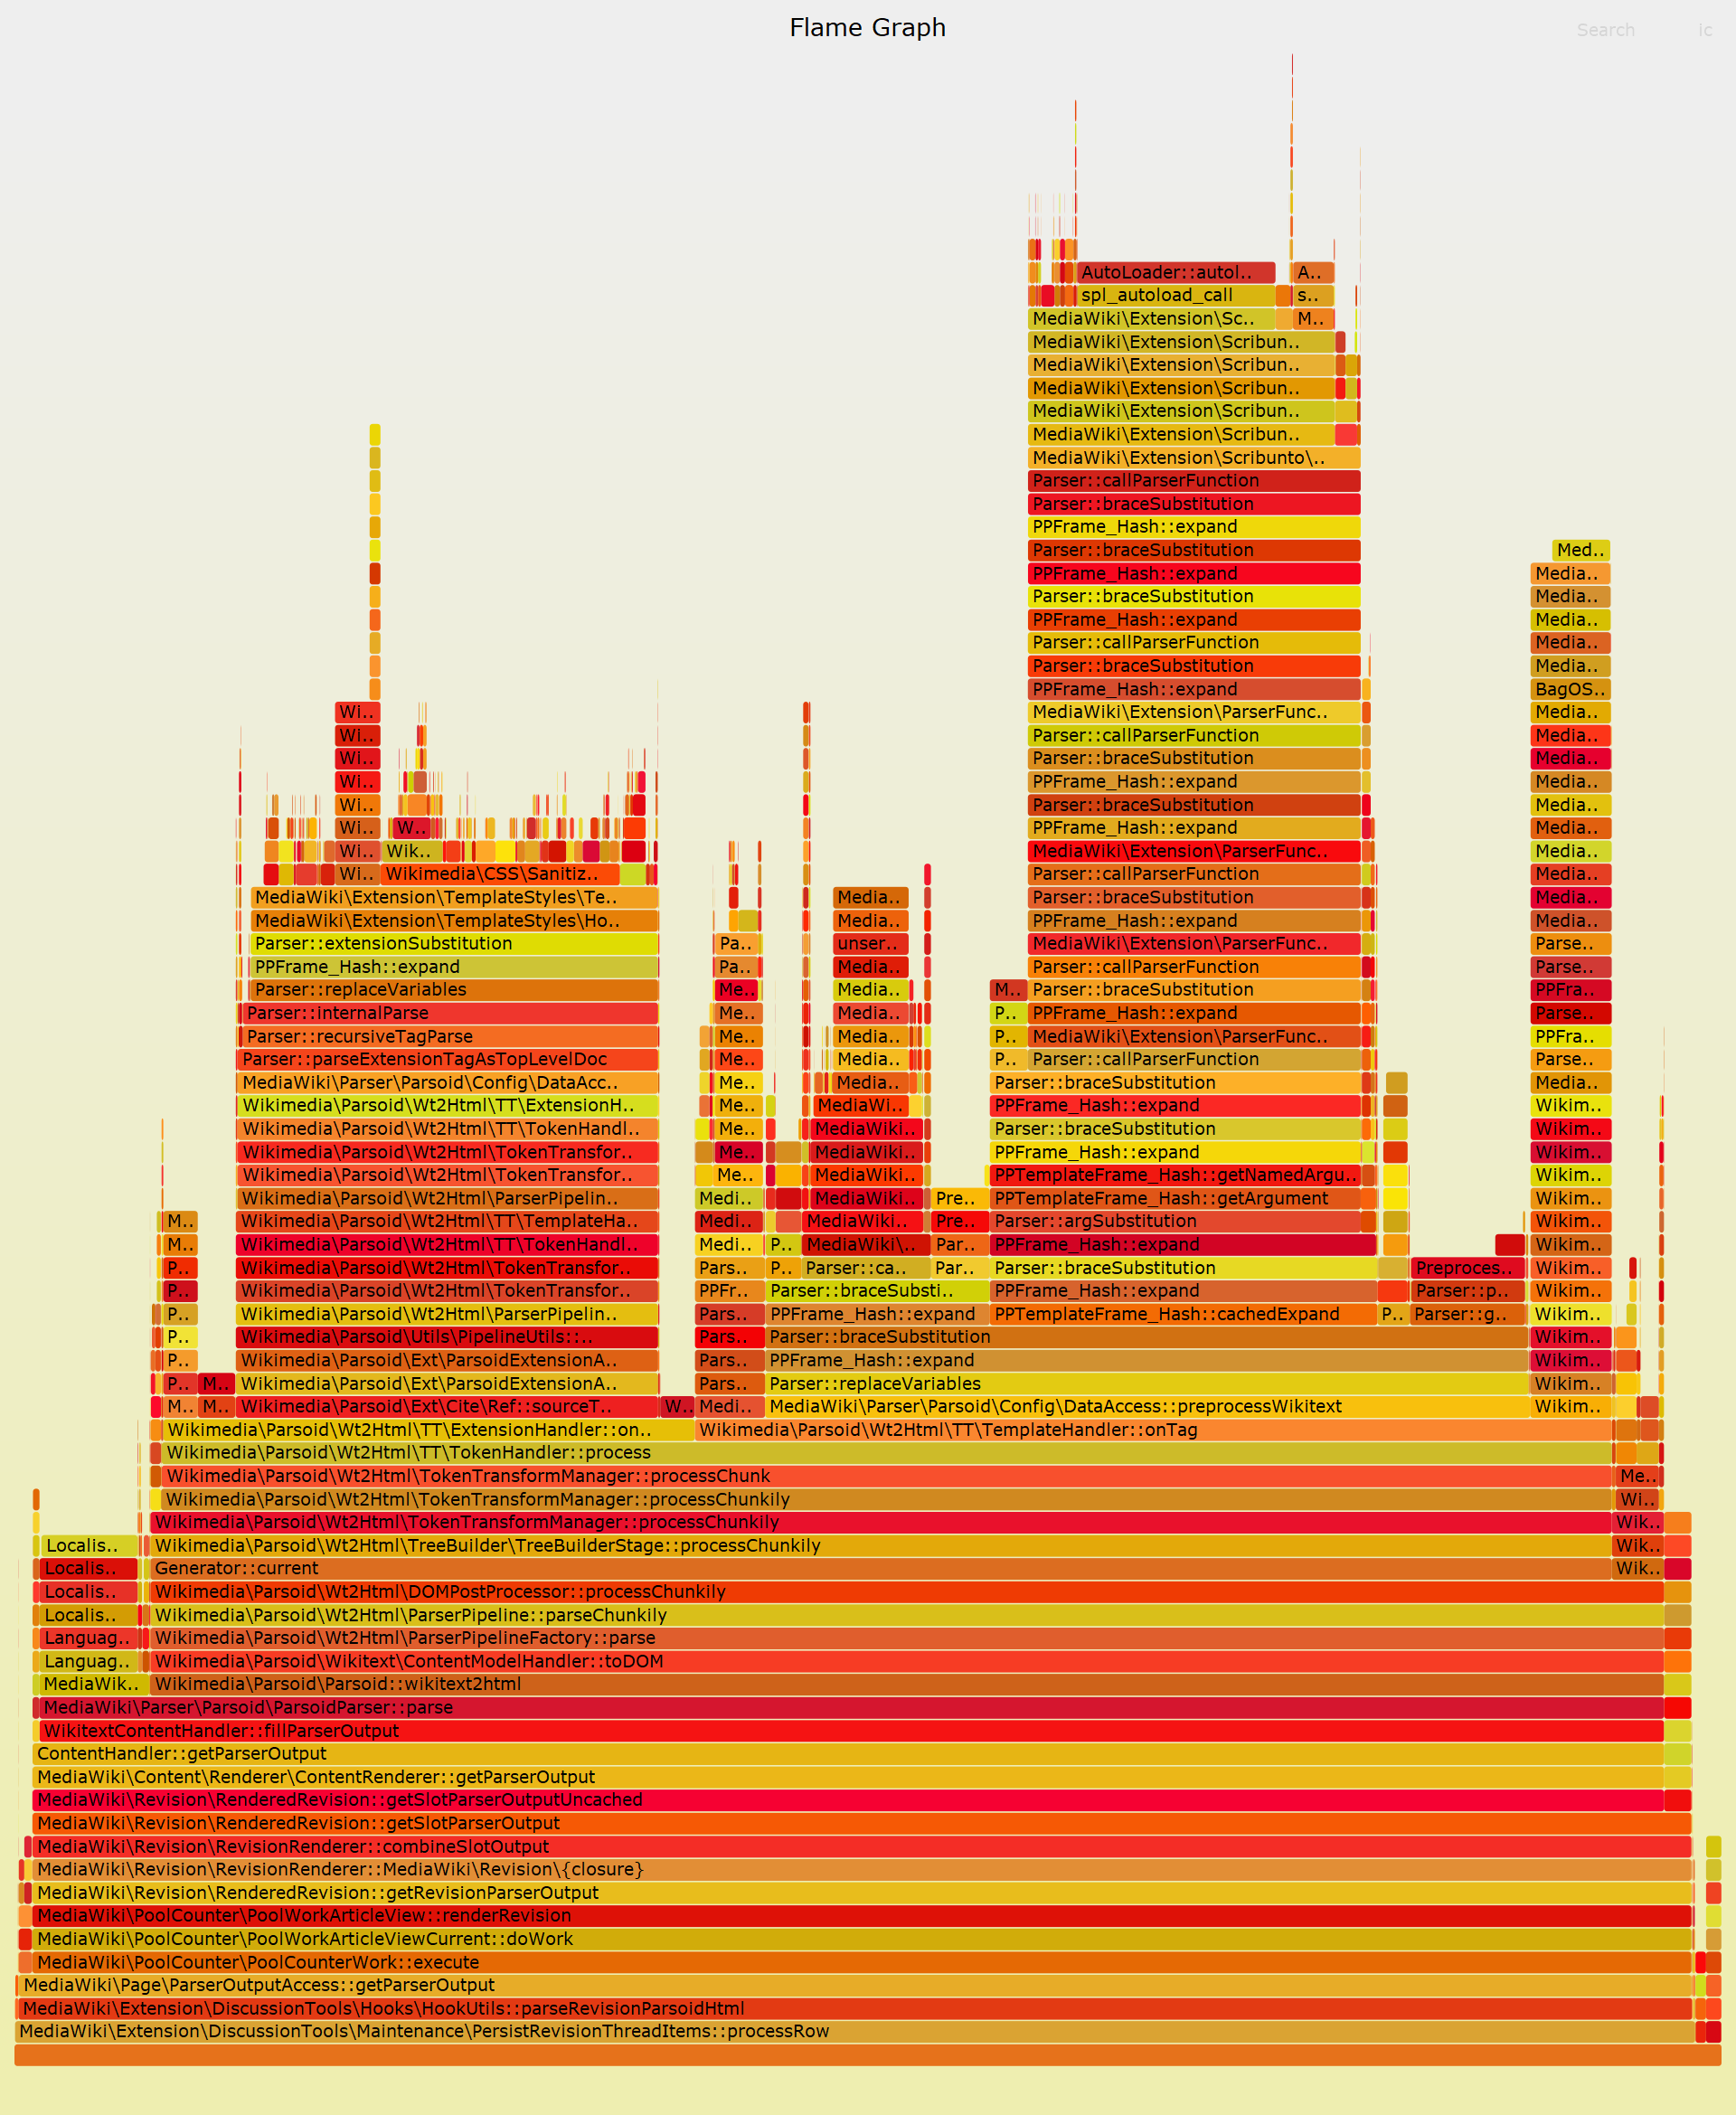
I just realized I could easily check by just making the script run in a loop over the same pages, and comparing the shape of the flamegraphs. That won't catch all leaks (e.g. if something leaks per page title or per revision), but it will catch many (if it leaks per parse or per call). Here's the result when running it 5 times:
Bad news is that MediaWiki\Extension\Scribunto\Engines\LuaStandalone\LuaStandaloneInterpreterFunction::incrementRefCount seems to actually be leaking :( Good news is that we don't use it in production! (we use LuaSandbox, which I can't be bothered to try to set up).
The rest of the suspicious things don't seem to grow, so that's nice.
Change 993206 had a related patch set uploaded (by Bartosz Dziewoński; author: Bartosz Dziewoński):
[mediawiki/core@master] ParserObserver: Limit the size of cache of previous parse traces
Change 993020 merged by jenkins-bot:
[mediawiki/core@master] DeprecationHelper: Don't copy the info into every instance
Change 993206 merged by jenkins-bot:
[mediawiki/core@master] ParserObserver: Limit the size of cache of previous parse traces
Change 998384 had a related patch set uploaded (by Bartosz Dziewoński; author: Bartosz Dziewoński):
[mediawiki/core@wmf/1.42.0-wmf.16] ParserObserver: Limit the size of cache of previous parse traces
Change 998385 had a related patch set uploaded (by Bartosz Dziewoński; author: Bartosz Dziewoński):
[mediawiki/core@wmf/1.42.0-wmf.17] ParserObserver: Limit the size of cache of previous parse traces
Change 998384 merged by jenkins-bot:
[mediawiki/core@wmf/1.42.0-wmf.16] ParserObserver: Limit the size of cache of previous parse traces
Change 998385 merged by jenkins-bot:
[mediawiki/core@wmf/1.42.0-wmf.17] ParserObserver: Limit the size of cache of previous parse traces
Mentioned in SAL (#wikimedia-operations) [2024-02-07T14:50:45Z] <logmsgbot> lucaswerkmeister-wmde@deploy2002 Started scap: Backport for [[gerrit:998384|ParserObserver: Limit the size of cache of previous parse traces (T351732)]], [[gerrit:998385|ParserObserver: Limit the size of cache of previous parse traces (T351732)]]
Mentioned in SAL (#wikimedia-operations) [2024-02-07T14:52:14Z] <logmsgbot> lucaswerkmeister-wmde@deploy2002 lucaswerkmeister-wmde and matmarex: Backport for [[gerrit:998384|ParserObserver: Limit the size of cache of previous parse traces (T351732)]], [[gerrit:998385|ParserObserver: Limit the size of cache of previous parse traces (T351732)]] synced to the testservers (https://wikitech.wikimedia.org/wiki/Mwdebug)
Mentioned in SAL (#wikimedia-operations) [2024-02-07T14:58:54Z] <logmsgbot> lucaswerkmeister-wmde@deploy2002 Finished scap: Backport for [[gerrit:998384|ParserObserver: Limit the size of cache of previous parse traces (T351732)]], [[gerrit:998385|ParserObserver: Limit the size of cache of previous parse traces (T351732)]] (duration: 08m 08s)
FWIW, I think the scripts are still leaking some memory, though only slowly. persistRevisionThreadItems for enwiki was somewhere around 2G of memory yesterday evening, as far as I remember; now it’s just over 4G. (Or rather, between 4005M and 4007M as reported by htop; that might be slightly below “4G” depending on where you assume which units, power-of-two or power-of-ten. Doesn’t matter.) The ukwiki run will probably finish long before it runs into problems (it’s only at 993M so far), but enwiki might need a handful of restarts over the next month.