Page MenuHomePhabricator

Varnish HTTP response from app servers taking 160s (only 0.031s inside Apache)
Closed, DeclinedPublic

Description

From a private file upload by @Samat:

Dear Performance Team,

I uploaded a .har file was created by the network tool (part of devtools) in FF 57. The file shows a page load with about 160 seconds.

I have often problem with the performance of the new surfaces (VE, WikiTextEditor2017, Filters, Notifications etc.), and I would like to understand the reason(s): is it only my fault or we can improve the software to make it better for millions of people. I believe, that my computer is not very slow, probably large part of the users (readers, editors) has slower tools than mine.

Please, investigate the file, and let me know, which script or anything caused the huge loading time.
(I can provide other examples, too, where the loading time is between 20 and 50 second; and my first impression is, that it waits at different part of the process...)

Please, handle the file confidentially, because it very likely contains sensitive data of mine (for example I have advanced administrative rights). If it is necessary, you can share the file at the WMF with other colleagues with the same clause. (From the results, it wasn't clear for me, which is the best developer team or group to assign to it.)

Please note, that I am not a developer, and I have to learn everything (small) step-by-step here. Be patient :)

Thank you,
Samat

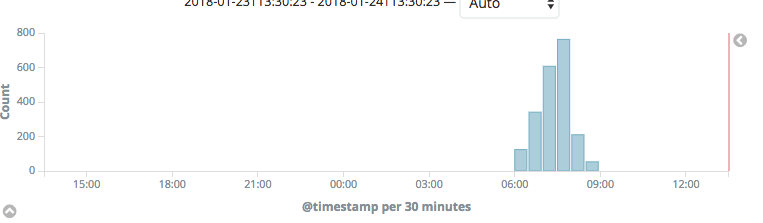
The HAR file shows a normal wiki page request, with https://hu.wikipedia.org/w/load.php?debug=false&lang=en&modules=site.styles&only=styles&skin=vector taking 160s to load (all the other ResourceLoader requests are in the 50-200ms range). The Backend-Timing header has D=30593 and the receiving timestamp matches the Date header in the request, so the time is not spent in ResourceLoader.

See also:

Related Objects

Event Timeline

There are a very large number of changes, so older changes are hidden. Show Older Changes

I've looked for that particular request from the HAR file in the varnish logstash data you've linked to @ema and couldn't find it.

If varnish saw this request as taking long, that would be reflected in the Backend-Timing header, right? So this must be happening inside varnish (or between varnish layers), or somewhere in the network (or on the client OS before the packets are passed to the browser, although can't really imagine how that could happen).

@Samat have you been experiencing this over multiple internet connections / on multiple machines by any chance?

OTOH in the HAR file all the ResourceLoader requests which were varnish cache hits / passes were fast, and the single cache miss was the one that took long. That could be a coincidence, but it does not seem that likely.

We've recently started logging requests taking longer than 60 seconds (from varnish's point of view) and sending the logs to logstash. Here are the logs relevant to load.php.

This is a good news.
But I am not sure if 60 seconds is the best limit. Short personal background: my example about the Special:Notifications shows a loading time "only" about 20 seconds, but as a user I felt already this time too long: in this time I saw an empty page with an animation. Probably I am too pampered, but if the loading time of a website is more than several seconds, I think something is wrong. If I am an editor who make this hundreds time a day, than I can do only half or third the work I did earlier in a given free time.

@Tgr I think I experienced this on multiple connections, but I usually use my laptop to edit Wikipedia. The only other place where I edit sometimes is the PC at my working place, but normally I shouldn't do this, therefore doesn't happen often. During these few small edits I don't remember that the problem happened (which doesn't necessary mean that my laptop is the problem).

If varnish saw this request as taking long, that would be reflected in the Backend-Timing header, right? So this must be happening inside varnish (or between varnish layers), or somewhere in the network (or on the client OS before the packets are passed to the browser, although can't really imagine how that could happen).

I don't think there's any guarantee of that, Backend-Timing is emitted by Apache. It might not include request queueing in Apache (that's something we should figure out), nor work/queueing that Varnish does itself. I believe the log entries include Varnish's own processing time.

What's the log format of the message field? I'm guessing the first three fields are start_timestamp, total_time, be_time?

I've found the explanation here.

What's logged is Timestamp:Resp, which according to this description indicates that the first value is the timestamp of when the response start being sent. The second value is the total spent to do everything (from receiving the request to responding) and the third figure is how much of that value was contributed by the "Resp" part of that breakdown. Looking at the logs, all instances have a high 3rd value, which IMHO indicates that the time is spent in Varnish.

Now, the query in the filter looks at Timestamp:Resp[2]. I presume that's 0-indexed and is looking at the third figure. This would explain why I couldn't find the request from the HAR, if it was caused by a slow data fetch from Mediawiki for example, while the Resp step itself took less than 60s. @ema that slow request log is catching interesting things (why is Varnish taking >60s to construct a response once it's fetched and processed the data?) but it doesn't catch requests where what's behind Varnish is slow. For that I think we would need to look at Timestamp:Fetch[2], as described in this example from the Varnish docs.

Another option would be to filter by Timestamp:Resp[1] which is the total time as preceived by Varnish, and log more details about the various steps and where time is actually spent, to differentiate issues where Varnish is slow versus whatever Varnish is talking to is slow. But maybe it'd be better if those different categories are tagged differently for logstash.

Slight correction: the fields start at 1, so Timestamp:Resp[2] is correct for total time spent in Varnish. We could log more, though.

Change 393751 had a related patch set uploaded (by Gilles; owner: Gilles):
[operations/puppet@production] Log more detailed info in Varnish slow request log

https://gerrit.wikimedia.org/r/393751

Going back to the context of this task, the request that took more than a minute in the HAR should have been seen by the slow Varnish log and wasn't. This suggests that the problem was somewhere between Varnish and the user. Varnish is terminated by Nginx for SSL, request queueing by Nginx is also a possibility, or LVS load balancing.

Change 393751 merged by Ema:
[operations/puppet@production] Log more detailed info in Varnish slow request log

https://gerrit.wikimedia.org/r/393751

OK, we have the explanation as to why the 2+ minute request didn't show up in the Varnish slow log. By default the VSL transaction timeout in Varnish is 120 seconds, and the varnishncsa command the slow log is currently based on doesn't allow overriding that value. Meaning that if a Varnish transaction takes more than 120 seconds, it won't be recorded in the slow log. In essence, the Varnish slow log only records requests taking longer than 60 but less than 120 seconds.

This is unfortunate because we can't figure out what happened to that particular request that took 2+ minutes. Having it in the slow log would allow us to see if the time was spent in what Varnish was talking to (Mediawiki), or sending the request to the client (which would suggest a network issue between the client and us).

I'm going to look into improving the Varnish slow log and hopefully @Samat we can catch one of your slow requests through that and see what happened.

Thank you Gilles for your efforts!

Am I correct that I should catch a slow loading longer than 60 secs now? Because delay between 20-60 seconds happens more often, but 1+ minute loading is quite rare.

We can lower the threshold of the slow log at some point and you won't need to hit such extreme cases for them to show up. But yes, for now only 60-120 seconds will show up in there with some information about what happened.

Change 395076 had a related patch set uploaded (by Gilles; owner: Gilles):
[mediawiki/vagrant@master] Smarter Varnish slow log

https://gerrit.wikimedia.org/r/395076

Change 395076 merged by jenkins-bot:
[mediawiki/vagrant@master] Smarter Varnish slow log

https://gerrit.wikimedia.org/r/395076

Change 399176 had a related patch set uploaded (by Gilles; owner: Gilles):
[operations/puppet@production] Smarter Varnish slow log

https://gerrit.wikimedia.org/r/399176

Change 399176 merged by Ema:
[operations/puppet@production] Smarter Varnish slow log

https://gerrit.wikimedia.org/r/399176

It turns out to be quite common for load.php calls to take more than a minute: https://logstash.wikimedia.org/goto/788ca720a38ccbed8dab29adab7ac2ca

The detailed information confirms that the time is spent in the origin, not in Varnish.

We should look at the varnish logs to see if we can find other pages that have a similar behavior. Is this part of T164248

Revisiting[[ https://logstash.wikimedia.org/goto/788ca720a38ccbed8dab29adab7ac2ca | the link I posted previously ]], graph for the past 24 hours is peculiar:

Capture d'écran 2018-01-24 14.33.21.png (223×763 px, 21 KB)

Furthermore, 100% of the affected requests are on esams. I presume @Samat is connecting from Europe, which would be consistant with that information. Could it merely be intermittent networking issues between Esams and Eqiad? Or an issue with esams Varnish servers?

Looking at the last 7 days of data, the pattern holds true, with esams servers dwarfing the rest:

Capture d'écran 2018-01-24 14.39.47.png (1×409 px, 29 KB)

I'm going to un)lick that cookie and pass on the torch to Traffic since this seems like a strong indicator that 60+ seconds load.php requests (and maybe MediaWiki requests in general) being due to networking problems in the Amsterdam DC.

Couple of things that I noticed about this, which seem to generally support Gilles' conclusion:

The requests that were logged differ slightly. Some have a "response-X-Cache-Int" header that include both a miss on a cp3xxx server and also a pass on a cp1xxx server. The remainder only have a pass on a 10xx server. I'm assuming that the former are slow requests that were logged by the front-end Varnish servers in esams, and the latter are slow requests that were logged by the back-end Vanish servers in esams.

Some requests are a cache **hit** when they get to the varnish servers in eqiad. This is interesting, because it means that the application server wasn't involved.

The new slow log is great - Just a side note!

Krinkle renamed this task from load.php response taking 160s (of which only 0.031s in Apache) to Varnish HTTP response from app servers taking 160s (only 0.031s inside Apache).Jan 31 2018, 3:12 AM
Krinkle subscribed.

TL;DR: The network itself doesn't seem to be at fault. Whatever this is, it probably affects esams more than others due to esams' generally-high traffic levels combined with its higher latency back to the core of our network. It seems to have to do with large volumes of cache expiry/invalidation traffic thundering together around these moments in time and causing some backlog in servicing requests from esams->eqiad, but it's not yet clear enough to me to tease out explicit causes and effects and find a solution.


I'm still staring at various related things, but to give an interim update: when looking at @Imarlier's logstash link (and related), there's some strong correlations with notable spikes in our varnish machine-level stats about expiry with the same recurrent patterns on these hosts. Some hosts are more-affected than others, and/or have a greater impact on load.php requests, presumably due to chashing.

This is the pattern on the Varnish end of things to look for, in the basic Linux memory stats. Note the daily dropoffs here for ~4/7 days of the week in "Cached" memory:

https://grafana.wikimedia.org/dashboard/db/varnish-machine-stats?panelId=4&fullscreen&orgId=1&var-server=cp3040&var-datasource=esams%20prometheus%2Fops&from=1516813111053&to=1517417911053

Interpreting those downwards spikes in the context of the host in question (cp3040 in this case): The largest down-ramp on 2018-01-25 is from the cron-scheduled weekly restart of the daemon. This restart invalidates the entirety of the cache contents on this backend, so we expect this sort of affect on cached memory here (whether it directly causes fallout at that time is another matter, for now).

For a few days afterwards there is no notable spike, but as we get further along in the week-long lifetime on the daemon, for the final few days before the next weekly restart, we see these very visible cached-memory dropoffs appear at roughly 24-hour intervals, corresponding roughly to T+4, T+5, and T+6 days after the restart. If you squint a little, you can also see a much smaller one before them at T+3d, but it's not very statistically significant. This general pattern can be detected on most of our text cache backends to at least some degree, on some kind of related timing. Here's another from cp3032, where the weekly-restart timing is different (~2018-01-27T22:00), but then the daily dropoffs leading up to it align more with the observed load.php effects closer to the UTC morning hours:

https://grafana.wikimedia.org/dashboard/db/varnish-machine-stats?panelId=4&fullscreen&orgId=1&from=1516813111053&to=1517417911053&var-server=cp3032&var-datasource=esams%20prometheus%2Fops

When you zoom out to the other varnish machine stats at these events, what's clear is that this dropoff in cached memory correlates strongly with a spike in refreshing a ton of expiring/invalidated cache objects all at once. It's not yet clear to me if this is due to explicit invalidation (i.e. purge traffic), or just very badly-clustered "natural" expiry timing. The connection count (to eqiad backend caches) spikes sharply, the "mailbox lag" (used to handle invalidating cache contents) spikes sharply, etc. There's usually a spike of fetch failures as well, and notably the Varnish thread count briefly ramps up until it's limited by our config parameters at ~24K threads (whereas normally it would sit at ~500 threads, the configured minimum), and the "queued" fetches also ramp up during this time. Thus, the long load.php timings here almost certainly are due to this massive spike in esams->eqiad backend fetches and the resulting queueing of requests/threads that occurs.

Looking specifically at cp3040 circa 2018-01-30T06:00, here's some of the data mentioned above:
Varnish waitinglist structs: https://grafana.wikimedia.org/dashboard/db/varnish-machine-stats?panelId=55&fullscreen&orgId=1&var-server=cp3040&var-datasource=esams%20prometheus%2Fops&from=1517287371030&to=1517294783804
Varnish expiry mailbox lag spiking: https://grafana.wikimedia.org/dashboard/db/varnish-machine-stats?panelId=21&fullscreen&orgId=1&var-server=cp3040&var-datasource=esams%20prometheus%2Fops&from=1517287371030&to=1517294783804
Varnish backend sessions, showing "queued" and "connecting" spiking up: https://grafana.wikimedia.org/dashboard/db/varnish-machine-stats?panelId=51&fullscreen&orgId=1&var-server=cp3040&var-datasource=esams%20prometheus%2Fops&from=1517287371030&to=1517294783804
Varnish backend threads capping out at ~24K: https://grafana.wikimedia.org/dashboard/db/varnish-machine-stats?panelId=52&fullscreen&orgId=1&var-server=cp3040&var-datasource=esams%20prometheus%2Fops&from=1517287371030&to=1517294783804

What I don't see here is any obvious implication at the network layer. There's no spike or ongoing saturation at cp3040's ethernet port, and ditto on the esams<->eqiad transit link.


My best guesses and things I'm looking at from here:

  • The "daily" nature of things - Is probably related to the fact that we cap cache object expiries at ~24H lifetime. We've proposed randomly varying this by a small amount before, and may need to look at that harder in general.
  • Weekly backend restarts:
    • These are ultimately done due to Varnish4 issues with storage scaling and mailbox lag, and we're hoping Varnish5 (transition in progress!) alleviates the need for these, but time will yet tell.
    • Possibly bad timing coincidences here between various esams machines, or esams+eqiad machines. We dither these out over a week, but the dithering doesn't look at time-of-day coincidences (which could correlate poorly with the ~24H object lifetimes) or inter-dc coincidences.
    • Possibly the depooling window around these is insufficient.
  • Invalidation (PURGE) traffic:
    • There's been some progress on reducing the PURGE rate from the applications in recent months, but it's still rather high in general, averaging in the vicinity of ~2K/sec.
    • There's no obvious spikes in the PURGE rate that correlates with the issues here.
    • However, most PURGEs emitted by the applayer do nothing: they attempt to invalidate items which were not in the cache anyways. That in itself isn't a problem, but it could be hiding the potential that perhaps there are notable spikes in the number of useful PURGEs around these moments in time (an actual spike of invalidated live cache objects).

Change 408810 had a related patch set uploaded (by BBlack; owner: BBlack):
[operations/puppet@production] Varnish: swizzle default/cap 1d TTLs by 5%

https://gerrit.wikimedia.org/r/408810

Change 408810 merged by Ema:
[operations/puppet@production] Varnish: swizzle TTLs by 5%

https://gerrit.wikimedia.org/r/408810

Krinkle updated the task description. (Show Details)

Change 418920 had a related patch set uploaded (by BBlack; owner: BBlack):
[operations/puppet@production] text-be: use short hfm time for cacheable+cookie case

https://gerrit.wikimedia.org/r/418920

Change 418920 merged by BBlack:
[operations/puppet@production] text-be: use short hfm time for cacheable+cookie case

https://gerrit.wikimedia.org/r/418920

Change 418580 had a related patch set uploaded (by BBlack; owner: Ema):
[operations/puppet@production] varnishslowlog: filter on all timestamps

https://gerrit.wikimedia.org/r/418580

Change 418603 had a related patch set uploaded (by BBlack; owner: Ema):
[operations/puppet@production] varnishslowlog: add Backend-Timing D=, in seconds

https://gerrit.wikimedia.org/r/418603

Change 419089 had a related patch set uploaded (by BBlack; owner: BBlack):
[operations/puppet@production] cron_splay: add a semiweekly mode of operation

https://gerrit.wikimedia.org/r/419089

Change 419090 had a related patch set uploaded (by BBlack; owner: BBlack):
[operations/puppet@production] varnish: restart backends every 3.5 days

https://gerrit.wikimedia.org/r/419090

Change 419091 had a related patch set uploaded (by BBlack; owner: BBlack):
[operations/puppet@production] varnish: remove weekly restart cron entries

https://gerrit.wikimedia.org/r/419091

Change 419091 abandoned by BBlack:
varnish: remove weekly restart cron entries

https://gerrit.wikimedia.org/r/419091

Change 419089 merged by BBlack:
[operations/puppet@production] cron_splay: add a semiweekly mode of operation

https://gerrit.wikimedia.org/r/419089

Change 419090 merged by BBlack:
[operations/puppet@production] varnish: restart backends every 3.5 days

https://gerrit.wikimedia.org/r/419090

Change 418580 merged by BBlack:
[operations/puppet@production] varnishslowlog: filter on all timestamps

https://gerrit.wikimedia.org/r/418580

Change 418603 merged by BBlack:
[operations/puppet@production] varnishslowlog: add Backend-Timing D=, in seconds

https://gerrit.wikimedia.org/r/418603

Change 419409 had a related patch set uploaded (by Ema; owner: Ema):
[operations/puppet@production] prometheus: aggregation rule for varnish_backend_conn

https://gerrit.wikimedia.org/r/419409

Change 419409 merged by Ema:
[operations/puppet@production] prometheus: aggregation rule for varnish_backend_conn

https://gerrit.wikimedia.org/r/419409

Change 419705 had a related patch set uploaded (by Ema; owner: Ema):
[operations/puppet@production] varnish: remove gethdr_extrachance

https://gerrit.wikimedia.org/r/419705

Change 421275 had a related patch set uploaded (by BBlack; owner: BBlack):
[operations/puppet@production] varnishslowlog: no Resp filter on backends, either

https://gerrit.wikimedia.org/r/421275

Change 421275 merged by BBlack:
[operations/puppet@production] varnishslowlog: no Resp filter on backends, either

https://gerrit.wikimedia.org/r/421275

I've pulled together a few other related open tasks that belong here. It seems fairly certain that all of these things are inter-related misbehaviors observed from different angles and under different conditions. Some of the other ongoing changes and optimizations we've made during this time have also changed the nature of the fallout, but not changed the fact that fallout happens. Recent patches attempting to workaround/fix these issues have been spread around these tasks.

To summarize current state / findings / open stuff:

  • The original problem here (slow load.php response), the various text 503 spikes over the past few weeks, mailbox lag ramps, etc... all of these problems seem to be basically gone since ~ Mar 22 in various graphs/logs.
  • We're in a holding pattern for at least a couple more days to see if we can get at least a full week without any significant issue on these fronts. We may hold out on truly-final judgement a bit beyond that as we go through reverting patches deemed unnecessary, and also because the caches are going through reboot cycles for kernel upgrades at present, and the timings of those might be artificially suppressing issues.
  • The key outstanding workaround pending a revert is the move from weekly backend restarts to 3.5-day restarts ( https://gerrit.wikimedia.org/r/#/c/421943/ ). Evidence indicates this didn't help, but again we're waiting a couple more days to see if errors re-surface before trying to revert this.
  • A few key changes happened near or shortly before the middle of Mar 22 when all of the various problems started falling off the problem radars, which may be contributing positively in important ways (as opposed to many other general improvements we made before which seemed to have little effect):
    • For the varnishslowlog evidence in particular: on Mar 13 we merged https://gerrit.wikimedia.org/r/#/c/418580/ , which greatly expanded the types of slow timestamps captured, so we could make more inferences. Later on Mar 22, we merged https://gerrit.wikimedia.org/r/#/c/421275/ which removed the Resp filters added on the 13th (but left all the others), as these were making log noise on purely client-side slowness issues. This appears to be when the last of the load.php entries left the log, but I think we always knew there was noise in those, and the Mar 22 patch simply removed the last of the client-side noise after some earlier changes had eliminated the truly server-side issues. I haven't yet pinned down when the time-fetch ones stopped happening, but that may help pin down an earlier timestamp.
    • Also on the 22nd, https://gerrit.wikimedia.org/r/#/c/421267/ was merged, which eliminated Varnish requesting gzip content-encoding from the application (and thus shifts most of the gzip load over to Varnish itself). There was evidence past and present that MW(/hhvm/apache) gzip outputs were erroneous in ways that may trigger failures up at the varnish layer ( T125938#4047636 ), so it's plausible this was the primary fix.
    • Back on the 21st, we merged a pair of VCL-layer workarounds ( https://gerrit.wikimedia.org/r/#/c/420927/ + https://gerrit.wikimedia.org/r/#/c/420928/ ) which may have mitigated https://github.com/varnishcache/varnish-cache/issues/1799 . We know they at least mitigated some VCL_Error log entries which were caused by that (still-unresolved) varnish bug, we're just not certain if these issues were happening with enough severity or volume to be causing all the primary issues here. As a consequence of how the 420927 mitigation was implemented, typical "grace" hold times (when we'll serve a stale object from cache while busy fetching a new copy in parallel) were extended from 5 minutes to 20 minutes as an operational compromise, and that alone could be mitigating some other related performance issues that might be separate from the 1799 bug.

Will update more as investigation deepens and/or more days of evidence are collected, but we're looking hopeful at this point one way or another.

Digging into the timestamps of the final entries of various types (for load.php slowlog entries):

The last of the bulk of the ones with long varnish-fetch times (but no matching apache delay, etc) was logged at 2018-03-21T13:41:18 . They were relatively-frequent before that point, so clearly that was a major transition. It was a normal js module loader thing. (technically there were a pair of similar ones several minutes later, but they were rarer wikidata.org uses, may not be similar). This is about 10h after https://gerrit.wikimedia.org/r/#/c/420927/ (and related), but well before the gzip-related patch.

After that, there is one remaining oddball bad entry at 2018-03-22T06:22:46 . It was using load.php to grab a 24x24 png image which has an original size of 298 bytes, and was gzipped (by the applayer) to 318 bytes (which means gzip did nothing but add the 20 byte header). This was about 5.5h before the AE:gzip patch, so it could be that this was a separate minority case that was fixed up. (FWIW, the Varnish-level gzipping that has replaced the applayer gzipping has a size cutoff at 860 original bytes and won't try to compress images).

Given the problems were coming and going in bursts anyways, it's hard to say yet, but I suspect both changes did some positive things here...

Change 425045 had a related patch set uploaded (by Ema; owner: Ema):
[operations/puppet@production] varnish: restart backends every 7 days

https://gerrit.wikimedia.org/r/425045

Change 425045 abandoned by Ema:
varnish: restart backends every 7 days

Reason:
See https://gerrit.wikimedia.org/r/#/c/425046/ instead.

https://gerrit.wikimedia.org/r/425045

Change 425045 at https://gerrit.wikimedia.org/r/425045 abandoned by Ema:
varnish: restart backends every 7 days

Reason:
See https://gerrit.wikimedia.org/r/425046/ instead.

This has since been merged (and reverted, and re-applied).

rOPUP7ed8049546f9: Revert "Revert "varnish: restart backends every 3.5 days""

We've migrated from varnish-be to ats-be (see https://wikitech.wikimedia.org/wiki/MediaWiki_at_WMF#Infrastructure).

Per @Gilles (via IRC), we're not currently seeing these timeouts anymore for load.php (from POV of varnish-frontend). And previously we narrowed it down to varnish-backend, so I think we can close this for now.

If we do find something similar again, we should file a new task.