Page MenuHomePhabricator

Special:Notifications is too slow to open
Closed, DeclinedPublic

Description

How it's supposed to work:

  1. Go to Special:Notifications.
  2. See the notifications.

What's happening now:

  1. Go to Special:Notifications.
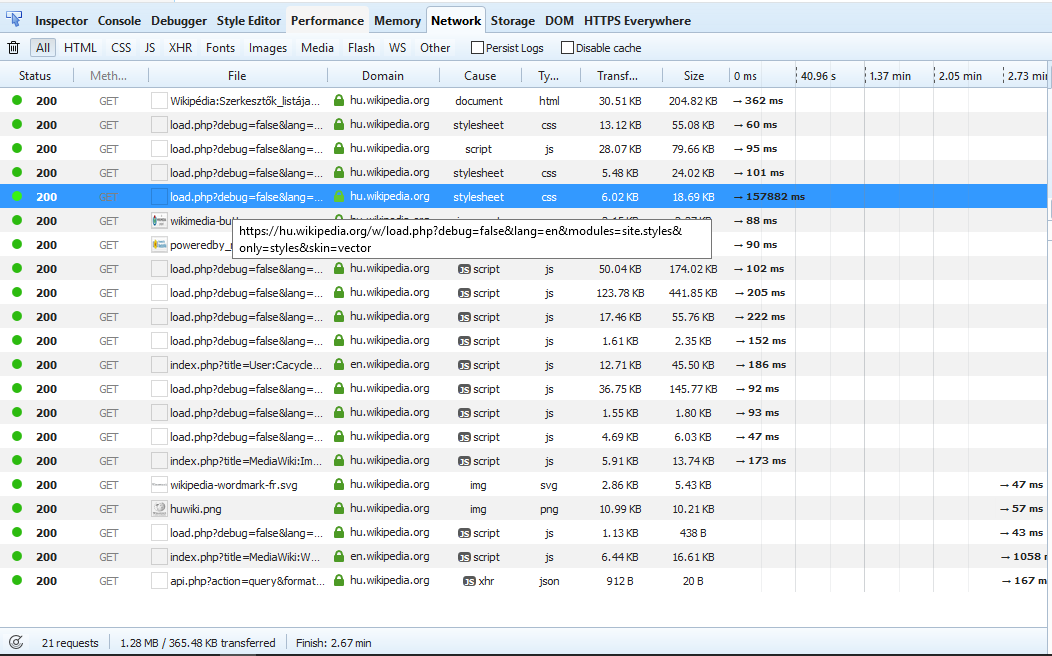
  2. See the gray striped "maybe I'm still trying to load something" bar.
  3. Twiddle thumbs.
  4. Maybe see the notifications, or maybe not.

I see this fairly often in Firefox 49 and 50 on macOS Sierra 10.12.1. @Jpgordon is seeing it in multiple web browsers (also on a Mac).


Send us your performance traces

If you're encountering this issue and would like to help us troubleshoot the underlying causes, please copy the text below and paste it into a new comment on this task, and fill in each section.

  • URL: e.g. https://en.wikipedia.org/wiki/Main_Page?safemode=1
  • Browser and version: (e.g. Firefox 60)
  • OS: e.g. Ubuntu 18.04
  • CPU: e.g. i5 dual-core
  • RAM: e.g. 8 GB
  • Number of alerts: e.g. 99+
  • Number of notices: e.g. 76
  • Observations: Please include any comments or observations you have.

Performance trace:

Please ensure that &safemode=1 is added to your URL before doing the performance trace.

Chrome(/ium) performance trace instructions

  • Right click anywhere on the page and choose "Inspect". A panel will open on the right-hand side or bottom of the screen.
  • In the inspector menu bar, click the three dots icon at right, select settings, make sure “Disable cache (while DevTools is open)” is selected.ma
  • Along the top line of this panel, you'll see Elements, Console, Sources, etc. Choose Performance (if the panel is on the side, you may need to click the >> button to get there)
  • In the bar below "Performance", you'll see a record button and a reload button. Click the record button.
  • A recording will start. Click on the "Your alerts" button, then click out of the pop up after it loads. Click on the "Your notices" button, wait for the notifications to load, then click out of the popup. Click the blue "Stop" button to stop the recording.
  • In the bar where you found the record and reload buttons, click the down arrow button ("save profile")
  • This opens a dialog that will let you save your recording as a .json file.
  • Do not upload this file to Phabricator. Please email it to kharlan [at] wikimedia.org and put T153011 in the subject

Firefox instructions

  • Go to the watchlist
  • Right click anywhere on the page and choose "Inspect element". A panel will open on the bottom of the screen.
  • Along the top line of this panel, you'll see Inspector, Console, Debugger, etc. Choose Performance.
  • Click the "Start recording performance" in the middle. A recording will start. Click on the "Your alerts" button, then click out of the pop up after it loads. Click on the "Your notices" button, wait for the notifications to load, then click out of the popup. Click the blue "Stop" button to stop the recording.
  • On the left, you will see a bar with "Recording #1", and a small "save" link next to it. Click the "save" link.
  • This opens a dialog that will let you save your recording as a .json file.
  • Do not upload this file to Phabricator. Please email it to kharlan [at] wikimedia.org and put T153011 in the subject

Event Timeline

Restricted Application added a subscriber: Aklapper. · View Herald Transcript

We should check into how long the load takes, but I am most concerned about #4... what do you mean "Maybe see notifications, or maybe not" ? Do they not load sometimes? Do you get any errors?

If there's an issue of loading the page it should be separate than solving for how *long* it takes to load the page...? I just want to verify we're looking and solving the correct problems.

Sometimes it shows the gray stripes for a long time, and then gives me the notifications. Sometimes it shows the gray stripes for a long time, and never gets any further than that. Sometimes it shows the gray stripes for a long time, and I re-load the page several times, until it finally gives me the list of notifications.

Right now, for example: I went to https://en.wikipedia.org/wiki/Special:Notifications with a timer in hand. After two seconds, the page had reached the "gray stripes" stage. After two more seconds, Firefox's "I'm still trying to load" spinner stopped, with the gray stripes still showing. After 30 seconds, I re-loaded the page, with the same results. The third time that I tried to load this page, I got one second of gray stripes followed by the list of notifications.

@Whatamidoing-WMF when exactly did you start noticing that it was slower than expected? Thanks!

Sometimes I'll encounter the notifications never showing up (just endless progressbars), and it's always because some user script failed and threw an exception, preventing the rest of the JS from loading/executing.

@Whatamidoing-WMF Can you still reproduce this with some reliability? I'm especially interested in the case where the notifications never appear.

Sometimes I'll encounter the notifications never showing up (just endless progressbars), and it's always because some user script failed and threw an exception, preventing the rest of the JS from loading/executing.

Do you know if there's a specific user script that is at fault when this happens, or is this more random?

@Whatamidoing-WMF, if this happens again, can you open the console (Ctrl-Shift-J) and let us know if there are any errors in there? It's a bit technical, but since I can't manage to reproduce this (and sounds like @SBisson and @Catrope can't either) it would really help!

@Whatamidoing-WMF thanks for emailing me your console log. The relevant bit is TypeError: mw.util.$content is null[Learn More] index.php:176:1, I think I've seen that somewhere before and I vaguely recall it being due to a user script or gadget.

@Mattflaschen-WMF didn't you tell me about this error at some point?

I believe that error can break ContentTranslation. I don't know how to find out which script is doing it.

I believe that error can break ContentTranslation. I don't know how to find out which script is doing it.

This doesn't always work, but it's worth a shot: could you go to https://en.wikipedia.org/wiki/Special:Notifications?debug=true , tell me if that breaks, and send me the console log? There's a bit more detail in the logs in debug logs that may or may not help us narrow down where the error is.

@Mattflaschen-WMF didn't you tell me about this error at some point?

Yeah, @kaldari hit it (also on Special:Notifications).

I suspected that it was user scripts/gadgets that time, and indeed kaldari tracked it to markblocked. But he said he fixed it, so maybe it's a another one this time.

I fixed the markblocked gadget on December 2nd, so that shouldn't be the cause.

BTW, the issue with that gadget was that mw.util.$content was null at document.ready. This was fixed by adding mediawiki.util as an explicit dependency for the gadget and adding checks for mw.util.$content being null in the gadget code.

@Whatamidoing-WMF Can you reproduce this in safe mode? https://en.wikipedia.org/wiki/Special:Notifications?safemode=1 will load the notifications page without any gadgets or user/site scripts. If you can reproduce in safe mode, then there's a bug in our software and we'll try to track it down; if not, then the issue is with a user/site script or gadget.

There is also the possibility that it is something else loading from bits, perhaps. There seems to be a metric tonne of css, js and other stuff in there.

@Catrope, I haven't encountered this problem since markblocked was updated.

I haven't encountered this problem since markblocked was updated.

If noone can reproduce, should this task get closed as declined (via the Add Action...Change Status dropdown)?

jmatazzoni moved this task from Untriaged to Ready for Pickup on the Collaboration-Team-Triage (Collab-Team-Q1-Jul-Sep-2017) board.

I would not call this "ready for pickup" if no steps to reproduce are available, but understandings may differ. :)

If noone can reproduce, should this task get closed as declined (via the Add Action...Change Status dropdown)?

No reply. Hence closing this task.
If anyone can still reproduce, please set the status of this report back to "Open" via the Add Action...Change Status dropdown. Thanks!

Samat reopened this task as Open.EditedSep 15 2017, 9:58 PM
Samat subscribed.

Hi!

@Catrope I wanted to create a new bug report, but this one is quite close what I wanted to report. Therefore I reopened the task.

  1. I have frequently problem with loading the notifications. Sometimes with the popup version, sometimes with the full page version (Special:Notification). The page / pop-up appears quickly with the gray animated striped bar, but then the notifications will never be loaded. I have stable internet connection with a rather fast laptop, up-to-date Windows 10 + FF. I left the stuck page in my browser, but now, after more than one hour it is still "loading". I can reproduce in the sense that happens time to time again, but I don't see any rule for that. Not easy to debug, because if I reload the page, it works, and the problem happens next time later...

I uploaded a print screen here: https://pasteboard.co/GKxiJXj.png

  1. (This doesn't fit to the title, but I wanted to ask) If I click on the notification icon on the top of the page, sometimes I see the pop-up window with the notifications, sometimes this action redirects me to the Special:Notification page, and I don't understand, what is the rule for this. I feel I clicked the same way... :)

Hi @Samat

Concerning your first point, do you use any gadgets or scripts? Have you tried to identify or bypass them?

Concerning your second point, the behavior is the following:

  1. you click a first time on the icon and it opens the fly-out
  2. you click a second time on the icon will open Special:Notifications

If the first steps doesn't load fast enough for you, the system may think you have clicked twice.

Hi @Samat

Concerning your first point, do you use any gadgets or scripts? Have you tried to identify or bypass them?

Yes, I use some gadgets and scripts.
The problem is, that if I reload the page, it helps the problem (independently if I use safemode=1 or not). So I cannot reproduce directly after one occurrence again.
Do you have any suggestion for this kind of situations?
Maybe I will really use the enabled debugging console for some days, and I hope the problem happen again during this testing period.

Concerning your second point, the behavior is the following:

  1. you click a first time on the icon and it opens the fly-out
  2. you click a second time on the icon will open Special:Notifications

If the first steps doesn't load fast enough for you, the system may think you have clicked twice.

Thank you :)

Yes, I use some gadgets and scripts.
The problem is, that if I reload the page, it helps the problem (independently if I use safemode=1 or not). So I cannot reproduce directly after one occurrence again.
Do you have any suggestion for this kind of situations?
Maybe I will really use the enabled debugging console for some days, and I hope the problem happen again during this testing period.

You probably have a conflict between a script and Notifications. Use safemode=1 will allow you to know more about that: https://www.mediawiki.org/wiki/Special:Notifications?safemode=1 will let you know if the Special page loads without any bug or not. Then

  • if the page loads very slowly, it may be a bug from the Notifications and we will have to investigate it.
  • If the page loads without any particular slowdown, that's on your side and you will have to inspect your gadgets and scripts. :)

@Samat, any updates from my last comment?

@Trizek-WMF sorry that I didn't show up since your last comment. I did some improvement from my side: removed a virus and more malwares from my computer (:S) , cleaned my registry and generally the whole OS, switched off some scripts and gadgets and updated to FF Quantom etc. Since then I still have problem time to time with the loading time (instead of 1-2 seconds it is 10-20 seconds), but I generally don't use safemode and switched on Developer tools to track my browsers activity, and if I reload the page after the problem with these settings or without, this problem doesn't occur again. I will try to find a way to catch the problem, but it is not easy.
I know this is not very useful now, but I wanted to respond to your ping.

Trizek-WMF changed the task status from Open to Stalled.Nov 20 2017, 3:32 PM

Thank you @Samat. If you experience that issue again, please immediately follow the instructions left on T153011#3614643 and report. That will help to solve the issue.

I put the task on hold for now.

The behavior just happened again (loading time was around 20 sec). Then I started the Developer tools to record, what happens, and for the second try it loaded after 1,2 sec. I really don't know how can I record and report the problem to you :/

@Samat, is it slow on all the wikis, or just on your home wiki (or just on certain wikis)?

I've been watching this ticket for some time and periodically doing some checkup on the performance of Special:Notifications page. The only thing I noticed - a slight increase in loading time when the # of msgs on Special:Notifications is big. And certainly, on reloading Special:Notifications page, the initial slowness should be gone.
@Samat Since no specific cause was identify for the page slowness, it would be great if you provide the info on the following:

  • the issue was filed for Firefox 49 and 50 on macOS Sierra 10.12.1. When you experienced the issue again (your last comment was on Nov 21) - on which browser/version you saw the issue? FF49 was known for general slowness.
  • how many (the total number) notifications you have?
  • @Trizek-WMF pointed to Help:Locating broken scripts - the page that has instructions on how to identify if user scripts or gadgets are causing problems. Have you tried the suggestions from there?
  • You can try to restart FF with "Restart with Add-ons disabled" to see if it makes Special:Notifications page loading time better. Although it's unlikely, there might be some addons to interfere with the page loading.

Thank you for both of your comment!

  • I think, this happens on other wikis as well, but recently I use mainly huwiki and metawiki.
  • I use always the latest (stable, released) version of FF. I use now FF 57. (Which is claimed as a huge improvement in speed performance with lower memory usage.)
  • I have 850 notifications, in total.

I start to better understand how the devtools works and where can I collect the necessary information.
In the last days I recorded several performance issues with the network tool where the loading time was between 10 and 50 second, but I created only screenshots of them.
This is offtopic in this ticket, but I would like to share with you an extreme example, where the loading time was over 160 second:

image.png (656×1 px, 62 KB)

I saved the har file of a 20 secs loading of the Special:Notifications now, but I would like to share it only privately/confidentially, because it is very likely contains some sensitive data about me. Who should I share with (using the Paste tool here)?

Thanks @Samat! I'll let @Catrope know about your last comment so he may suggest some additional steps.

Aklapper changed the task status from Stalled to Open.Dec 11 2017, 12:29 PM

I don't see any unanswered questions here hence resetting status from stalled to open.

So, if I run "related changes" on pretty much any page now, the top "filtering" section takes about ten seconds to load -- unless I'm not logged in, when it's fast enough not to notice. This is on MacOS 10.13.whatever as well as on Safari.

Hi @Jpgordon,

This is just a guess, but it sounds to me like you might want to spend a little time with https://www.mediawiki.org/wiki/Help:Locating_broken_scripts You might want to start with the &safemode=1 test.

@Jpgordon: Did Whatamidoing-WMF's recommendation help?

Well, running with "debug=true" makes the thing that loads slightly slowly

  • the filter thing on top of "related changes" -- load incredibly slowly;

without debug=true, it takes 4-5 seconds to load; with debug=true, it takes
more like 25 seconds. I am seeing several of these in the Firefox debugger

Source map error: request failed with status 400
Resource URL:
https://en.wikipedia.org/w/resources/lib/oojs-ui/oojs-ui-core.js?db4bf
Source Map URL: oojs-ui-core.js.map

Well, running with "debug=true" makes the thing that loads slightly slowly
-- the filter thing on top of "related changes" -- load incredibly slowly;
without debug=true, it takes 4-5 seconds to load; with debug=true, it takes
more like 25 seconds.

(Very slow loading of pages is the expected behavior with debug=true.)

I am seeing several of these in the Firefox debugger

Source map error: request failed with status 400
Resource URL:
https://en.wikipedia.org/w/resources/lib/oojs-ui/oojs-ui-core.js?db4bf
Source Map URL: oojs-ui-core.js.map

These warnings are harmless, but we should avoid them, I filed T194676 about this issue.

Well, running with "debug=true" makes the thing that loads slightly slowly

  • the filter thing on top of "related changes" -- load incredibly slowly;

without debug=true, it takes 4-5 seconds to load; with debug=true, it takes
more like 25 seconds. I am seeing several of these in the Firefox debugger

Hi @Jpgordon, thanks for reporting this,

It might be better to open a new task for this, since the current task is about Special:Notifications, and you seem to talk about Special:RecentChanges and Special:RecentChangesLinked, which are different systems (Despite being supported by the same team).

More to the point of what you're reporting -- debug=true means that all files are loaded non-minimized, which will make your loading a lot slower. What is preferable, is that you use safemode=1 in the URL; this will block any gadgets and user scripts to make sure that they don't interrupt with the loading. If the page loads significantly better with this on, then this is likely a script or gadget that is interfering with the loading time.

FYI: This just happened to me (Chrome on translatewiki.net), saw endless stripes, CPU fan started spinning, the page was very well frozen (pressing F12 to open developer toolbar did not do anything; clicking X to close the tab took multiple seconds). Worked swiftly after I opened the page again in a new tab.

I tried but was unable to reproduce this. For anyone who encounters this, could you please send us a performance trace to help us find the underlying cause? I'll update the task description with instructions.

I can't reproduce this in Firefox 63 on macOS 10.13.6. I don't know whether the problem was solved (for example, a user script that got fixed) or if it's specific to older versions of Firefox, but I don't remember seeing this for months.

If you still have the issue, please reopen.