Page MenuHomePhabricator

Central Notice message groups are slow to index
Closed, ResolvedPublic

Description

Goals

Approach

To test this, one needs to run ttmserver-export.php on a database with many banners and other groups (e.g. metawiki). However, that script alters the index, so running it on production index should be avoided. There are three main (non-exclusive) approaches:

Approach 1: setup a local testing environment.
– Requires work to setup
– Requires work to fill with data (and learning how the system works)
– May not sufficiently reflect the production environment
+ Most flexible debugging (no need to wait for deployments)
+ Very good thing to have for future issues

Approach 2: make the script non-destructive [CHOSEN]
– Possibly requires deployment (see below)
– Skips the ElasticSearch part (which probably doesn't matter)
+ Can test with production data

Approach 3: use testing index
– Requires config deployment
– Some reservations from Discovery (we don't want to accidentally cause troubles with production cluster)
+ Most realistic test case
+ Can test with production data

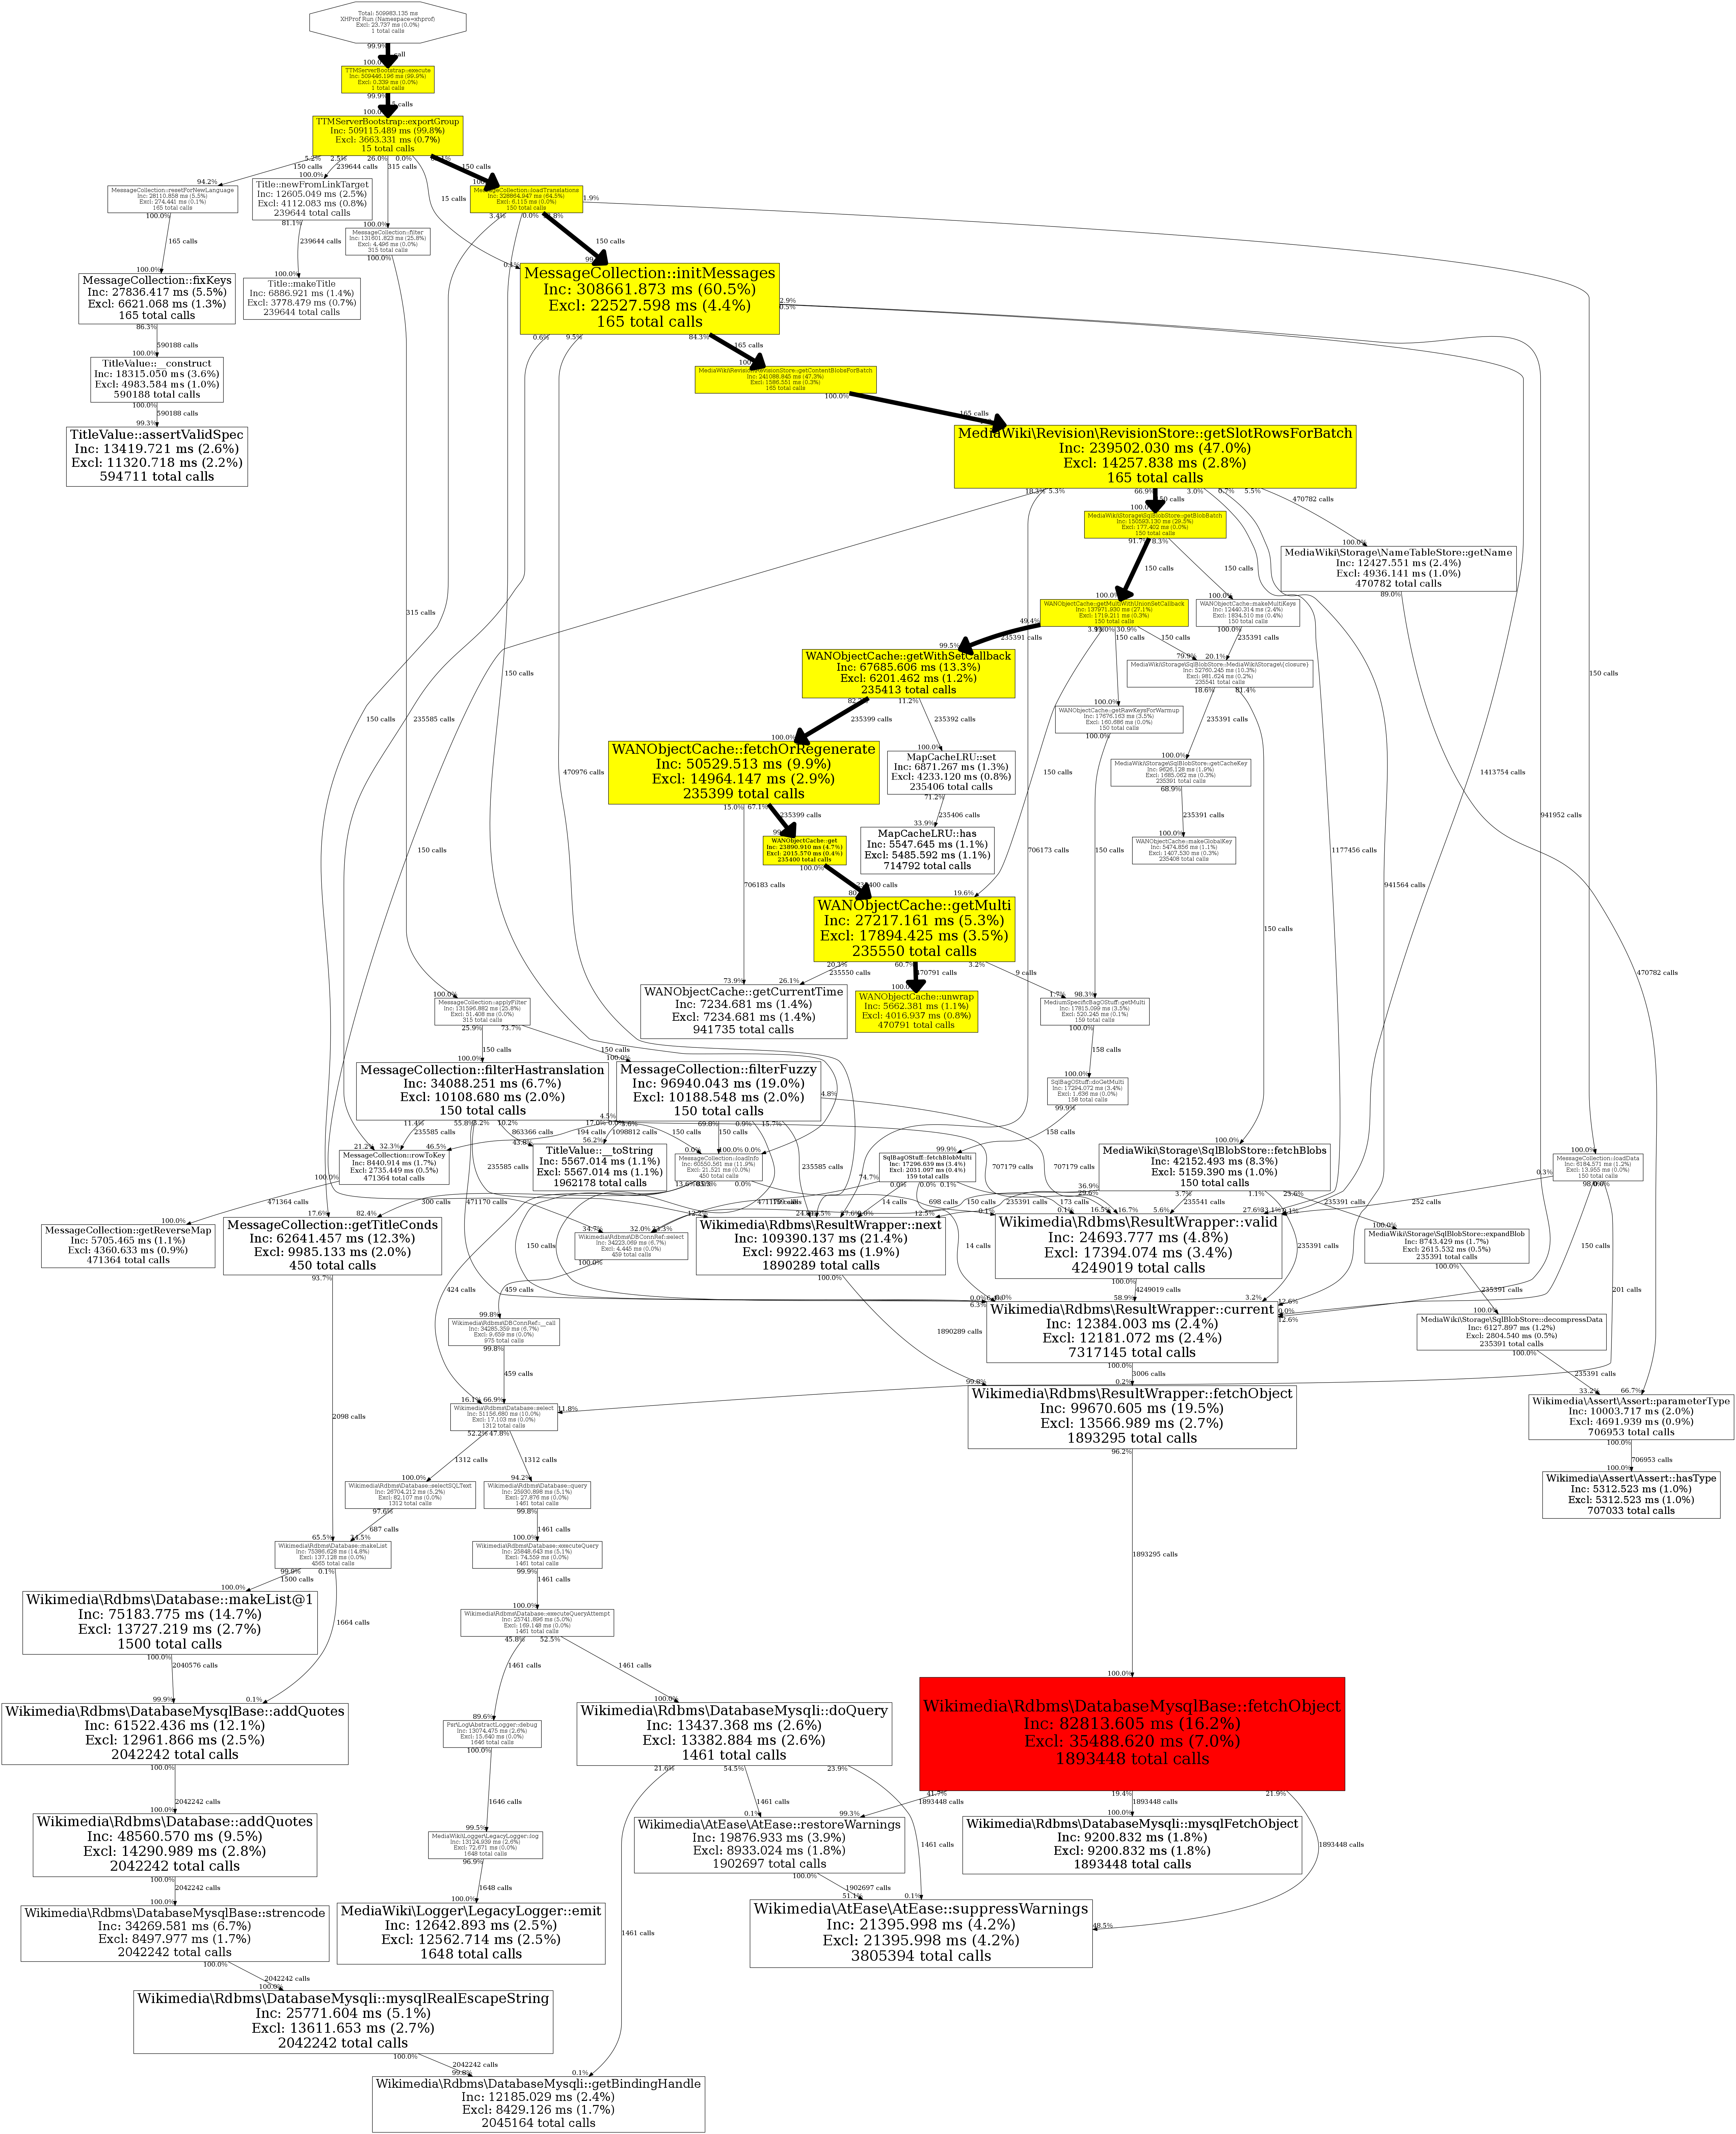
My suggestion is to start with approach 2, while adding some additional instrumentation to measure which part of the code may be slow. It may be possible to avoid deployment by creating a modified copy of the script on the maintenance server and requiring it from eval.php. If not, it has to go through Gerrit and normal deployments.

Original report

See P1968 for log. CN message groups alone about two hours to index, which is more than all other message groups across all sites.

There seems to be something blocking there, because even though I ran with 4 threads, only one of them seemed to be doing something at a time during CN groups. You can see this in the log by having bunch of groups complete (not shown in the log) at the same time, and new threads spawned for new groups at the same time (shown in the log).

Event Timeline

Nikerabbit raised the priority of this task from to Needs Triage.
Nikerabbit updated the task description. (Show Details)
Nikerabbit added subscribers: Nikerabbit, Amire80, greg.

You added me to CC so I assume this is High priority at least?

/me is just wondering why he was CC'd :)

Hi Greg, I was planning to send you an email but forgot. To put it short, I had some delay in beginning due to the script refusing to run. After that all went fine except reindexing meta took more than two hours so I went a quite bit of overtime of the allocated window. This issue is not urgent, but if not looked into I might require to ask 4h slot next time ;)

DStrine triaged this task as Medium priority.
DStrine moved this task from Sprint +1 to Blocked or not fr-tech on the Fundraising-Backlog board.

Hi @Nikerabbit, thanks for noticing this! We're happy to support your investigation in any way we can, it sounds like there's something wrong with the way we're using message groups, perhaps we're spamming or there's a problem with the index schema? Please let us know whatever you find and if we can do anything.

I am not working on this currently.

Change 566297 had a related patch set uploaded (by Nikerabbit; owner: Nikerabbit):
[mediawiki/extensions/Translate@master] ttmserver-export.php: add dry-run mode and additional debugging

https://gerrit.wikimedia.org/r/566297

Some initial debugging on testwiki:

Finished exporting Centralnotice-tgroup-CNBannerNamespace1. Total 0.2 s for 21 items >> stats/init/trans %: 19/70/10 >> 10.3 ms/item
Finished exporting Centralnotice-tgroup-CommonsApp. Total 0.2 s for 9 items >> stats/init/trans %: 20/75/4 >> 21.5 ms/item
Finished exporting Centralnotice-tgroup-FooBarBazKufuffal. Total 0.2 s for 3 items >> stats/init/trans %: 21/75/2 >> 62.2 ms/item
Finished exporting Centralnotice-tgroup-TestTranslateBanner. Total 0.3 s for 3 items >> stats/init/trans %: 16/59/23 >> 84.4 ms/item
Finished exporting Centralnotice-tgroup-WikiCon2016. Total 0.2 s for 0 items >> stats/init/trans %: 25/74/0 >> INF ms/item
Finished exporting Centralnotice-tgroup-fallbackBanner. Total 0.2 s for 6 items >> stats/init/trans %: 22/72/4 >> 30.8 ms/item
Finished exporting page-Advanced question settings. Total 0.3 s for 1040 items >> stats/init/trans %: 6/11/65 >> 0.3 ms/item
Finished exporting page-Finnish translation test. Total 0.1 s for 6 items >> stats/init/trans %: 22/11/10 >> 15.9 ms/item
Finished exporting page-MediaWiki:Inttest. Total 0.1 s for 2 items >> stats/init/trans %: 28/11/0 >> 43.9 ms/item
Finished exporting page-Muntesti. Total 0.1 s for 2 items >> stats/init/trans %: 24/11/0 >> 43.2 ms/item
Finished exporting page-Navigable TOC. Total 0.1 s for 17 items >> stats/init/trans %: 24/12/0 >> 5.1 ms/item
Finished exporting page-Ploppa. Total 0.1 s for 31 items >> stats/init/trans %: 18/11/25 >> 3.3 ms/item
Finished exporting page-Sandbox translation move test. Total 0.1 s for 6 items >> stats/init/trans %: 25/11/0 >> 15.3 ms/item
Finished exporting page-Stenella clymene. Total 0.1 s for 6 items >> stats/init/trans %: 28/11/0 >> 14.3 ms/item
Finished exporting page-Test de traduction bis. Total 0.1 s for 4 items >> stats/init/trans %: 24/13/0 >> 21.7 ms/item
Finished exporting page-Test suresh tran. Total 0.1 s for 12 items >> stats/init/trans %: 23/9/12 >> 9.8 ms/item
Finished exporting page-TestArticlePage. Total 0.1 s for 6 items >> stats/init/trans %: 26/10/0 >> 16.7 ms/item
Finished exporting page-TestWM2018. Total 0.1 s for 42 items >> stats/init/trans %: 25/15/0 >> 2.0 ms/item
Finished exporting page-Testing translate. Total 0.1 s for 3 items >> stats/init/trans %: 24/20/0 >> 31.5 ms/item
Finished exporting page-Traduire du français. Total 0.1 s for 4 items >> stats/init/trans %: 24/12/0 >> 21.7 ms/item
Finished exporting page-Translatable Page. Total 0.1 s for 3 items >> stats/init/trans %: 24/12/0 >> 28.5 ms/item
Finished exporting page-Translate from English. Total 0.1 s for 1 items >> stats/init/trans %: 27/12/0 >> 78.1 ms/item
Finished exporting page-Translate test. Total 0.2 s for 62 items >> stats/init/trans %: 13/6/44 >> 2.9 ms/item
Finished exporting page-Translate testing. Total 0.1 s for 2 items >> stats/init/trans %: 23/11/0 >> 43.0 ms/item
Finished exporting page-Trimp. Total 0.1 s for 18 items >> stats/init/trans %: 21/9/21 >> 6.2 ms/item
Finished exporting page-Tug44865. Total 0.8 s for 4360 items >> stats/init/trans %: 2/1/89 >> 0.2 ms/item
Finished exporting page-User:Base/Sitename grammar test. Total 0.1 s for 2 items >> stats/init/trans %: 23/12/0 >> 46.3 ms/item
Finished exporting page-User:DannyS712/translate. Total 0.1 s for 6 items >> stats/init/trans %: 30/10/0 >> 16.7 ms/item
Finished exporting page-User:Iniquity/sandbox. Total 0.1 s for 1 items >> stats/init/trans %: 24/12/0 >> 84.5 ms/item
Finished exporting page-User:Minorax/translation. Total 0.1 s for 4 items >> stats/init/trans %: 21/11/0 >> 25.1 ms/item
Finished exporting page-User:Samuele2002/sandbox/1. Total 0.1 s for 6 items >> stats/init/trans %: 23/11/0 >> 14.4 ms/item
Finished exporting page-User:Samuele2002/sandbox/2. Total 0.1 s for 4 items >> stats/init/trans %: 29/12/0 >> 21.6 ms/item
Finished exporting page-User:Samuele2002/sandbox/3. Total 0.1 s for 21 items >> stats/init/trans %: 18/10/18 >> 5.1 ms/item
Finished exporting page-Wikipedia:Create a new page. Total 0.1 s for 3 items >> stats/init/trans %: 24/12/0 >> 28.2 ms/item
Finished exporting page-Wikipedia:Requests/Tools. Total 0.1 s for 59 items >> stats/init/trans %: 23/13/0 >> 1.5 ms/item
Finished exporting page-Wikipedia:Sandbox/Please edit below this line. Total 0.1 s for 16 items >> stats/init/trans %: 20/9/11 >> 7.3 ms/item
Finished exporting page-Wikipedia:Test page. Total 0.1 s for 3 items >> stats/init/trans %: 26/14/0 >> 29.3 ms/item
Finished exporting page-Wikipedia:Test translation. Total 0.1 s for 8 items >> stats/init/trans %: 22/19/0 >> 12.5 ms/item
Finished exporting page-Wikipedia:Translation administrators. Total 0.1 s for 2 items >> stats/init/trans %: 21/14/0 >> 59.2 ms/item

These groups do not have much translations, so variance is huge. In this observation they are slightly slower (Centralnotice-tgoup-CNBannerNamespace1 10.3 ms/item) as opposed to similarly sized other message group (page-User:Samuele2002/sandbox/3 5.1 ms/item). Looking at the percentages, they spend a lot more time in the init phase. That mostly consists of ::initMessages which calls '::getDefinitions` which is implemented in the BannerMessageGroup as a loop over wfMessage( ... )->inContentLanguage(). wfMessage is supposed to be fast, though, and not slower than doing a DB query which is what the translatable pages do.

Change 566297 merged by jenkins-bot:
[mediawiki/extensions/Translate@master] ttmserver-export.php: add dry-run mode and additional debugging

https://gerrit.wikimedia.org/r/566297

Some logs from my local after merging Niklas' patch,

Without Xhprof

vagrant@vm:/vagrant/mediawiki$ php extensions/Translate/scripts/ttmserver-export.php --verbose --threads=0 --dry-run
 6753   0.88  14.0M  Implementation: FakeTTMServer
 6753   0.88  14.0M  Cleaning up old entries...
 6753   3.30  22.0M  Finished exporting out-mathjax-core. Total 0.2 s for 106 items >> stats/init/trans %: 12/3/83 >> 2.1 ms/item
 6753   3.37  22.0M  Finished exporting out-mathjax-tex. Total 0.1 s for 71 items >> stats/init/trans %: 39/59/0 >> 1.0 ms/item
 6753   3.45  22.0M  Finished exporting out-mathjax-mathmenu. Total 0.1 s for 84 items >> stats/init/trans %: 37/61/0 >> 0.9 ms/item
 6753   3.69  22.0M  Finished exporting out-mathjax-mathml. Total 0.2 s for 100 items >> stats/init/trans %: 20/3/76 >> 2.4 ms/item
 6753   3.73  22.0M  Finished exporting out-mathjax-helpdialog. Total 0.0 s for 11 items >> stats/init/trans %: 77/20/1 >> 3.4 ms/item
 6753   3.76  22.0M  Finished exporting out-mathjax-htmlccs. Total 0.0 s for 5 items >> stats/init/trans %: 84/13/1 >> 6.8 ms/item
 6753   3.80  22.0M  Finished exporting out-mathjax-fontwarnings. Total 0.0 s for 7 items >> stats/init/trans %: 82/15/1 >> 5.1 ms/item
 6753   3.95  22.0M  Finished exporting whowrotethat. Total 0.1 s for 67 items >> stats/init/trans %: 22/9/68 >> 2.2 ms/item
 6753 404.71  58.0M  Finished exporting core. Total 400.8 s for 273841 items >> stats/init/trans %: 0/0/99 >> 1.5 ms/item
 6753 404.71  58.0M  Optimizing...

With Xhprof

vagrant@vm:/vagrant/mediawiki$ php extensions/Translate/scripts/ttmserver-export.php --verbose --threads=0 --dry-run
 7037   0.53  14.0M  Implementation: FakeTTMServer
 7037   0.53  14.0M  Cleaning up old entries...
 7037   2.28  22.0M  Finished exporting out-mathjax-core. Total 0.2 s for 106 items >> stats/init/trans %: 15/4/80 >> 2.2 ms/item
 7037   2.37  22.0M  Finished exporting out-mathjax-tex. Total 0.1 s for 71 items >> stats/init/trans %: 41/58/0 >> 1.3 ms/item
 7037   2.47  22.0M  Finished exporting out-mathjax-mathmenu. Total 0.1 s for 84 items >> stats/init/trans %: 41/57/0 >> 1.2 ms/item
 7037   2.68  22.0M  Finished exporting out-mathjax-mathml. Total 0.2 s for 100 items >> stats/init/trans %: 25/3/70 >> 2.1 ms/item
 7037   2.73  22.0M  Finished exporting out-mathjax-helpdialog. Total 0.0 s for 11 items >> stats/init/trans %: 78/20/1 >> 4.4 ms/item
 7037   2.78  22.0M  Finished exporting out-mathjax-htmlccs. Total 0.0 s for 5 items >> stats/init/trans %: 86/12/1 >> 8.6 ms/item
 7037   2.82  22.0M  Finished exporting out-mathjax-fontwarnings. Total 0.0 s for 7 items >> stats/init/trans %: 83/15/1 >> 6.4 ms/item
 7037   3.19  22.0M  Finished exporting whowrotethat. Total 0.4 s for 67 items >> stats/init/trans %: 9/59/30 >> 5.5 ms/item
 7037 509.97  58.0M  Finished exporting core. Total 506.8 s for 273841 items >> stats/init/trans %: 0/0/99 >> 1.9 ms/item
 7037 509.98  58.0M  Optimizing...

Callgraph

callgraph-T111189.png (6×5 px, 2 MB)

Testing the patch on meta:

time mwscript extensions/Translate/scripts/ttmserver-export.php --wiki=metawiki --dry-run --verbose --threads=4 | tee ttmserver-export-cold.log
real    28m1.223s
user    25m45.660s
sys     8m21.480s

Will analyze the log file later.

The numbers do not seem reliable. For example I see this log line:
172061 213.92 46.0M Finished exporting Centralnotice-tgroup-asian_month_2019. Total 5.2 s for 41063 items >> stats/init/trans %: 0/1/97 >> 0.1 ms/item
But https://meta.wikimedia.org/wiki/Special:MessageGroupStats?group=Centralnotice-tgroup-asian_month_2019 shows only 438 message (of which 33 untranslated!)

It does not come from translation stats table:

wikiadmin@10.64.32.198(metawiki)> select count(*) from translate_groupstats where tgs_group = 'Centralnotice-tgroup-asian_month_2019'\G
*************************** 1. row ***************************
count(*): 450


wikiadmin@10.64.32.198(metawiki)> select sum(tgs_translated) from translate_groupstats where tgs_group = 'Centralnotice-tgroup-asian_month_2019'\G
*************************** 1. row ***************************
sum(tgs_translated): 428

So there must be an issue with the counting code.

Change 572624 had a related patch set uploaded (by Nikerabbit; owner: Nikerabbit):
[mediawiki/extensions/Translate@master] ttmserver-export.php: Fix counting of inserts

https://gerrit.wikimedia.org/r/572624

Change 572624 merged by jenkins-bot:
[mediawiki/extensions/Translate@master] ttmserver-export.php: Fix counting of inserts

https://gerrit.wikimedia.org/r/572624

Second run with my fix:

time mwscript extensions/Translate/scripts/ttmserver-export.php --wiki=metawiki --dry-run --verbose --threads=4 | tee ttmserver-export-cold-2020-02-20.log
real    24m36.384s
user    25m3.028s
sys     8m16.472s

Some quick stats:

Group typeCountCount-%Time¹Time-%Time per group²Time per item
Central notice275633 %194.9513%0.28 s13 ms³
Translatable page groups561767%1281.3387%0.91 s5 ms⁴

¹ Approximately, because it was run with four thread and there is a small overall startup overhead
² Time*4 / Count
³ Same as above, count from select sum(tgs_translated) from translate_groupstats where tgs_group like 'Centralnotice-tgroup-%'; = 60232
⁴ Same as above, count from select sum(tgs_translated) from translate_groupstats where tgs_group like 'page-%'; = 967653

Constant overhead for small groups seems to be like 70 ms. The central notice groups are on average very small, much smaller than translatable pages. This makes their time per item go up while Time-% is lower. If we would actually write to ElasticSearch, I assume that the overhead for small batches could be even a magnitude or two larger.

This leads me to believe that there currently isn't any performance issue with central notice groups, but rather they appear to be slow due to overhead of small groups. Only way to test this would be to actually write to ElasticSearch.

The bootstrap script could be improved to lump together small groups. We do not want to front-load calculating the overall stats, but we could query the stats table for stats in English and make batches of ~ 100 messages out of groups having less than 10 messages. On the other hand, a repair function–that would not delete everything before refilling–would be more useful as it would limit the user visible impact of rebuilds.