Page MenuHomePhabricator

donatewiki_counts and banner impressions missing in pgehres database
Closed, ResolvedPublic2 Estimated Story Points

Description

We track clicks from our emails through donate.wiki. Clicks are recorded using eventlogging and logged on pgehres, and can be viewed using this query (this is sample data from the last 24 hours):

select d.utm_source, sum(d.count) from donatewiki_counts d where utm_source like 'sp5505%' group by utm_source;

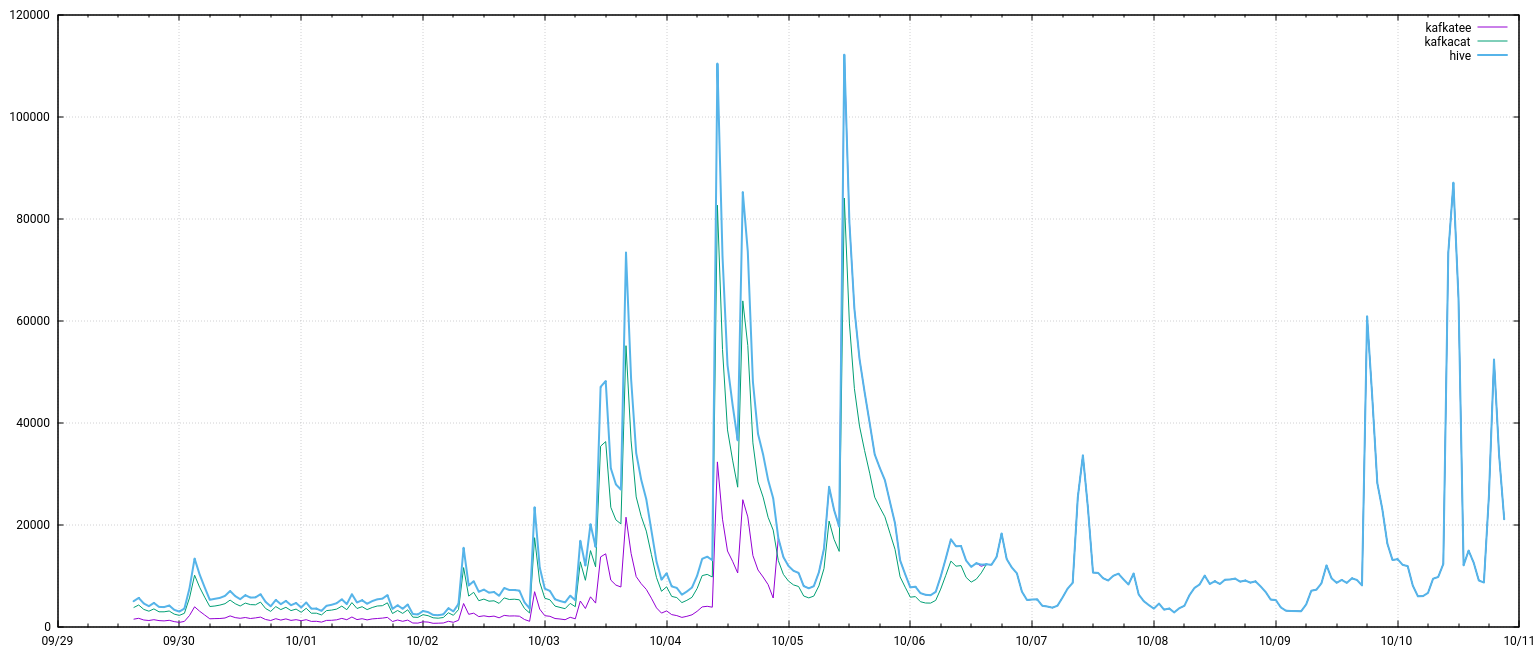
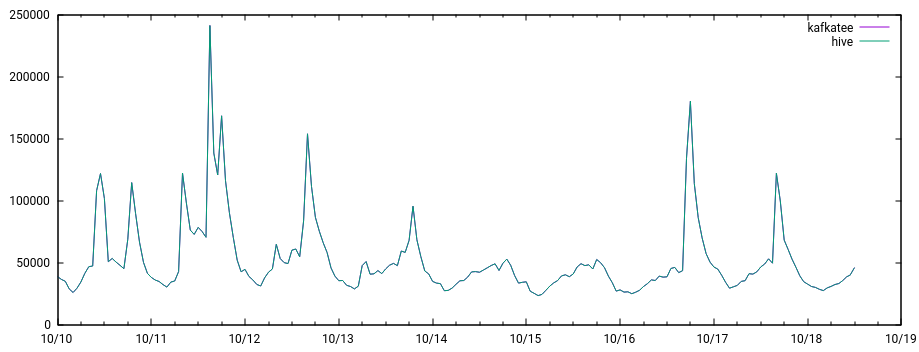
Since 9/28, the number of clicks counted has been less than the total number of donations, sometimes by a significant amount. See rows 35 and down, columns S and V:
https://docs.google.com/spreadsheets/d/196TfsBiSTHoWz56u6IuI4MZCnWleq6hsbHhGSrzkSQs/edit#gid=1050206810

This has applied broadly to all email stats since 9/28, using different languages and email templates, so I think there must be something broken on the landing page. Our Big English campaign just launched, and we really need all our data at our disposal. Can someone take a look at this?

Here is a sample email URL. The last 2 parameters were added for clicktracking:
https://donate.wikimedia.org/w/index.php?title=Special:LandingPage&country=US&uselang=&utm_medium=email&utm_source=sp55053343&utm_campaign=C1718_Email1&appeal=Appeal-JimmyQuote&hpc=%%highest_usd_amount%%&contact_id=%%CONTACTID%%&link_id=3

Event Timeline

There are a very large number of changes, so older changes are hidden. Show Older Changes

@Jgreen Could there be something wrong with the log collector? I'm seeing entries where a contact_id shows up in a referrer, but never in the GET url. For example:

zgrep 11838628 landingpages.tsv-20171003-18*

@CCogdill_WMF did you used to just link to

https://donate.wikimedia.org/?country=US&<otherparams>

Or have you been including /w/index.php in your links all along?

@Pcoombe and @MeganHernandez_WMF: There seem to be lines missing in the logs we use to feed the pgehres database, which is probably affecting banner stats too!

The lines are all still in the main Hive web logs, so nothing is permanently lost.

Hey @Ejegg I'm here and that last comment from you catches my eye! So would we be having the same issues as Caitlin - inaccurate click counts for banner tests, specifically? Anything else? And do you think it's been occurring since 9/28?

@spatton it's definitely possible. These would be the landing page counts in pgehres that are off. Any numbers you're pulling from contribution_tracking are still kosher. I'm not sure how long it's been going on, but @CCogdill_WMF says since at least the 28th.

Thank you for flagging and working on this @Ejegg

The lines are all still in the main Hive web logs, so nothing is permanently lost.

  • Does this mean we will be able to backfill data from the tests we have run since 9/29?

Thanks!

Thank you for flagging and working on this @Ejegg

The lines are all still in the main Hive web logs, so nothing is permanently lost.

  • Does this mean we will be able to backfill data from the tests we have run since 9/29?

Thanks!

Analytics buffers logs for 7 days, so at this point we should still be able to restore data that far back. We're still trying to figure out the root of the problem, will let you know as soon as we do.

Correction! Andrew Otto says we store it for 90 days in hadoop as well, although it is a little trickier to extract.

@spatton To clarify: the only thing stored in the pgehres database for banners is the impression numbers we pull on frdev1001. I'm not sure if those could be affected too, @Ejegg do you know?

The "click" numbers for banners are actually from a different database drupal.contribution_tracking so should be unaffected.

Here's the update--I think we've finally narrowed this down to a problem at kafka or possibly with kafka<->librdkafka, and it is not specific to americium. We're seeing dropped log message sequence numbers where they should be contiguous for each log producing host in production, and we're seeing that with kafkatee, kafkacat on americium and one of the stats boxes @Ottomata was using for comparison.

@Ottomata can you confirm that last statement, I thought we looked at this before and there was no lost data on analytics boxes consuming FR data from kafka, correct? Maybe there is an update from today i do not have.

@Pcoombe yes, the impression numbers are affected. Here's how I understand the pipeline works:

The main wiki cluster, including donatewiki, sends all their logs to Kafka.
Every 15 minutes we run kafkatee on americium, a machine in the fundraising cluster.
Kafkatee sends all the logs through a filter which looks for certain hostnames (donate.wikimedia.org and wikimediafoundation.org),
The filter writes the files to a directory readable from the Civi box
DjangoBannerStats also runs every 15 minutes, reading the files from the Kafkatee filter and calculating BOTH banner impressions and unique email clicks

The problem seems to be in getting the logs to americium, so everything downstream is affected.

Hmm, actually, I'm not sure what does the banner impressions sampling, now that I think about it. @Jgreen is that another kafkatee filter?

@Ottomata can you confirm that last statement, I thought we looked at this before and there was no lost data on analytics boxes consuming FR data from kafka, correct? Maybe there is an update from today i do not have.

@Ottomata and I investigated today and we find no indication that data is missing in kafka, but for some reason we were seeing up to 70% loss between kafka and logs finally written to disk on americium. That loss was consistent through some kafkatee restarts, regular kafkatee HUP to rotate logs, and through an americium reboot.

I looked closely at our output parser which is a trivial perl script. I found a minor bug that leaked a very small number of extra log lines to the output, but nothing that explains missing data. Also we have been using that parser since May with 0% loss until August, as compared to Hive.

What we thought was loss earlier today was a misinterpretation. Subsequent analysis revealed that whatever was causing loss stopped on 10/4 sometime between 21:00-22:00, and we have had 0% loss since. I don't have an explanation from the americium/kafkatee side, but I will keep looking for clues.

I added debug logging to our output parser, so we can look for sequence gaps at the pipeline just after kafkatee. If we start to see loss again that should help narrow down where it's happening.

Hmm, actually, I'm not sure what does the banner impressions sampling, now that I think about it. @Jgreen is that another kafkatee filter?

Maybe the beaconimpressions log, the one that's sampled at 10%?

@Jgreen Yep, that's the one. Is that created by another kafkatee filter on americium?

We're seeing dropped log message sequence numbers where they should be contiguous for each log producing host in production, and we're seeing that with kafkatee, kafkacat on americium and one of the stats boxes @Ottomata was using for comparison.

No, we were wrong about this. We were only missing sequence numbers at the beginning and end of consumption for high volume topics, which indicates that this is more about the timing of when librdkafka starts consuming from specific partitions in a topic. I think, if the volume is high enough, when you start consuming from the end of a topic, you'll get a large batch of messages from partition 0, then from partition 1, etc. If it takes enough time to consume that batch from partition 0, by the time you get to start from partition 1, it will start consuming messages from a later produce batch than the ones you got in partition 0. Since we produce sequence numbers to many different partitions, this would look like holes in sequence numbers near the beginning of your consume process.

Subsequent analysis revealed that whatever was causing loss stopped on 10/4 sometime between 21:00-22:00

Anyway, it's fixed now?! Ummm, weird.

BTW, dear FRtech team: we'd highly recommend refactoring your back end ingestion system. kafkatee was created for backwards compatibility mainly for your system over 3 years ago. There are much much better and more reliable ways to create and ingest streaming data than what you are doing. (If you don't know, you are transforming a JSON stream to a TSV stream, THEN filtering for a very small number of requests in a stream that has around 70K requests per second, THEN writing those requests to a log file, THEN rotating the log file every 15 minutes and SIGHUPing the consumer process (this could cause data loss now), THEN parsing the rotated file and inserting into MySQL.)

Thank you all for your work on this.

@Ejegg and @Jgreen Given that this issue was resolved on 10/4 (?) , are we able to backfill the data that was lost?

Yep, that seems incredibly indirect! For one of the end products of the script, we actually have everything built to pull the data straight from hive. I forget why we chose to use the script - maybe to avoid setting up another way to move things from not-payments-boxes to payments boxes.

For context, I just helped someone create a dataset based on webrequest data using an oozie job. It took me about three days. This would be slightly different because it's real-time, but we're talking days not weeks in terms of effort. And we're happy to help code/review the change, because like Andrew says, we could maybe sunset kafkatee support then.

Luca recommends as a general improvement that we upgrade librdkafka from 0.8.6 (stock Trusty) to 0.9.4 (in trusty Wikimedia).

Pcoombe renamed this task from Email click data not tracking properly to donatewiki_counts and banner impressions missing in pgehres database.Oct 11 2017, 8:58 PM

This seems likely to have been the cause of at least some of the recent banner impression count decreases we were seeing (tracked at T177653). Impression counts in pgehres do appear to be back up since October 4. @CCogdill_WMF are you seeing a similar recovery for the donatewiki counts?

A few remaining questions from the online fundraising side:

  • Can we narrow down when this began? It looks to me like the drop in banner impression counts started either September 26th or 27th.
  • Can we backfill the missing data? Feel free to make a new task if that's better.

I'm not technically aware enough to comment on changing the processing for this data, but I am wary about large changes being made close to the Big English Fundraiser.

Yes, click rates look much more normal now. I want to confirm for sure once
the frFR data comes in today, since I haven't been able to compare against
the same countries where we had the stats problems.

9/28 is the first date we updated stats and noticed a problem.

This seems likely to have been the cause of at least some of the recent banner impression count decreases we were seeing (tracked at T177653). Impression counts in pgehres do appear to be back up since October 4. @CCogdill_WMF are you seeing a similar recovery for the donatewiki counts?

A few remaining questions from the online fundraising side:

  • Can we narrow down when this began? It looks to me like the drop in banner impression counts started either September 26th or 27th.

Here's what we think so far, by comparing hourly page counts for donate.wikimedia.org from banner logs vs from Hive:

up to and including 8/1/17: 0% loss
9/1 started at 12% and crept up to 17%
9/16 - 9/25 sustained 28-30% loss
9/26 started at 30%, ended at 70% loss
9/27-10/4 sustained 70-71% loss
10/4 sometime around 21:00 UTC complete recovery
10/5 0%
I haven't had a chance to check the past few days.

  • Can we backfill the missing data? Feel free to make a new task if that's better.

Yes. Casey is currently working on 9/29- which we can recover with one method. For logs before the 29th we have to extract them from Hive/Hadoop which requires help from analytics.

I'm not technically aware enough to comment on changing the processing for this data, but I am wary
about large changes being made close to the Big English Fundraiser.

I totally agree--there are no plans to make any changes in the near-term, that would be post fundraiser project.

For logs before the 29th we have to extract them from Hive/Hadoop which requires help from analytics.

users with cluster permits can execute selects to get logs, if you need help on how those selects should look we are available to help, ping us on wikimedia-analytics @AndyRussG is familiar with the data stored/how to query it.

Cool, thank you!

More detail on the beginning and end of the loss:

8/4 is where I first see evidence of loss, it was about 9% for the 8/4 and fluctuated mostly between 0-10% until the 8th with a couple hours of 60%. Then clean until 8/29 and it started again.

I ran numbers up to today at 20:00 UTC and there is still no loss since 10/4.

@Pcoombe: @Jgreen did some comparisons with hive data, and it looks like the problem started in early August. I did some other comparisons, and found evidence of a problem as far back as August 7th or 8th. The percentage of impressions lost jumped dramatically in late September.

Here are some measurements of percentage lost per day from Jeff's comparisons:
20170801 0
20170901 12
20170916 29
20170917 30
20170918 30
20170919 29
20170920 30
20170921 29
20170922 30
20170923 30
20170924 30
20170925 30
20170926 30
20170927 70
20170928 70
20171001 69
20171002 70
20171003 71
20171004 71
20171005 0
20171006 0

@Ejegg @Jeff_G could we scrape entirely the kafkatee system and just do the counting on analytics side then? We have a job that calculates impressions of banner data realtime , it can calculate hist to donatewiki just as well

Are there aany other systems that ingest this data? (cc @Ottomata )

See banner impressions: http://bit.ly/2kHycEh

I think they're doing more interesting analysis of banner and click-through data, not just hit counts. Also the delay before hadoop/hive produces results may be an issue, I don't know.

I think they're doing more interesting analysis of banner and click-through data, not just hit counts. Also the delay before hadoop/hive produces results may be an issue, I don't know.

This is real time data, not delayed.

I think they're doing more interesting analysis of banner and click-through data, not just hit counts

@Ejegg can you describe whether they are any consumers of this data/ what is it done with it?

Kafkacat and kafkatee both appear to have loss as compared to hive, but different degrees at different times. So I suspect the problem is in transmission between kafka and kafkatee, and not the output filters or data missing from kafka.

This graph shows hit counts for 'donate.wikimedia.org' only. The kafkatee line is extracted from what the americium banner pipeline originally collected. The kafkacat line is from kafkacat collected on alnitak (at codfw), which we were trying to use to backfill from 9/29 forward; here we're parsing JSON and filtering on the hostname match.

kafkatee_vs_kafkacat_vs_hive.png (314×700 px, 46 KB)

Updated graph, correcting an apparent dip in the kafkatee line on 10/6, which was an artifact of splicing data together and not actually in the data.

kafkatee_vs_kafkacat_vs_hive.png (654×1 px, 108 KB)

Hi @Nuria, those three tables are queried by the fundraising creative team (yup, they know SQL!) to inform adjustments to banner and email content and targeting on the fly during campaigns, and to generate statistics on effectiveness after each campaign is over.

OK, sounds like the users DO have a bunch of scripts that compare these stats in a single database. There's still willingness to consider other workflows, just not before the end of the year.

@Ejegg understood, it is worth thinking that we have already infrastructure in place that processes events at a scale so maybe on your end you can start a project (geared towards next year) to use it to your benefit, we can help and also we can get jobs started that measure click through so you have those available, those are easy ones for us to tackle

Here's a graph of the recovery on 10/4:

kafkatee_recovery.png (511×957 px, 44 KB)

Note I restarted kafkatee at 19:58 to fix an overreporting bug in weblog-filter, that's long enough before the actual recovery that I think it's probably not related.

@Ejegg it looks like the problem has come up again. I'm getting more donations than clicks for utm_source LIKE 'sp5155%'

Let me know if you need more info.

@Ejegg it looks like the problem has come up again. I'm getting more donations than clicks for utm_source LIKE 'sp5155%'

Let me know if you need more info.

The landingpages pipeline still looks healthy up to as far as hive goes at the moment (13:00 UTC), based on a comparison from 10/11 onward.

Here's the latest hive vs kafkatee comparison

kafkatee_vs_hive_10.10_to_10.18.png (352×919 px, 34 KB)

I'm not seeing a significant decrease in the banner impression counts in pgehres.

The clicks do not look as low as they did a couple weeks ago, but I checked
and they are still lower than the total # of donations across the board for
the emails that went out yesterday. I'm not sure how else to make sense of
that...

Do you want to see my queries?

@CCogdill_WMF I get more clicks than donations, but only by 25% or so. Is this an impossibly high completion ratio?

Donations:
select count(*) from drupal.contribution_tracking where utm_source like 'sp5515%' and contribution_id is not null;
42686

Clicks:
select count(*) from pgehres.donatewiki_unique where utm_source like 'sp5515%';
54352

@Ejegg: Can you explain (out of curiosity) how clicks on banners can identified on hive data?

@Nuria we count banner impressions (or skipped impressions due to the user having seen too many already) via calls to /beacon/impression in the CentralNotice code. For clicks on fundraising banners, we at least send the banner history log to EventLogging using cn.bannerHistoryLogger.ensureLogSent.

I think the fundraising creative team might be using entries in the contribution_tracking table on the payments DB to count clicks, though - one of those entries is created for every user that lands on payments-wiki.

Hey @Ejegg thanks for your queries, and apologies it took me a couple days. Working across time zones in our big creative sprint time is hard!

I'm able to see now at least one place where things are breaking down, though I don't know enough about our database schema to figure out why. contribution_tracking is returning significantly lower donation counts than the queries I run in ecom. For example:

select count(*) from drupal.contribution_tracking where utm_source like 'sp5518%' and contribution_id is not null;
OUTPUT: 16818

(removing null parameter)
select count(*) from drupal.contribution_tracking where utm_source like 'sp5518%';
OUTPUT: 22153

./ecom -s 20170701000000 -e 20171031000000 --substring=sp5518 -g b -- raw
COMBINED OUTPUT OF VALUES IN COLUMN "DONATIONS": 24886

These differences are very concerning to me. I'm hoping I can trust ecom because it is in line with the donations/emails rate I expect to see (and it's the most money, obviously). But we rely pretty heavily on contribution_tracking so that's worrisome. Additionally, if ecom is right, pgehres is still off because I get 22588 clicks, vs 24886 donations.

@jrobell has a call with CPS in about an hour and I'm going to ask her to have them poke into this. Please let me know if it would be helpful to talk this through with me on a call. Thanks!

cc @Pcoombe if you have a moment to take a look at this, maybe you can talk me through what I'm seeing?

(Apologies, I had some copy+paste errors with those queries, but reran them and ensured those you are seeing above are correct)

@CCogdill_WMF shoot, I'm not very familiar with the ecom scripts. I'll try to get up to speed on where those numbers come from.

Great, thanks! Even if ecom is somehow wrong (I hope not!) the apparently
huge number of donations in contribution_tracking with NULL contribution_id
makes me nervous...

You can see the query ecom is using by adding --sql to the end of the command.

I think that ecom actually is double counting some donations, and it's related to the joins to the address tables.

FROM drupal.contribution_tracking ct
LEFT JOIN civicrm.civicrm_contribution cc ON ct.contribution_id = cc.id
LEFT JOIN civicrm.civicrm_address ca ON cc.contact_id = ca.contact_id
LEFT JOIN civicrm.civicrm_country co ON ca.country_id = co.id

The criterion AND (ca.is_primary=1 OR ca.is_primary IS NULL) is supposed to prevent double counting due to that, but apparently isn't doing so correctly. Removing these joins gives numbers which match those from the simple contribution_tracking queries.

Have we changed something about storing is_primary recently?

Ejegg set the point value for this task to 2.Jul 25 2019, 2:40 PM