Page MenuHomePhabricator

Analyze results of page issues A/B test
Closed, ResolvedPublic

Description

Acceptance criteria

Analyze the page issues A/B test results with a focus on answering the following questions:

Does the new treatment for page issues increase the awareness among readers of page issues?

  • Is there an increase in clickthrough based on the new issue treatments (from the article page to the issues modal, from the issues modal to anywhere else - details about issues type, modal dismissed, etc, i.e. where do people go after the modal)?
  • Does clickthrough depend on the severity of each issue?
  • Do mobile edits increase with page issues as referrer?
    • Do they increase more or less for anons or editors, for editors per bucket?
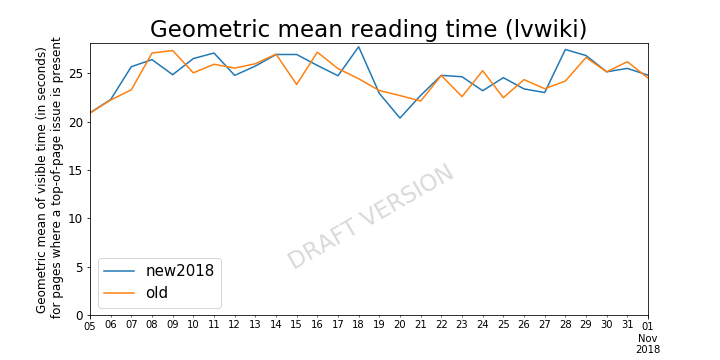
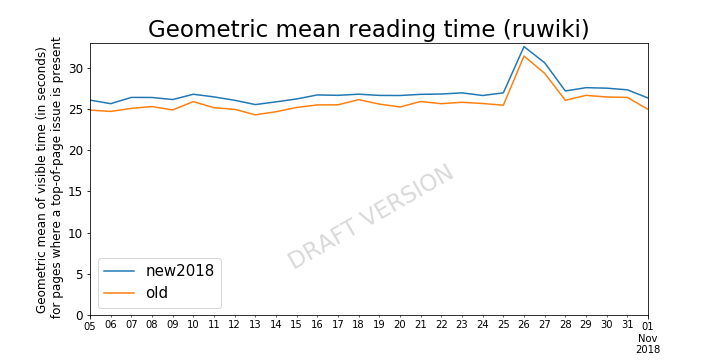
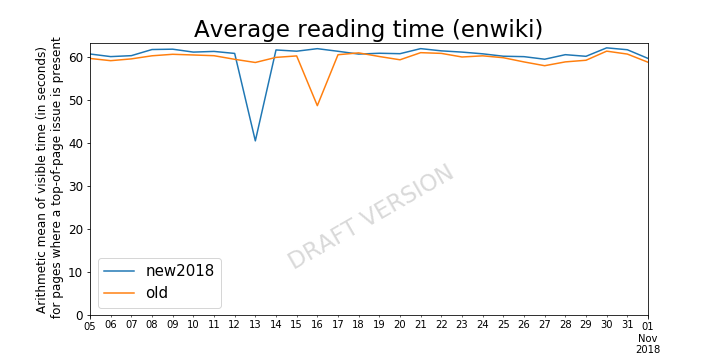
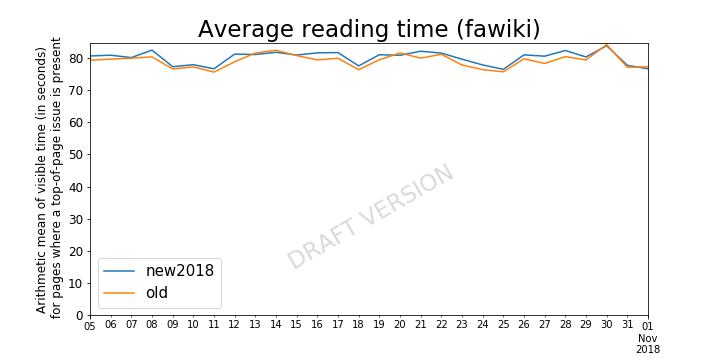
  • Do page issues affect the time spent on each page?
  • What is the approximate percentage of (mobile) pageviews to pages with issues on (select languages)?
Related Objects

StatusSubtypeAssignedTask
ResolvedJdlrobson
ResolvedJdlrobson
Resolvedovasileva
Resolved alexhollender_WMF
Resolvedovasileva
Resolvedovasileva
Resolvedphuedx
Resolved Tbayer
Resolvedovasileva
Resolved Niedzielski
Resolved Tbayer
Resolved Tbayer
Resolved Tbayer
Resolved Tbayer
Resolvedovasileva
Resolved Tbayer
Resolvedphuedx
Resolvedovasileva
ResolvedJdlrobson
ResolvedJdlrobson
Resolved Tbayer
Resolved Tbayer
Resolved Niedzielski
DeclinedNone
Resolvedovasileva

Event Timeline

ovasileva triaged this task as Medium priority.Jul 31 2018, 1:20 PM
ovasileva created this task.
Restricted Application added a subscriber: Aklapper. · View Herald Transcript

We extended this test to run until next week (to get more data in particular regarding the questions added in T200794#4661887 - might still not be enough to detect changes reliably, but we'll have a better chance). In the meantime, recording some quick preliminary results here that @ovasileva and I looked at the other day:

Clickthrough rates (for page-level issue notes) were much lower than (at least I) expected to begin with in the old treatment, and increased markedly with the new treatment.[1] On the other hand, the new treatment does not appear to have increased edit rates.[2]
Will publish a fuller report after the end of the test, also about the other questions.

[1]

SELECT wiki, event.issuesVersion AS version, 
ROUND(100*SUM(IF(event.action = 'issueClicked', 1, 0))/SUM(IF(event.action = 'pageLoaded', 1, 0)),2) AS issues_clickthrough_ratio,
SUM(IF(event.action = 'pageLoaded', 1, 0)) AS pageloaded_events
FROM event.pageissues 
WHERE year = 2018 AND month = 10 AND day =5 AND day <= 25
AND event.sectionnumbers[0] = 0
GROUP BY wiki, event.issuesVersion
ORDER BY wiki, version LIMIT 10000;


wiki	version	issues_clickthrough_ratio	pageloaded_events
enwiki	new2018	0.48	1368370
enwiki	old	0.12	1384509
fawiki	new2018	0.79	232671
fawiki	old	0.23	233577
jawiki	new2018	0.36	2382182
jawiki	old	0.08	2425740
lvwiki	new2018	0.24	2912
lvwiki	old	0.08	2657
ruwiki	new2018	0.53	407005
ruwiki	old	0.07	412372
[2]
SELECT wiki, event.issuesVersion AS version, 
ROUND(100*SUM(IF(event.action = 'editClicked', 1, 0))/SUM(IF(event.action = 'pageLoaded', 1, 0)),2) AS edit_clickthrough_ratio,
SUM(IF(event.action = 'pageLoaded', 1, 0)) AS pageloaded_events
FROM event.pageissues 
WHERE year = 2018 AND month = 10 AND day =5 AND day <= 25
AND event.sectionnumbers[0] = 0
GROUP BY wiki, event.issuesVersion
ORDER BY wiki, version LIMIT 10000;


wiki	version	edit_clickthrough_ratio	pageloaded_events
enwiki	new2018	0.37	1368370
enwiki	old	0.39	1384509
fawiki	new2018	0.42	232671
fawiki	old	0.41	233577
jawiki	new2018	0.56	2382182
jawiki	old	0.57	2425740
lvwiki	new2018	0.69	2912
lvwiki	old	0.38	2657
ruwiki	new2018	0.43	407005

[Edit: Note that this query was for a single day of data only (there's a typo above), and the results had not yet been vetted or assessed for significance.]

And to calculate the clickthrough rate changes from above directly:
Issue clickthroughs increased 3-8x (depending on project), clicks on the main edit button only slightly increased or even decreased depending on project, with lvwiki as an apparent outlier.

SELECT wiki,
(SUM(IF(event.action = 'issueClicked' AND event.issuesVersion = 'new2018', 1, 0))/SUM(IF(event.action = 'pageLoaded' AND event.issuesVersion = 'new2018', 1, 0)))
/(SUM(IF(event.action = 'issueClicked' AND event.issuesVersion = 'old', 1, 0))/SUM(IF(event.action = 'pageLoaded' AND event.issuesVersion = 'old', 1, 0)))
AS issues_clickthrough_ratio_change
FROM event.pageissues 
WHERE year = 2018 AND month = 10 AND day =5 AND day <= 25
AND event.sectionnumbers[0] = 0
GROUP BY wiki
ORDER BY wiki LIMIT 10000;


wiki	issues_clickthrough_ratio_change
enwiki	3.8963954121935758
fawiki	3.4464536288048704
jawiki	4.36110353204104
lvwiki	3.1935096153846154
ruwiki	7.761796763854968
SELECT wiki,
(SUM(IF(event.action = 'editClicked' AND event.issuesVersion = 'new2018', 1, 0))/SUM(IF(event.action = 'pageLoaded' AND event.issuesVersion = 'new2018', 1, 0)))
/(SUM(IF(event.action = 'editClicked' AND event.issuesVersion = 'old', 1, 0))/SUM(IF(event.action = 'pageLoaded' AND event.issuesVersion = 'old', 1, 0)))
AS edit_clickthrough_ratio_change
FROM event.pageissues 
WHERE year = 2018 AND month = 10 AND day =5 AND day <= 25
AND event.sectionnumbers[0] = 0
GROUP BY wiki
ORDER BY wiki LIMIT 10000;

wiki	edit_clickthrough_ratio_change
enwiki	0.9530882623283146
fawiki	1.0154088560758898
jawiki	0.9794839602389783
lvwiki	1.8248626373626373
ruwiki	0.9942216485694446

I'm still writing up a more detailed report, but to record outcomes regarding the two main questions here already:

  • As had already been observed above based on the earlier, preliminary data, the clickthrough ratio (for top-of-page issues notices) increased markedly with the new treatment on all five wikis (over 7x on ruwiki). We can confidently assume that the new design increases the awareness of page issues among readers.
  • In the data from the full experiment we still see a slight drop in edit button clickthroughs for (now) four of the five wikis [1] - albeit smaller than enwiki's drop in the earlier, preliminary data that had given rise to some concern then. Our earlier hypothesis that the new design incentivizes more edits with the purpose of fixing the announced issues can thus be rejected. As for whether there might even be a detrimental effect, we consider that unlikely at the moment, in the absence of a clear explanation of a mechanism that could cause this (keeping in mind that what we could measure here are only taps on the button, not finished edits, so the observed effect might e.g. only impact unintentional taps). But it is something to remain aware of. I will post more detailed results later, but the change was statistically significant for enwiki and not significant for lvwiki, the only increase.)

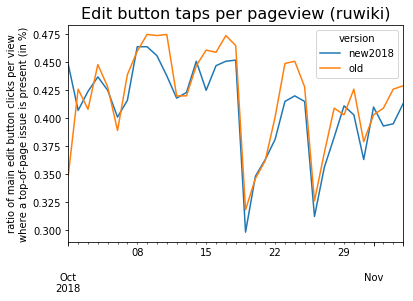
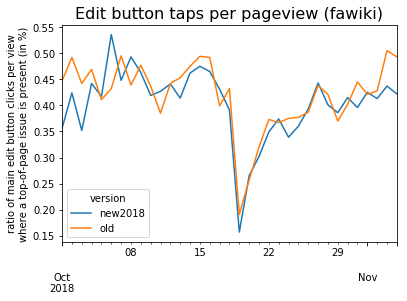
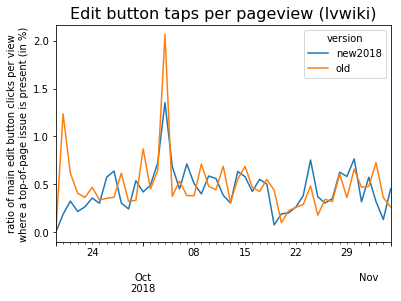
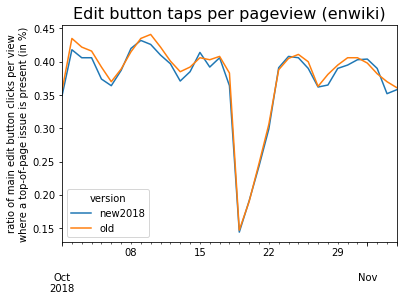
Also, the ratio saw large changes over time during the experiment for both test and control (i.e. not due to the page issues feature). I started investigating this e.g. by looking at CentralNotice logs, but haven't found an explanation yet:

Edit button taps per pageview enwiki.png (301×407 px, 28 KB)

Edit button taps per pageview jawiki.png (301×401 px, 24 KB)

Edit button taps per pageview ruwiki.png (301×413 px, 34 KB)

Edit button taps per pageview fawiki.png (301×407 px, 31 KB)

Edit button taps per pageview lvwiki.png (301×401 px, 32 KB)

[1]
SELECT wiki,
(SUM(IF(event.action = 'editClicked' AND event.issuesVersion = 'new2018', 1, 0))/SUM(IF(event.action = 'pageLoaded' AND event.issuesVersion = 'new2018', 1, 0)))
/(SUM(IF(event.action = 'editClicked' AND event.issuesVersion = 'old', 1, 0))/SUM(IF(event.action = 'pageLoaded' AND event.issuesVersion = 'old', 1, 0)))
AS edit_clickthrough_ratio_change
FROM event.pageissues 
WHERE year = 2018
AND ((month = 10 AND day >=5) OR (month = 11 AND day = 1))
AND event.sectionnumbers[0] = 0
GROUP BY wiki
ORDER BY wiki LIMIT 10000;


wiki	edit_clickthrough_ratio_change
enwiki	0.9854330282194743
fawiki	0.988606839482496
jawiki	0.9908068487665987
lvwiki	1.0736709368487447
ruwiki	0.9700330697087468

@Agusbou2015: When this task is done (as for any open task). In the future, please ask questions which are more specific - thanks!

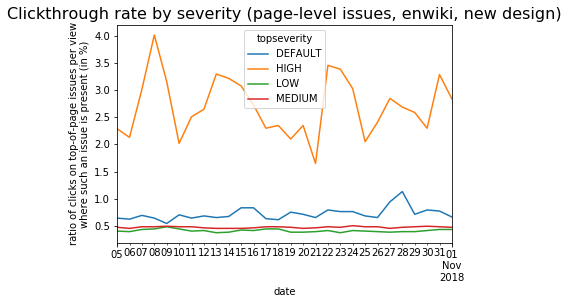
Here is some data on the question "Does clickthrough depend on the severity of each issue?", for page-level issues in the new design on enwiki (recall that the severity level data is assumed to be only valid on enwiki, and that the old design doesn't reveal the severity level before clicking on the issue notice).

severityissues clickthrough ratio (%)pageviews
HIGH2.7059811
DEFAULT0.731912273
MEDIUM0.4732501465
LOW0.414924836

Or as a daily time series:

Clickthrough rate by severity (page-level issues, enwiki, new design).png (304×569 px, 34 KB)

(The chart for "HIGH" is much noisier as it is based on a smaller number of pageviews.)

Data via:

SELECT event.issuesseverity[0] AS topseverity,
ROUND(100*SUM(IF(event.action = 'issueClicked', 1, 0))/SUM(IF(event.action = 'pageLoaded', 1, 0)),2) AS issues_clickthrough_ratio_pc,
SUM(IF(event.action = 'pageLoaded', 1, 0)) AS pageloaded_events
FROM event.pageissues 
WHERE year = 2018 AND 
((month = 10 AND day >=5) OR (month = 11 AND day = 1))
AND wiki = 'enwiki'
AND event.sectionnumbers[0] = 0
AND event.issuesVersion = 'new2018'
GROUP BY event.issuesseverity[0]
ORDER BY topseverity LIMIT 10000;

SELECT year, month, day, 
CONCAT(year,'-',LPAD(month,2,'0'),'-',LPAD(day,2,'0')) AS date, 
event.issuesseverity[0] AS topseverity,
ROUND(100*SUM(IF(event.action = 'issueClicked', 1, 0))/SUM(IF(event.action = 'pageLoaded', 1, 0)),2) 
AS issues_clickthrough_ratio_pc,
SUM(IF(event.action = 'pageLoaded', 1, 0)) AS pageloaded_events
FROM event.pageissues 
WHERE year = 2018 AND 
((month = 10 AND day >=5) OR (month = 11 AND day = 1))
AND wiki = 'enwiki'
AND event.sectionnumbers[0] = 0
AND event.issuesVersion = 'new2018'
GROUP BY year, month, day, event.issuesseverity[0]
ORDER BY year, month, day, topseverity LIMIT 10000;

Regarding the question "where do people go after the modal", here are the clickthrough rates for four kinds of links shown in the modal. Unsurprisingly the "X" to close the modal is the most frequently used one. Internal links (e.g. to https://en.m.wikipedia.org/wiki/Wikipedia:Neutral_point_of_view from the POV template modal on enwiki) are fairly popular too, with large variation between the five wikis in the test.

Keep in mind that

  • this measures the usage of modal link clicks to modal opens overall, not the clickthrough rate of that particular link per se relative to how often it appeared. In particular, red links (e.g. to nonexisting article talk pages) show up rarely in the first place.
  • Because we are one step down the funnel already, differences between the old and new design also take into account the increased clickthrough rate for the issues modal per se (see above or the right column in the table). E.g. the new design overall leads to more modal edit link clicks on enwiki.
wikiversionred_links %internal_links %modal_edit_links %modal_closes %issue_clicks
enwikinew20180.0210.191.6029.27223152
enwikiold0.0214.652.4025.6045671
fawikinew20180.048.760.7318.6451947
fawikiold0.027.130.2519.2012290
jawikinew20180.074.211.2321.56339062
jawikiold0.238.180.5724.5859103
lvwikinew20180.994.963.3729.56504
lvwikiold1.009.002.0029.00100
ruwikinew20180.1210.970.7025.25115331
ruwikiold0.2116.800.9927.348570

(Note: we are not accounting for the possibility of multiple clicks from the same modal here, assuming that e.g. users open such links in a new tab rarely enough on mobile so as not to affect these results materially. Otherwise we would have needed to complicate the instrumentation further by adding another token for the funnel.)

Data via

SELECT wiki, event.issuesVersion AS version, 
ROUND(100*SUM(IF(event.action = 'modalRedLinkClicked', 1, 0))/SUM(IF(event.action = 'issueClicked', 1, 0)),2) 
  AS red_links,
ROUND(100*SUM(IF(event.action = 'modalInternalClicked', 1, 0))/SUM(IF(event.action = 'issueClicked', 1, 0)),2) 
  AS internal_links,
ROUND(100*SUM(IF(event.action = 'modalEditClicked', 1, 0))/SUM(IF(event.action = 'issueClicked', 1, 0)),2) 
  AS modal_edit_links,
ROUND(100*SUM(IF(event.action = 'modalClose', 1, 0))/SUM(IF(event.action = 'issueClicked', 1, 0)),2) 
  AS modal_closes,
SUM(IF(event.action = 'issueClicked', 1, 0)) AS issue_clicks
FROM event.pageissues 
WHERE year = 2018 AND 
((month = 10 AND day >=5) OR (month = 11 AND day = 1))
GROUP BY wiki, event.issuesVersion
ORDER BY wiki, version LIMIT 10000
This comment was removed by Agusbou2015.

To clarify, the reason it is still marked as draft is that things may still be added. It fine to rely on the information that's already there (which includes the answers to the main questions that informed the decision to deploy).

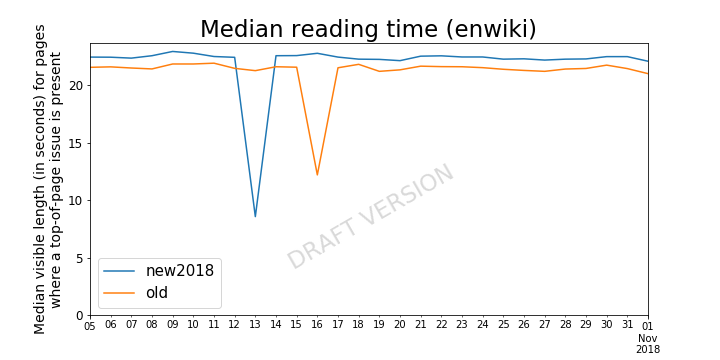
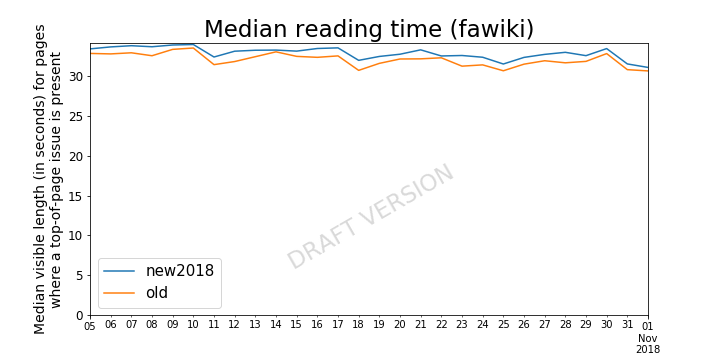
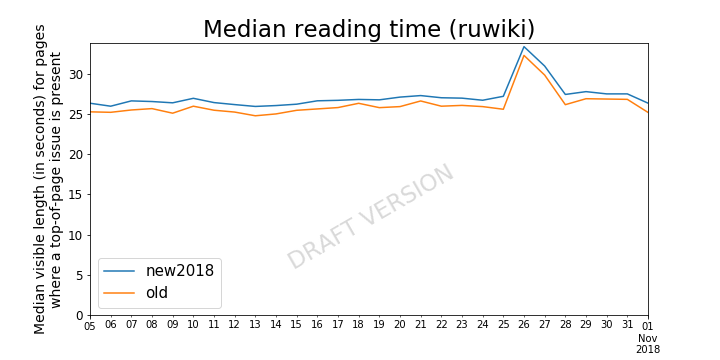
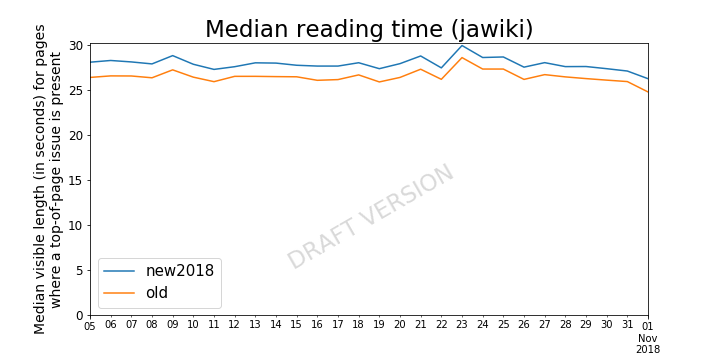
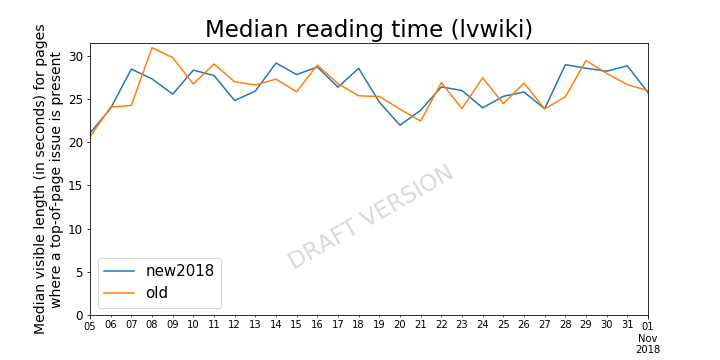
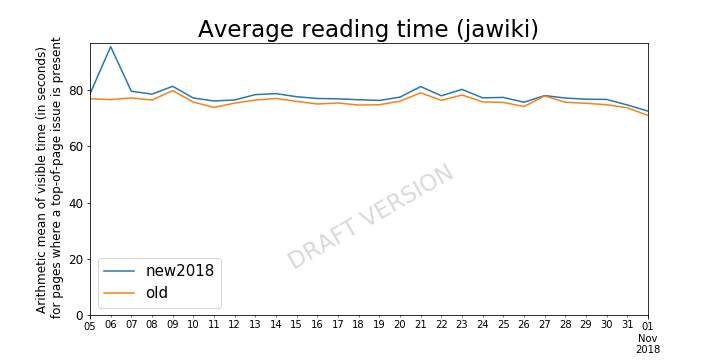
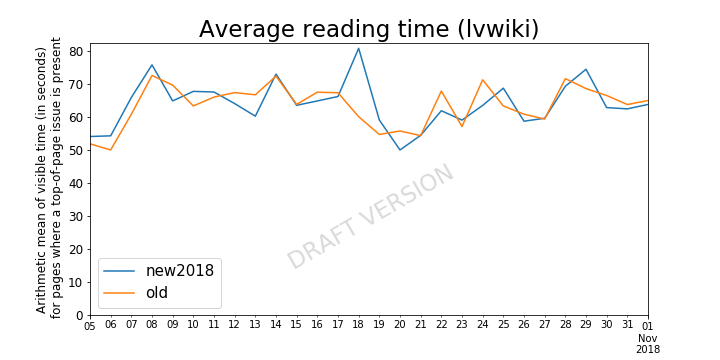
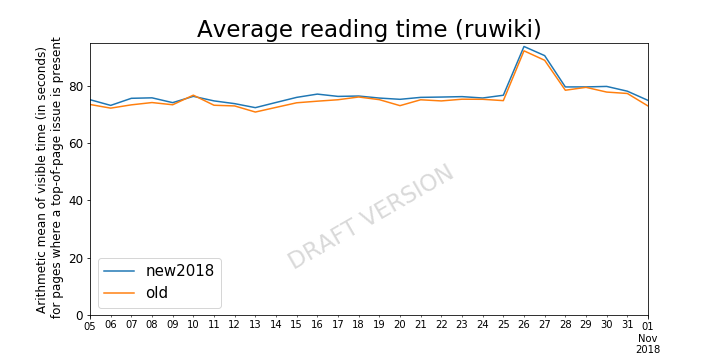
I have been working on the "time spent on each page" question (which, again, has not been one of the success metrics here - rather, this is basically the first test drive of the new Reading Time metrics now that this data has been vetted and explored recently in the research project @Groceryheist has been working on , see https://meta.wikimedia.org/wiki/Research:Reading_time/Draft_Report ).

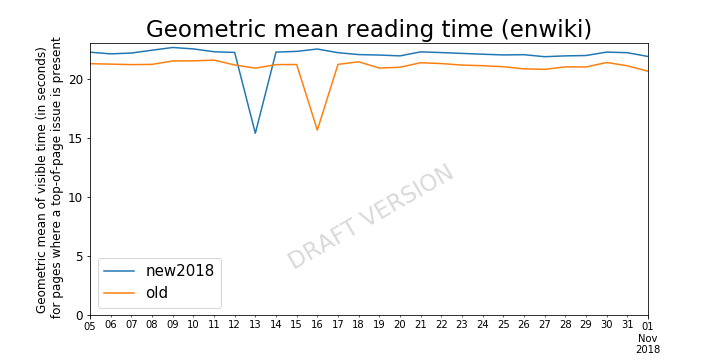
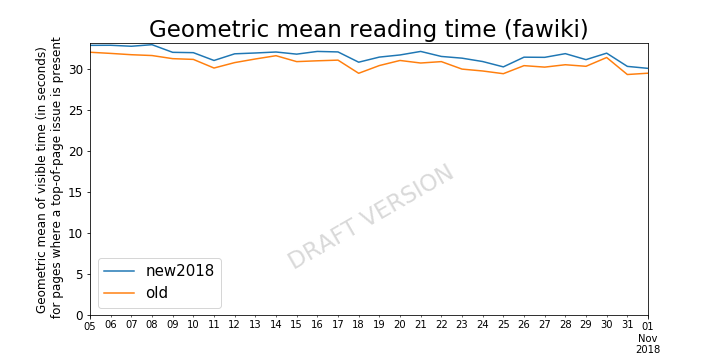
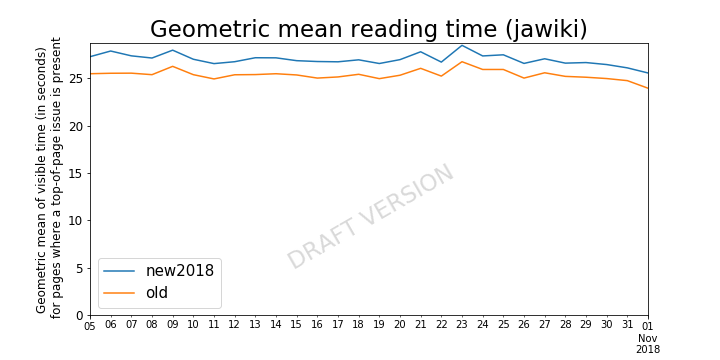
Below is some preliminary data that appears shows quite consistently that readers spend about 1-2 seconds more reading a page in the new page issues design. An increase is plausible considering the above result about increased clicks on issue notices.
While this data incorporates basically all the anomaly corrections that came out of the Reading Time research project and T204143, it still shows some anomalies that need a closer look (@Groceryheist and I have been discussing such isssues in recent days). I'm posting this preliminary result now because I probably won't get to work on this until a week from now (after WMF All Hands).

Page issues - Median reading time (enwiki) draft 20190128.png (360×720 px, 43 KB)

Page issues - Median reading time (fawiki) draft 20190128.png (360×720 px, 41 KB)

Page issues - Median reading time (ruwiki) draft 20190128.png (360×720 px, 42 KB)

Page issues - Median reading time (jawiki) draft 20190128.png (360×720 px, 42 KB)

Page issues - Median reading time (lvwiki) draft 20190128.png (360×720 px, 50 KB)

Page issues - geometric mean reading time (enwiki) draft 20190128.png (360×720 px, 42 KB)

Page issues - geometric mean reading time (fawiki) draft 20190128.png (360×720 px, 42 KB)

Page issues - geometric mean reading time (jawiki) draft 20190128.png (360×720 px, 41 KB)

Page issues - geometric mean reading time (lvwiki) draft 20190128.png (360×720 px, 49 KB)

Page issues - geometric mean reading time (ruwiki) draft 20190128.png (360×720 px, 43 KB)

Page issues - mean reading time (enwiki) draft 20190128.png (360×720 px, 43 KB)

Page issues - mean reading time (fawiki) draft 20190128.png (360×720 px, 43 KB)

Page issues - mean reading time (jawiki) draft 20190128.png (360×720 px, 42 KB)

Page issues - mean reading time (lvwiki) draft 20190128.png (360×720 px, 51 KB)

Page issues - mean reading time (ruwiki) draft 20190128.png (360×720 px, 41 KB)

Data via

SELECT year, month, day,
CONCAT(year,'-',LPAD(month,2,'0'),'-',LPAD(day,2,'0')) AS date, 
wiki, version, 
ROUND(AVG(visiblelength)/1000,2) AS average_visible_length,
ROUND(PERCENTILE(visiblelength, 0.5)/1000,2) AS median_visible_length,
ROUND(EXP(AVG(LOG(visiblelength)))/1000,2) AS expavglog_visible_length,
COUNT(*) AS views
FROM (
  SELECT year, month, day, 
  pi.wiki AS wiki, pi.version AS version, pi.pageToken AS token, 
  visiblelength 
  FROM (
    SELECT year, month, day, 
    wiki, event.issuesVersion AS version,
    event.pageToken AS pageToken
    FROM event.pageissues 
    WHERE year = 2018 
    AND ((month = 10 AND day >=5) OR (month = 11 AND day = 1))
    AND event.sectionnumbers[0] = 0
    AND event.action = 'pageLoaded') AS pi
  JOIN (
    SELECT wiki,
    event.pageToken AS pageToken,
    LEAST(event.visiblelength,3600000) AS visiblelength -- cf. https://meta.wikimedia.org/wiki/Research:Reading_time/Draft_Report#Total_time_spent
    FROM event.readingdepth
    WHERE year = 2018 
    AND ((month = 10 AND day >=5) OR (month = 11 AND day = 1))
    AND event.action = 'pageUnloaded'
    AND ( event.page_issues_a_sample OR event.page_issues_b_sample ) 
    AND ( -- https://meta.wikimedia.org/wiki/Schema_talk:ReadingDepth#Likely_broken_on_Safari_and_some_other_browsers
      (useragent.browser_family != 'Safari') 
      AND (useragent.browser_family != 'Android') 
      AND ((useragent.os_family != 'iOS') OR (CAST(useragent.os_major AS INT) > 11) OR (CAST(useragent.os_minor AS INT) >= 3)) 
      AND ((useragent.browser_family != 'Chrome') OR (CAST(useragent.browser_major AS INT) > 38)) )
    ) AS rd
  ON pi.pageToken = rd.PageToken
  AND visiblelength > 0) AS alltokens
GROUP BY year, month, day, wiki, version
ORDER BY year, month, day, wiki, version LIMIT 100000

This does not yet exclude pageviews (pagetokens) with more than one pageunloaded (or no matching pageloaded) ReadingDepth events, or more than one pageloaded PageIssues events, we'll see if that explains the anomalous spikes above.

@ovasileva Can we close this task as resolved? I also see that the report is still marked as Draft.

ovasileva claimed this task.

@ovasileva Can we close this task as resolved? I also see that the report is still marked as Draft.

@kzimmerman - resolving. I'll take the draft template off the report.