Page MenuHomePhabricator

1.38.0-wmf.9 seems to have introduced a memory leak
Closed, ResolvedPublic5 Estimated Story PointsPRODUCTION ERROR

Description

Impact

1.38.0-wmf.9 was deployed on all wikis on 2021-11-18 20:43 UTC. From that point on the following things have been noticed:

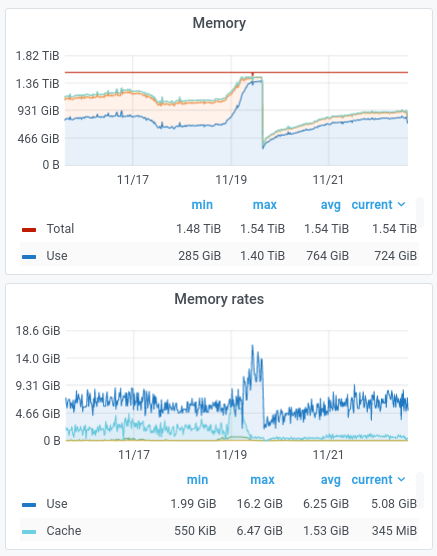
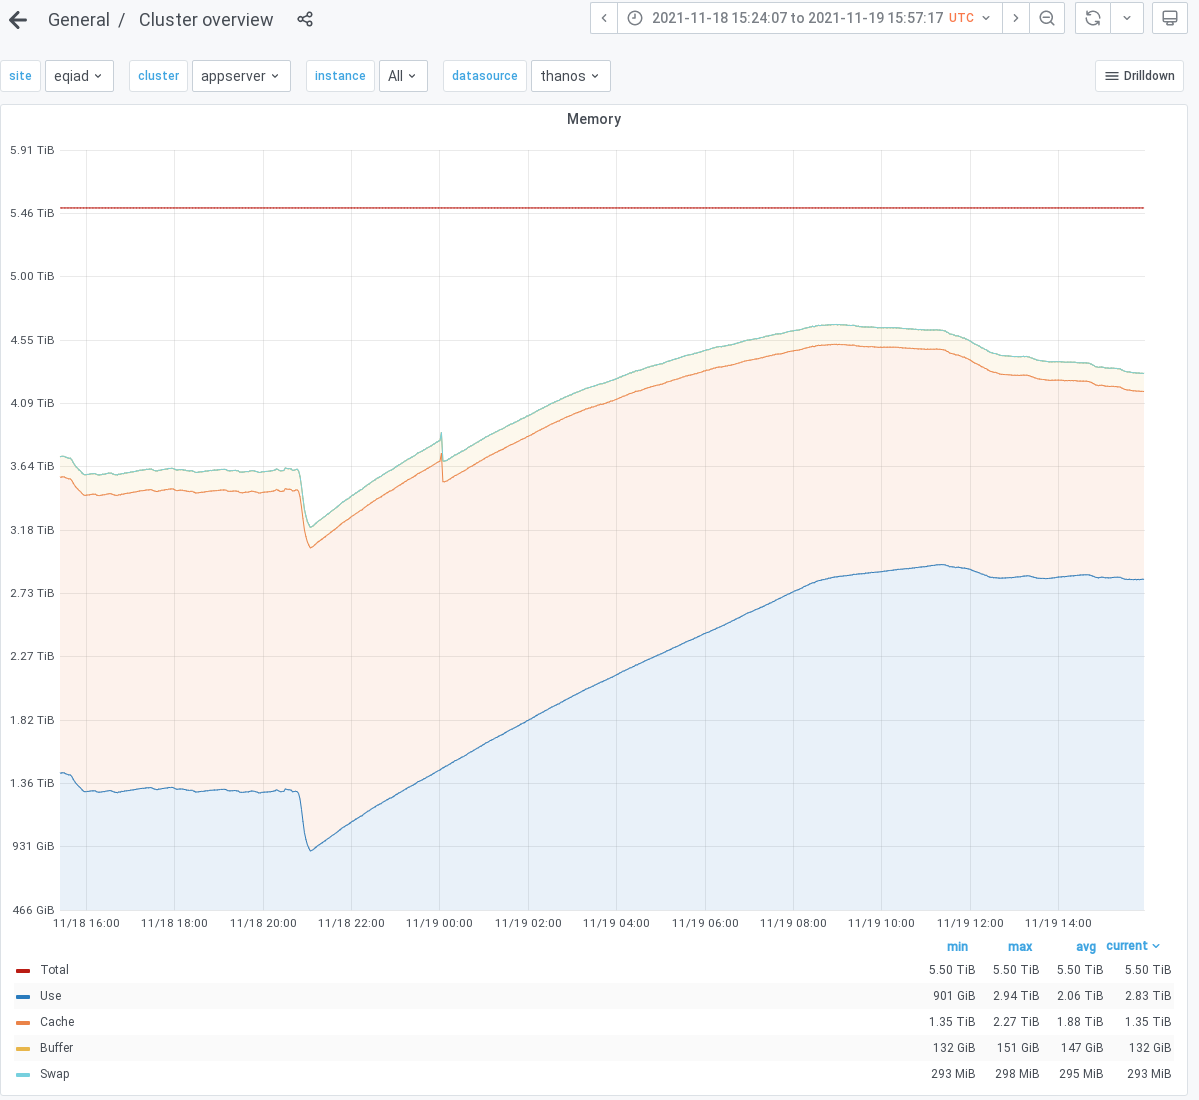
  • Memory usage on the appserver cluster has spiked in ~12[1] hours to the highest it has ever been in the last 60 days. [2]. For now the memory usage across the cluster seems to have stabilized to ~2 times the usual amount (2.8TB vs 1.37TB). That behavior may or may not last. It can not be ruled out that we jump to even higher levels of memory usage.

appserver_cluster_memory.png (1×1 px, 77 KB)

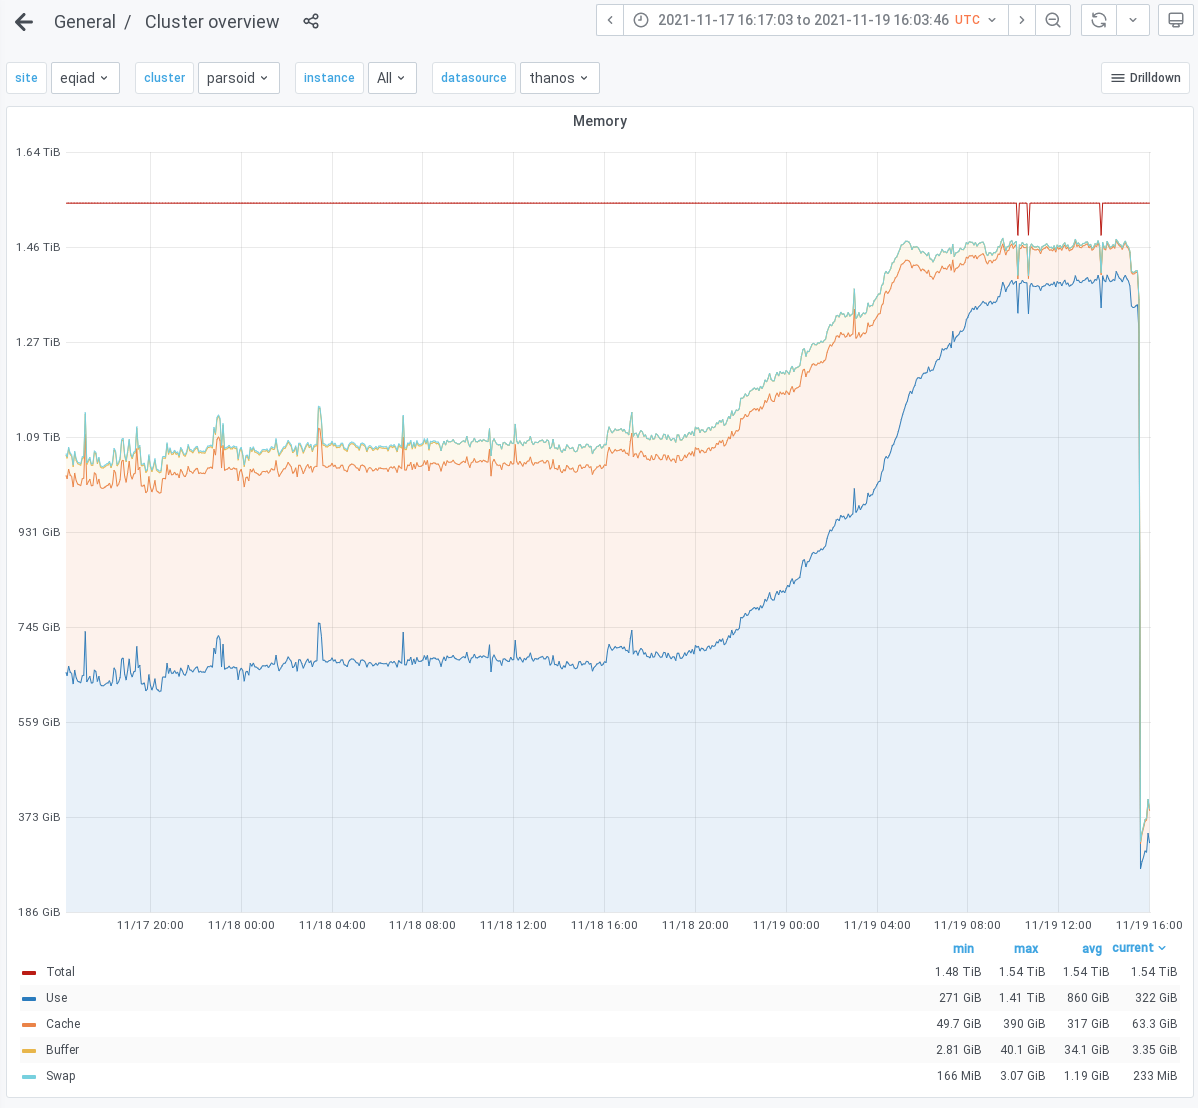
  • The parsoid cluster experienced a similar memory increase[3], [4], but potentially coupled with an increased requested rate that is still being investigated ended up in triggering Out-Of-Memory events leading to failed requests, monitoring issues and the need for SREs to intervene, performing a rolling restart of php fpm on most of the cluster. The window from which the memory increase started to memory pressure and errors is again ~12h.

parsoid_cluster_memory.png (1×1 px, 118 KB)

My 2 cents says revert in order to have a weekend without outages and pages, unless it's possible to find out the cause.

Notes

[1] https://grafana.wikimedia.org/d/000000607/cluster-overview?viewPanel=86&orgId=1&from=1637249047069&to=1637337437853&var-site=eqiad&var-cluster=appserver&var-instance=All&var-datasource=thanos
[2] https://grafana.wikimedia.org/d/000000607/cluster-overview?viewPanel=86&orgId=1&from=now-60d&to=now&var-site=eqiad&var-cluster=appserver&var-instance=All&var-datasource=thanos
[3] https://grafana.wikimedia.org/d/000000607/cluster-overview?viewPanel=86&orgId=1&from=1637165823022&to=1637337826709&var-site=eqiad&var-cluster=parsoid&var-instance=All&var-datasource=thanos

Event Timeline

akosiaris triaged this task as Medium priority.Nov 19 2021, 4:08 PM
akosiaris created this task.
akosiaris created this object with edit policy "Custom Policy".
akosiaris raised the priority of this task from Medium to Unbreak Now!.Nov 19 2021, 4:13 PM

Mentioned in SAL (#wikimedia-operations) [2021-11-19T16:35:02Z] <thcipriani> rolling back to group0 for T296098

Mentioned in SAL (#wikimedia-operations) [2021-11-19T16:42:41Z] <thcipriani@deploy1002> rebuilt and synchronized wikiversions files: Revert "group1 wikis to 1.38.0-wmf.9 refs T293950 T296098"

I double-checked and the timestamp where heavy memory usage growth corresponds quite well with an increase in MySQL query rate: https://grafana.wikimedia.org/d/000000273/mysql?viewPanel=16&orgId=1&from=1637203009358&to=1637313590000&var-job=All&var-server=db1163&var-port=9104 at T296063, which was reverted at ~8:30, same time where explosive memory growth stopped and went stable. Possibly both issues were caused by the same cause? Disclaimer: I didn't do any deep cause research.

Edit: wrong ticket I wanted to mention.

Unassigning now that this is rolled back.

I double-checked and the timestamp where heavy memory usage growth corresponds quite well with an increase in MySQL query rate: https://grafana.wikimedia.org/d/000000273/mysql?viewPanel=16&orgId=1&from=1637203009358&to=1637313590000&var-job=All&var-server=db1163&var-port=9104 at T296063, which was reverted at ~8:30, same time where explosive memory growth stopped and went stable. Possibly both issues were caused by the same cause? Disclaimer: I didn't do any deep cause research.

Edit: wrong ticket I wanted to mention.

^ @daniel does this seem possible/likely?

We can test seeing if it's caused by bad GC (plus the db bug) by restarting php-fpm and seeing if the memory usage reduces. I can try it as it's a non-intrusive action.

akosiaris lowered the priority of this task from Unbreak Now! to High.Nov 21 2021, 9:37 AM

Both appserver cluster and parsoid cluster have been back to normal memory patterns since the revert. I am setting back to high. T296063 could be related and possibly the reason as there seems to be some correlation to more normal patterns since the single patch revert that happened in that context.

Jdforrester-WMF raised the priority of this task from High to Unbreak Now!.Nov 21 2021, 12:42 PM
Jdforrester-WMF subscribed.

Still UBN as it's a train blocker.

Still UBN as it's a train blocker.

But it's a blocker for wmf.11, not wmf9, right? I plan to work on it on Monday/Tuesday.

Still UBN as it's a train blocker.

But it's a blocker for wmf.11, not wmf9, right?

No, wmf.9 was rolled back due to it.

Edit: wrong ticket I wanted to mention.

^ @daniel does this seem possible/likely?

It's possible, if something went wrong with the cache keys - we'd have cache misses, look data up from the database, and then write it to memory.

In T296098#7518932, @Majavah wrote:

No, wmf.9 was rolled back due to it.

Hold on, now I'm confused. My take it that wmf.9 was rolled back because of T296063. The patch that caused the problem was reverted on wmf.9 by https://gerrit.wikimedia.org/r/c/mediawiki/core/+/739841, and T296063 was marked as a blocker for wmf.11. So what's blocking wmf.9?

Hold on, now I'm confused. My take it that wmf.9 was rolled back because of T296063. The patch that caused the problem was reverted on wmf.9 by https://gerrit.wikimedia.org/r/c/mediawiki/core/+/739841, and T296063 was marked as a blocker for wmf.11. So what's blocking wmf.9?

At first, T296063 was reported, trying to avoid rolling back wikis to wmf.8, we reverted the faulty patch in wmf.9 (and marked as blocker of wmf.11 because it didn't get reverted in master). But then this ticket was reported which caused rollback of wikis to wmf.8 (regardless the fact that it might have been related to that ticket or not).

They might have been related (we don't know for sure) but important point is that even with the revert patch being deployed, the memory was pretty high. It could have that they just needed a php-fpm restart but we don't know for sure. One way to test this is to roll all wikis to wmf.9 and see if the memory spikes again.

I don't see a massive increase in memory after rolling out of wmf.9 but it might take some time to show itself

Mentioned in SAL (#wikimedia-operations) [2021-11-22T14:06:09Z] <akosiaris> repool wtp1025, wtp1041 to parsoid cluster. T296098

The memory usage of Mysql parts of a request has been reduced from 19MB to 6MB (https://performance.wikimedia.org/xhgui/run/view?id=61975947bc596e20df4e6605 vs https://performance.wikimedia.org/xhgui/run/view?id=619ba8d32d10f4d5dc6308de) but total memory usage has not been reduced. Let's see

On the Grafana cluster-overview dashboard I have added a panel that shows shows rate() of memory usage. Maybe that can help spot the issue in the future. An example for the parsoid cluster on November 19th:

cluster_overview_mem_rate.png (556×437 px, 69 KB)

It is not idea since the rates are in absolute value. The bump in cache velocity is actually cache being shrunk as more memory is being used. I could not find how to reflect a negative rate in Grafana.

For what is worth, I don't see that pattern. Memory usage increases indeed, but by the usual rates and patterns it had before this ticket. I think we may have found our culprit. Let's monitor this for the duration of US day before we call it a success though.

Ladsgroup claimed this task.

For what is worth, I don't see that pattern. Memory usage increases indeed, but by the usual rates and patterns it had before this ticket. I think we may have found our culprit. Let's monitor this for the duration of US day before we call it a success though.

It seems the memory usage is still below previous values. Let's call it done.

Yes, it definitely looks like we identified the culprit easily. That's nice, memory leaks can be a pain to track down. Many thanks to all who contributed rolling back, re-deploying and monitoring during the weekend.

It sounds like nobody has a theory as to how an increased query rate could lead to increased memory. It would have been nice if someone could have got a core dump of an affected process.

It tried to get a core dump:

Dec 10 20:52:55 wtp1025 kernel: [21268770.342075] Core dump to |/usr/lib/systemd/systemd-coredump 5877 33 33 11 1639169575 0 php-fpm7.2 pipe failed

But the systemd-coredump package is not installed. Apparently the puppet systemd::coredump module is loaded, but it does not install the package.

you can do memory dump with gdb. I did it and it's in my home directory in mw1414 (it's from the APCu though).

OK, I didn't realise mw1414 was depooled with high memory usage, that is useful. I looked at /proc/<pid>/maps. The heap segments, typically at 0x563908311000, account for 36GB of memory usage if you add them all together, out of 41GB total "used" memory. So I think it's probably coming from malloc(), not APC/APCu or emalloc().

I dumped some random parts of the heap of a php-fpm7.2 process on mw1414. It looks like DB query results. Probably mysqli is leaking query results, hence when the query rate increases, the leak rate increases.