Page MenuHomePhabricator

Measure the user responsiveness to notifications over time
Closed, ResolvedPublic

Description

Notifications are meant to be read. Issues with notification systems tend to result on notifications being ignored, overlooked or result in delays for the user to notice..

When considering improving the visibility of notifications (T113228), the control of volume (T100528), or the way those are presented to align with the priorities of our users (T108190), we may want to measure the impact it has in terms of helping reduce the general backlog of unread notifications with respect to the former baseline.

To support the above, some understanding on users responsiveness with notifications will be helpful. Some aspects to measure:

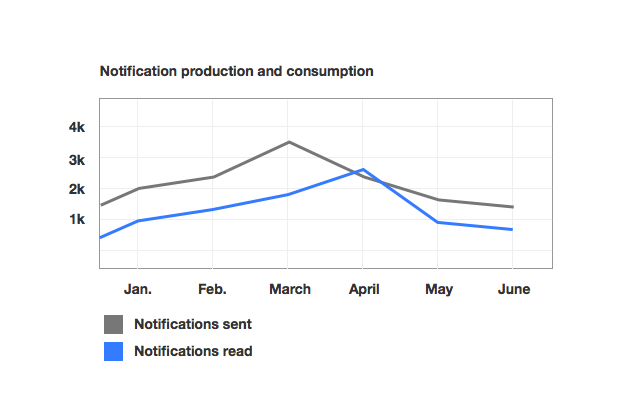
  • Monthly production and consumption of notifications. Number of notifications created and number of notifications read for 30 day periods. For example, "In August, 1000 notifications were sent and 500 were read. In September, 600 notifications were sent and 700 were read, etc.".
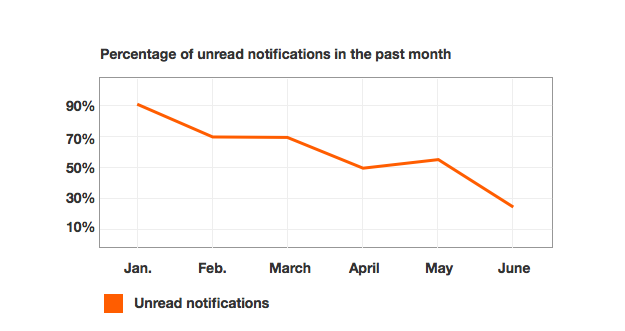
  • Distribution of unread notifications. Percentage of notifications generated during 30 days that remain unread the next 30 days. For example, "30% of the notifications from August remained unread at the end of September".
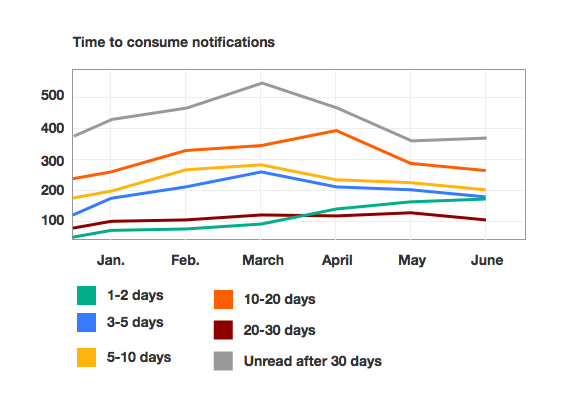
  • Distribution of response time. Number of notifications generated in a 30 days period that were consumed in 1-2 days, 3-5 days, ... 20-30 days or remain unread after the next 30 days. For example, "500 of the 1000 notifications generated in August were consumed in less than 2 days".

Some possible visualisations are shown below:

notif-prod-cons.png (406×625 px, 29 KB)

notif-unread-perc.png (331×625 px, 26 KB)

notif-time.png (405×581 px, 42 KB)

Event Timeline

Pginer-WMF renamed this task from Measure the number of unread notifications over time to Measure the user responsiveness to notifications over time.Aug 7 2015, 12:16 PM
Pginer-WMF updated the task description. (Show Details)

Defining the "norm" is going to be hard. It would be unrealistic to expect that most people (or even the "ideal" users so to speak) check all their notifications, and do so in a timely manner. Also, if a notification is unread, but another newer one is read, it can have different meanings (user ignored it, user knew about it some other way and checked the related page directly, etc).

I like the idea as a whole; however I think it is more of an R&D type of request than a feature request for the production software. It would be reasonable for WMF to investigate this, but until clear conclusions are made from the data, and those conclusions justify a change in MW or its extensions (which, by the way, is also used by non-WMF users a lot), I think a request for changing the software would be irrelevant.

Another way to put it is: I think WMF should use its own resources to collect and analyze those stats, not the resources of MediaWiki (e.g. volunteer programmers). YMMV.

Relevant schemas: https://meta.wikimedia.org/wiki/Schema:EchoInteraction (especially notification-impression and the *-link-click), and possibly https://meta.wikimedia.org/wiki/Schema:Echo .

Note, we should define exactly what we mean by 'responsiveness'.

In some cases (e.g. a mention notification), just seeing the notification is sufficient. In other cases, it may be worth tracking whether the user clicked it (e.g. a revert notification, to see the revert message, or a user talk notification, to see the user talk message).

Defining the "norm" is going to be hard.

Yes. I agree that it is unrealistic to aim for a metric that perfectly reflect users intents (notifications depend a lot on the context and we cannot read the user minds), but I think we can find a measurable outcome that reflects an issue and whether it improves or not when we try a specific solution.

Note, we should define exactly what we mean by 'responsiveness'.

I added some more specific metric definitions. With those I expect we can get a more clear idea on which is the pace at which notifications are produced and consumed, whether unread notifications are accumulating, and how much it takes for users to consume them on average. We can get results per wiki, or per notification type, or even adjust time periods as we iterate, but I think the questions I mentioned are quite basic and we don't have much clues about them right now.

Catrope raised the priority of this task from Medium to High.Sep 30 2015, 11:44 PM
Catrope added a subscriber: Catrope.

This data should all be available from the database without any software modifications. However, we probably want to track this data on an ongoing basis, not just as a one-off query, so we should build a limn dashboard or whatever else we're supposed to use for this kind of thing (graphing the results of DB queries over time).

Responding here to an email from @matthiasmullie:

We have an existing limn dashboard that’s a couple of years old[2], and I’d like to add 3 charts to it.
It looks like the Limn config is hosted on GitHub[3] - is that where I submit the changes to, or is that a mirror?

That is not a mirror, it was before we moved stuff to gerrit. The dashboard configuration will need to be updated in that repo, I have push rights and you can submit a pull request if you like. But I'll help you with that when the files are generated and ready on datasets (more below).

I have the queries[4] to generate the CSV files, but I’m unsure where to put those.

The best place is in this repository in gerrit: https://gerrit.wikimedia.org/r/#/admin/projects/analytics/limn-ee-data.

IIRC, they used to be generated from a cronjob that ran on stat1001, but I seem to remember that has changed.
Existing docs[5] for that dashboard aren’t really useful - can you point me in the right direction for how to get them on datasets.wikimedia.org?

So the process is:

  • create a folder called "ee" in the analytics/limn-ee-data repository
  • create a config.yaml in there that configures the reportupdater - a tool that will run your SQL on an on-going basis and make sure to re-run if it misses a day, re-order your columns if you change your query, etc. All the limn-*-data repositories in gerrit have examples, but the most straightforward one is probably limn-language-data. I'll link to github (easier to read code): https://github.com/wikimedia/analytics-limn-language-data/blob/master/language/config.yaml
  • put your SQL scripts in ee/name-of-graph.sql noting the convention that the keys in the config.yaml configuration need to match the name of the sql file (without .sql)
  • note that the SQL scripts can be templates that use special parameters like {from_timestamp} which lets the reportupdater run your query one day at a time, and like {wiki_db} which you can configure from config.yaml like the language team did.
  • submit that to gerrit and I'll work with you to make sure the scripts are correct in their template incarnation.
  • once that's merged, the reportupdater will run it (I have to enable it in puppet), the files will be generated and rsynced to a folder that serves them on datasets.wikimedia.org

Docs are hard because of the XKCD standards problem :) For more in-depth information about what we're going to do you can read here[6] (but don't unless you're curious, I'll walk you through it).

As always, you can ping me on IRC in #wikimedia-analytics.

1: https://phabricator.wikimedia.org/T108208
2: http://ee-dashboard.wmflabs.org/dashboards/enwiki-features
3: https://github.com/wikimedia/limn-editor-engagement-data
4: https://gist.github.com/matthiasmullie/bff1818c31d8c2762da9
5: https://wikitech.wikimedia.org/wiki/EE_Dashboard

[6] https://wikitech.wikimedia.org/wiki/Analytics/Dashboards

Change 249394 had a related patch set uploaded (by Matthias Mullie):
Measure the user responsiveness to notifications over time

https://gerrit.wikimedia.org/r/249394

Thanks for the help, @Milimetric!

I've submitted https://gerrit.wikimedia.org/r/#/c/249394/ (data) & https://github.com/wikimedia/limn-editor-engagement-data/pull/6 (charts).
I've added some comments myself already about things I was unsure of, but I'm sure there's even more things I'm unaware of :)

(note: I haven't tried running the charts myself, yet - I haven't been able to get limn running on my machine so far)

Nice work, commented on both changes.

Change 249394 merged by Milimetric:
Measure the user responsiveness to notifications over time

https://gerrit.wikimedia.org/r/249394

Checked https://gerrit.wikimedia.org/r/#/c/249394/5/ee/monthly_production_and_consumption_of_notifications.sql

Takes quite long time to run - e.g. BETWEEN '20151104005301' AND '20151104015401' - 12 min 22.88 sec :

mysql:research@x1-analytics-slave [enwiki]> SELECT DATE('20151104') AS date, SUM(notifications_sent) AS notifications_sent, SUM(notifications_read) AS notifications_read    FROM       (SELECT COUNT(*) AS notifications_sent, 0 AS notifications_read  FROM echo_notification WHERE notification_timestamp BETWEEN '20151104005301' AND '20151104015401' UNION  SELECT 0 AS notifications_sent, COUNT(*) AS notifications_read  FROM echo_notification AS notification  LEFT JOIN  (SELECT notification_read_timestamp ,notification_bundle_display_hash  FROM echo_notification WHERE notification_bundle_base = 1 ) bundle ON notification.notification_bundle_display_hash = bundle.notification_bundle_display_hash AND notification.notification_bundle_display_hash != '' WHERE notification.notification_read_timestamp BETWEEN '20151104005301' AND '20151104015401' ) AS temp;
+------------+--------------------+--------------------+
| date       | notifications_sent | notifications_read |
+------------+--------------------+--------------------+
| 2015-11-04 |                648 |                365 |
+------------+--------------------+--------------------+
1 row in set (12 min 22.88 sec)

For BETWEEN '20151104005301' AND '20151104005501' - 21.69 sec

mysql:research@x1-analytics-slave [enwiki]> 
mysql:research@x1-analytics-slave [enwiki]> SELECT DATE('20151104') AS date, SUM(notifications_sent) AS notifications_sent, SUM(notifications_read) AS notifications_read    FROM       (SELECT COUNT(*) AS notifications_sent, 0 AS notifications_read  FROM echo_notification WHERE notification_timestamp BETWEEN '20151104005301' AND '20151104005501' UNION  SELECT 0 AS notifications_sent, COUNT(*) AS notifications_read  FROM echo_notification AS notification  LEFT JOIN  (SELECT notification_read_timestamp ,notification_bundle_display_hash  FROM echo_notification WHERE notification_bundle_base = 1 ) bundle ON notification.notification_bundle_display_hash = bundle.notification_bundle_display_hash AND notification.notification_bundle_display_hash != '' WHERE notification.notification_read_timestamp BETWEEN '20151104005301' AND '20151104005501' ) AS temp;

+------------+--------------------+--------------------+
| date       | notifications_sent | notifications_read |
+------------+--------------------+--------------------+
| 2015-11-04 |                 15 |                 12 |
+------------+--------------------+--------------------+
1 row in set (21.69 sec)

EXPLAIN for the above query shows huge number of rows scanned -rows: 172187973127722

*************************** 1. row ***************************
           id: 1
  select_type: PRIMARY
        table: <derived2>
         type: ALL
possible_keys: NULL
          key: NULL
      key_len: NULL
          ref: NULL
         rows: 172187973127722
        Extra: 
*************************** 2. row ***************************
           id: 2
  select_type: DERIVED
        table: echo_notification
         type: index
possible_keys: NULL
          key: user_timestamp
      key_len: 18
          ref: NULL
         rows: 13122041
        Extra: Using where; Using index
*************************** 3. row ***************************
           id: 3
  select_type: UNION
        table: notification
         type: ALL
possible_keys: NULL
          key: NULL
      key_len: NULL
          ref: NULL
         rows: 13122041
        Extra: Using where
*************************** 4. row ***************************
           id: 3
  select_type: UNION
        table: echo_notification
         type: index
possible_keys: NULL
          key: echo_notification_user_hash_base_timestamp
      key_len: 53
          ref: NULL
         rows: 13122041
        Extra: Using where; Using index
*************************** 5. row ***************************
           id: NULL
  select_type: UNION RESULT
        table: <union2,3>
         type: ALL
possible_keys: NULL
          key: NULL
      key_len: NULL
          ref: NULL
         rows: NULL
        Extra: 
5 rows in set (0.00 sec)

Yeah, one main problem is there's no index on timestamp there. It would help a lot, and a request was filed.

nshahquinn-wmf raised the priority of this task from High to Needs Triage.Mar 30 2018, 10:31 AM
nshahquinn-wmf moved this task from Backlog to Radar on the Contributors-Analysis board.