Page MenuHomePhabricator

Analyse load time performance of FA-length pages on mobile
Closed, ResolvedPublic

Description

Break this down into a few sections:

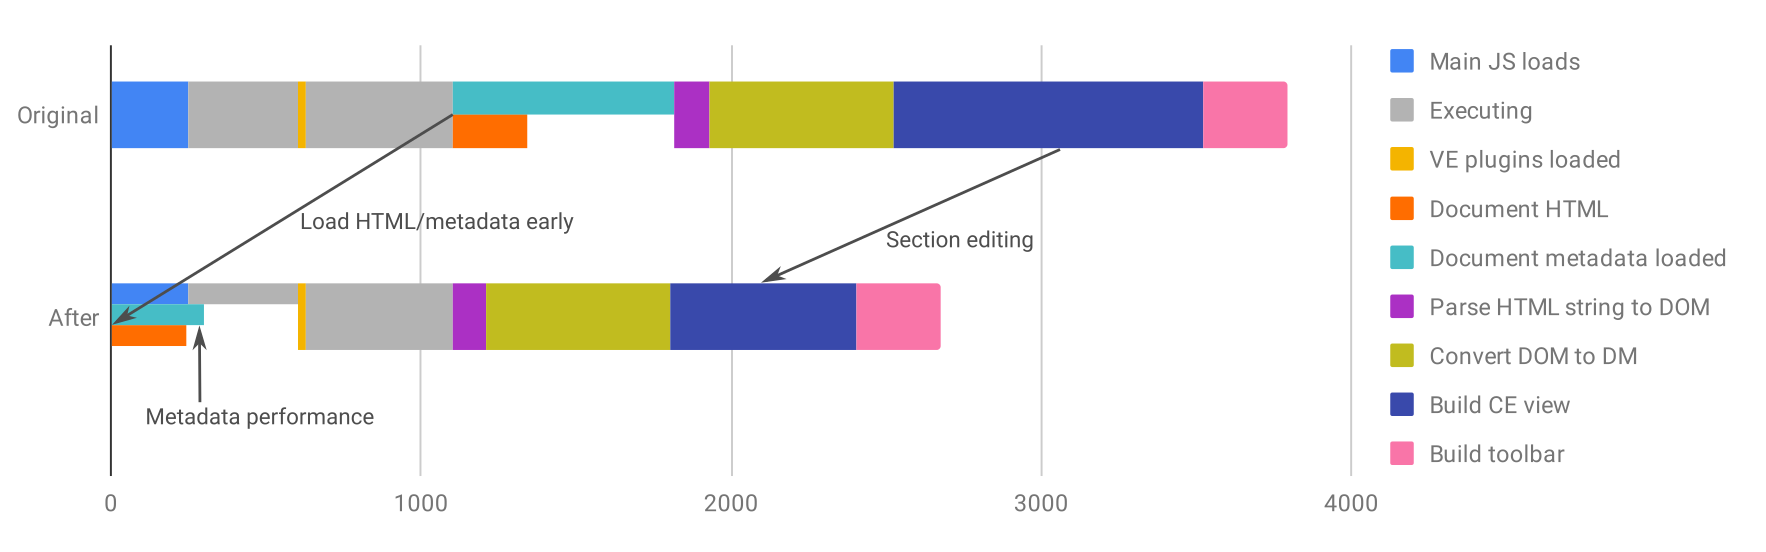
  • Downloading code & page HTML (should be parallel)
  • HTML->DM conversion
  • CE rendering
  • Any other significant bottlenecks

This will allow us to estimate the performance benefit of client-side section editing vs server-side section editing.

Related Objects

Event Timeline

Esanders triaged this task as Medium priority.Oct 4 2018, 3:27 PM
Esanders created this task.
marcella renamed this task from Analyse load time performance of FA-length pages on moblie to Analyse load time performance of FA-length pages on mobile.Oct 15 2018, 3:19 PM

Loading https://en.m.wikipedia.org/wiki/Nemegtomaia on my Nexus 5X (over fibre internet)

#starteventduration
10.0sMain JS loads (397K)247ms
20.6sVE plugins loaded (17K)30ms
31.1sDocument metadata loaded (6.2K)719ms
41.1sDocument HTML loaded (39K)242ms
51.8sParse HTML string to DOM110ms
61.9sConvert DOM to DM594ms
72.5sBuild CE view~1000ms
83.5sBuild toolbar270ms

Loading the page again with various caches filled is very similar but for the first step which is skipped.

There are a couple of interesting observations:

  1. Document metadata/HTML doesn't start loading immediately because Mobile isn't using ArticleTargetLoader like we have on Desktop, it is waiting for VE code to load first. We should create a task for this. (Edit: Filed as T209052)
  2. The discrepancy between the time it takes to download code and the time before the next step is presumable the time it takes to evaluate and run that code.
  3. Document metadata is very slow to load, despite being much smaller than document HTML. This is because of the work being done on the server to generate it, whereas HTML is cached by RESTBase. We should look into improving this. (Edit: Filed as T209078)
  4. Building the CE takes a long time, so client side section editing would vastly improve this. I would expect that 1000ms to drop to ~100ms.
  5. Parsing the HTML takes a fair bit of time (~700ms). That would only be improved by server-side section editing, but there are lots of speed improvements to be made without it.
  6. Toolbar building is slow - there may be ways to improve this, e.g. lazy-building tools that are hidden in sub-menus.

With network throttling:

  • Fast 3G: Not much change, metadata takes 800ms and HTML takes 600ms. As metadata is the slower of the two in parallel this is only 80ms slower than above.
  • Slow 3G: Metadata take a similar amount of time to HTML, ~2000ms.
Esanders moved this task from Incoming to In progress on the VisualEditor (Current work) board.
Esanders added a subscriber: dchan.
In T64803#4976635, @Esanders uploaded a patch:

[mediawiki/extensions/VisualEditor@master] ApiVisualEditor: Remove red-link cache warming

Red-link metadata was already added to Parsoid 18 months ago.
On long pages evaluating this information is very slow (hundreds of milliseconds) and completely redundant.

https://gerrit.wikimedia.org/r/492358

This is awesome. Thanks Ed!

Saving over half a second of time, very neat. This is a win in three categories:

  1. Cutting down time spent waiting for the metadata to arrive - while being computed in PHP with various database queries.
  2. Cutting down time spent transferring the metadata - less bandwidth.
  3. Cutting down time spent in JavaScript - by removing the need to process this metadata.

That first point, I also measured with XHGui just now. The profile I recorded, saved as 5c7088c6 on performance.wikimedia.org/xhgui, shows it normally takes about 0.4 seconds for that first point alone.

export.png (1×2 px, 201 KB)

This is an visualisation of the performance improvements over the past few months (loading html/metadata early, speeding up metadata, client side section editing), based on my initial measurements from November:

image.png (552×1 px, 85 KB)

This is wonderful, Ed. And so too is the visualization you created.

Here's how it will look after T215717 is fixed:

image.png (524×1 px, 64 KB)

Here's the same graph without the intermediate step

image.png (408×1 px, 55 KB)