Page MenuHomePhabricator

Wikibase selenium tests timeout, seemingly due to "memory compaction" events on CI VMs
Open, HighPublic

Assigned To
None
Authored By
santhosh
Apr 26 2021, 11:35 AM
Referenced Files
F34531704: image.png
Jun 29 2021, 1:58 PM
F34429941: image.png
Apr 27 2021, 3:55 PM
F34429934: image.png
Apr 27 2021, 3:55 PM
F34429932: image.png
Apr 27 2021, 3:55 PM
F34429908: commit_limit.png
Apr 27 2021, 3:39 PM
F34428834: image.png
Apr 26 2021, 6:03 PM
F34428832: image.png
Apr 26 2021, 6:03 PM
F34428575: image.png
Apr 26 2021, 3:29 PM
Tokens
"Evil Spooky Haunted Tree" token, awarded by kostajh.

Description

Example: https://integration.wikimedia.org/ci/job/wmf-quibble-selenium-php72-docker/91140/console

relevant log:

16:56:06 [chrome 88.0.4324.182 linux #0-5] 1) target property label uses the property ID if no label in fallback chain found
16:56:06 [chrome 88.0.4324.182 linux #0-5] element (".oo-ui-dialog #data-bridge-app .wb-db-bridge") still not displayed after 10000ms
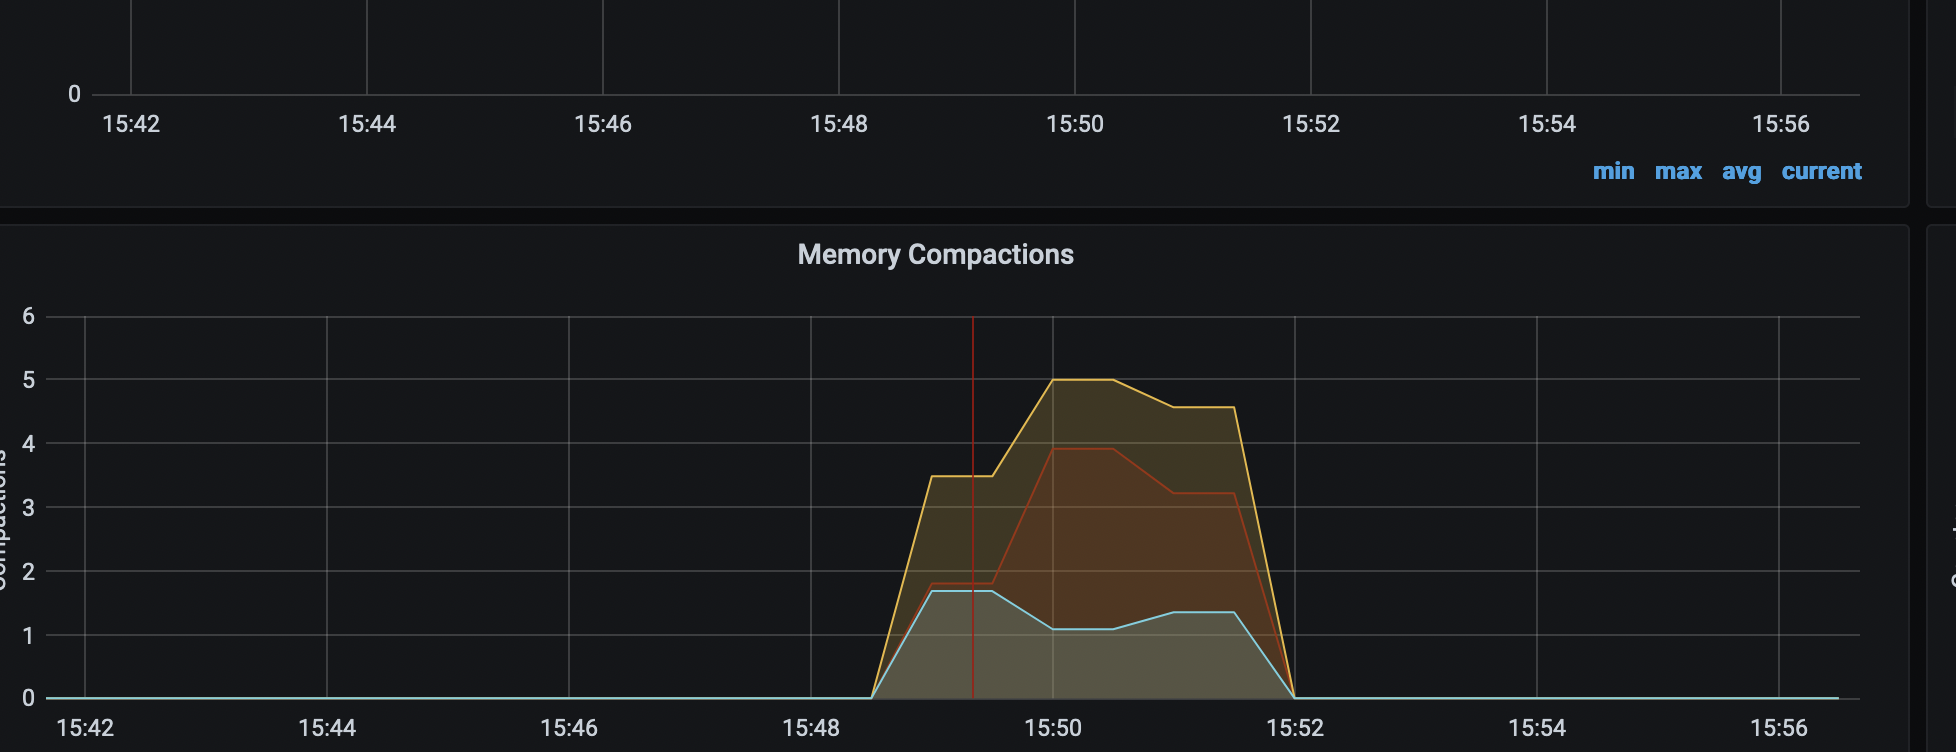
16:56:06 [chrome 88.0.4324.182 linux #0-5] Error: element (".oo-ui-dialog #data-bridge-app .wb-db-bridge") still not displayed after 10000ms

The bulk of the connection to "memory compaction "events is detailed in T281122#7035294

Event Timeline

santhosh triaged this task as Unbreak Now! priority.Apr 26 2021, 11:37 AM

Increasing priority since this blocks CI and merges of other dependent projects

Thanks for filing this, @santhosh! Similar tests are known to be flaky (e.g. T279932) and known to fail on rare occasions. I'll reapply the +2 on the affected patch to see if it's flakiness or whether it's completely broken. We'll look into it either way but if it's "just" flaky with a reasonably low chance to fail it might not qualify for "unbreak now".

Addshore lowered the priority of this task from Unbreak Now! to High.Apr 26 2021, 11:53 AM

You are correct. This does not look consistently happening. a few patches went though. I will remove UBN.

Addshore renamed this task from Wikibase selenium tests fails to Wikibase selenium tests fails: Error: element (".oo-ui-dialog #data-bridge-app .wb-db-bridge") still not displayed after 10000ms.Apr 26 2021, 12:16 PM
Addshore claimed this task.

Assigning to myself to deepdive the CI logs quickly

So the failed test case is:

12:26:06 ------------------------------------------------------------------
12:26:06 [chrome 88.0.4324.182 linux #0-5] Spec: /workspace/src/extensions/Wikibase/client/data-bridge/tests/selenium/specs/init.js
12:26:06 [chrome 88.0.4324.182 linux #0-5] Running: chrome (v88.0.4324.182) on linux
12:26:06 [chrome 88.0.4324.182 linux #0-5] Session ID: 4ca787044c4df8c6ed4409038e685401
12:26:06 [chrome 88.0.4324.182 linux #0-5]
12:26:06 [chrome 88.0.4324.182 linux #0-5] init
12:26:06 [chrome 88.0.4324.182 linux #0-5]    ✓ opens app in OOUI dialog
12:26:06 [chrome 88.0.4324.182 linux #0-5]    ✓ indicates loading while app gathers its data
12:26:06 [chrome 88.0.4324.182 linux #0-5]
12:26:06 [chrome 88.0.4324.182 linux #0-5]     once app is launched
12:26:06 [chrome 88.0.4324.182 linux #0-5]        ✓ shows the current targetValue
12:26:06 [chrome 88.0.4324.182 linux #0-5]        ✓ shows the current targetReference
12:26:06 [chrome 88.0.4324.182 linux #0-5]
12:26:06 [chrome 88.0.4324.182 linux #0-5]         target property label
12:26:06 [chrome 88.0.4324.182 linux #0-5]            ✓ uses the label from the page content language
12:26:06 [chrome 88.0.4324.182 linux #0-5]            ✓ uses the label from a non-English fallback language
12:26:06 [chrome 88.0.4324.182 linux #0-5]            ✓ uses the label from the English fallback language
12:26:06 [chrome 88.0.4324.182 linux #0-5]            ✖ uses the property ID if no label in fallback chain found
12:26:06 [chrome 88.0.4324.182 linux #0-5]
12:26:06 [chrome 88.0.4324.182 linux #0-5]     warning for anonymous edits
12:26:06 [chrome 88.0.4324.182 linux #0-5]        ✓ is not shown when logged in
12:26:06 [chrome 88.0.4324.182 linux #0-5]
12:26:06 [chrome 88.0.4324.182 linux #0-5]         when anonymous
12:26:06 [chrome 88.0.4324.182 linux #0-5]            ✓ is shown and can be dismissed
12:26:06 [chrome 88.0.4324.182 linux #0-5]            ✓ is shown and leads to login page
12:26:06 [chrome 88.0.4324.182 linux #0-5]
12:26:06 [chrome 88.0.4324.182 linux #0-5] 10 passing (44.1s)
12:26:06 [chrome 88.0.4324.182 linux #0-5] 1 failing
12:26:06 [chrome 88.0.4324.182 linux #0-5]
12:26:06 [chrome 88.0.4324.182 linux #0-5] 1) target property label uses the property ID if no label in fallback chain found
12:26:06 [chrome 88.0.4324.182 linux #0-5] element (".oo-ui-dialog #data-bridge-app .wb-db-bridge") still not displayed after 10000ms
12:26:06 [chrome 88.0.4324.182 linux #0-5] Error: element (".oo-ui-dialog #data-bridge-app .wb-db-bridge") still not displayed after 10000ms
12:26:06 [chrome 88.0.4324.182 linux #0-5]     at test (/workspace/src/extensions/Wikibase/client/data-bridge/tests/selenium/specs/init.js:221:27)
12:26:06 [chrome 88.0.4324.182 linux #0-5]     at Context.it (/workspace/src/extensions/Wikibase/client/data-bridge/tests/selenium/specs/init.js:251:5)
12:26:06 ------------------------------------------------------------------

Looking at the data from T277205 this test doesn't fail all that often, but it does regularly fail

image.png (149×1 px, 27 KB)

Error	26 April 2021	19 April 2021	8 April 2021	19 March 2021	11 March 2021		Grand Total
✖ uses the property ID if no label in fallback chain found	6	10	1	8	3		28

The test is failing here
https://github.com/wikimedia/Wikibase/blob/652e54bd3f3c3895683d50b56216633a2dfeba64/client/data-bridge/tests/selenium/specs/init.js#L221
In the init stage of this test
https://github.com/wikimedia/Wikibase/blob/652e54bd3f3c3895683d50b56216633a2dfeba64/client/data-bridge/tests/selenium/specs/init.js#L248-L252

In T273327 we already increased this wait from 5 seconds to 10 seconds.


Relevant artifacts (screenshot and video) for the failure:


image.png (888×1 px, 98 KB)

We only record screenshots and videos on failure for Wikibase tests currently it seems.
Which means we do not have a "good case" to compare against what these artifacts should look like at all.
Though it looks like some loading process is still happening within the test...


The failing test uses the page name with the random string 0.8411407394109791 in it.
This makes it easier to find in the logs..

Successful end of previous test:

12:25:28 INFO:backend.PhpWebserver:[Mon Apr 26 11:25:28 2021] 127.0.0.1:46896 [200]: //index.php?title=Talk%3AData-bridge-test-page-0.6471843475528136-I%C3%B1t%C3%ABrn%C3%A2ti%C3%B4n%C3%A0liz%C3%A6ti%C3%B8n
12:25:28 INFO:backend.PhpWebserver:[Mon Apr 26 11:25:29 2021] 127.0.0.1:46906 [200]: /api.php?action=query&format=json&titles=Talk%3AData-bridge-test-page-0.6471843475528136-I%C3%B1t%C3%ABrn%C3%A2ti%C3%B4n%C3%A0liz%C3%A6ti%C3%B8n&prop=info&meta=siteinfo&intestactions=edit&intestactionsdetail=full&siprop=restrictions&errorformat=raw&formatversion=2
12:25:29 INFO:backend.PhpWebserver:[Mon Apr 26 11:25:29 2021] 127.0.0.1:46908 [200]: /api.php?action=wbgetentities&format=json&props=labels%7Cdatatype%7Cinfo%7Cclaims&ids=P12%7CQ30&languages=de&languagefallback=true&formatversion=2
12:25:29 INFO:backend.PhpWebserver:[Mon Apr 26 11:25:29 2021] 127.0.0.1:46910 [200]: /api.php?action=query&format=json&meta=wbdatabridgeconfig%7Csiteinfo&formatversion=2&errorformat=raw&titles=Item%3AQ30&prop=info&intestactions=edit&intestactionsdetail=full&siprop=restrictions

Start of this test case:

12:25:29 INFO:backend.PhpWebserver:[Mon Apr 26 11:25:30 2021] 127.0.0.1:46926 [200]: //api.php?format=json
12:25:30 INFO:backend.PhpWebserver:[Mon Apr 26 11:25:30 2021] 127.0.0.1:46928 [200]: //api.php?format=json
12:25:30 INFO:backend.PhpWebserver:[Mon Apr 26 11:25:30 2021] 127.0.0.1:46930 [200]: //api.php?format=json
12:25:30 INFO:backend.PhpWebserver:[Mon Apr 26 11:25:30 2021] 127.0.0.1:46932 [200]: //api.php?format=json
12:25:30 INFO:backend.PhpWebserver:[Mon Apr 26 11:25:30 2021] 127.0.0.1:46934 [200]: //api.php?format=json
12:25:30 INFO:backend.PhpWebserver:[Mon Apr 26 11:25:31 2021] 127.0.0.1:46936 [200]: //api.php?format=json
12:25:31 [0-5] [11:25:31] [S] [MWBOT] Login successful: WikiAdmin@http://127.0.0.1:9412/
12:25:31 INFO:backend.PhpWebserver:[Mon Apr 26 11:25:31 2021] 127.0.0.1:46938 [200]: //api.php?format=json
12:25:31 INFO:backend.PhpWebserver:[Mon Apr 26 11:25:31 2021] 127.0.0.1:46940 [200]: //api.php?format=json
12:25:31 INFO:backend.PhpWebserver:[Mon Apr 26 11:25:31 2021] 127.0.0.1:46942 [200]: //index.php?title=Talk%3AData-bridge-test-page-0.8411407394109791-I%C3%B1t%C3%ABrn%C3%A2ti%C3%B4n%C3%A0liz%C3%A6ti%C3%B8n
12:25:31 INFO:backend.PhpWebserver:[Mon Apr 26 11:25:32 2021] 127.0.0.1:46950 [200]: /api.php?action=query&format=json&titles=Talk%3AData-bridge-test-page-0.8411407394109791-I%C3%B1t%C3%ABrn%C3%A2ti%C3%B4n%C3%A0liz%C3%A6ti%C3%B8n&prop=info&meta=siteinfo&intestactions=edit&intestactionsdetail=full&siprop=restrictions&errorformat=raw&formatversion=2
12:25:32 [0-5] Video location: /workspace/log/target-property-label_uses-the-property-ID-if-no-label-in-fallback-chain-found.mp4
12:25:42 [0-5] 
12:25:42 	Screenshot: /workspace/log/uses-the-property-ID-if-no-label-in-fallback-chain-found.png
12:25:42 
12:25:42 [0-5] Error in "init once app is launched target property label uses the property ID if no label in fallback chain found"
12:25:42 element (".oo-ui-dialog #data-bridge-app .wb-db-bridge") still not displayed after 10000ms
12:25:42 INFO:backend.PhpWebserver:[Mon Apr 26 11:25:44 2021] 127.0.0.1:46952 [200]: /api.php?action=wbgetentities&format=json&props=labels%7Cdatatype%7Cinfo%7Cclaims&ids=P13%7CQ31&languages=he&languagefallback=true&formatversion=2
12:25:44 INFO:backend.PhpWebserver:[Mon Apr 26 11:25:44 2021] 127.0.0.1:46954 [200]: /api.php?action=query&format=json&meta=wbdatabridgeconfig%7Csiteinfo&formatversion=2&errorformat=raw&titles=Item%3AQ31&prop=info&intestactions=edit&intestactionsdetail=full&siprop=restrictions

Assumed start of next test case

12:25:44 INFO:backend.PhpWebserver:[Mon Apr 26 11:25:44 2021] 127.0.0.1:47074 [200]: //index.php?title=Special%3AUserLogin
12:25:44 INFO:backend.PhpWebserver:[Mon Apr 26 11:25:44 2021] 127.0.0.1:47090 [200]: /load.php?lang=en&modules=ext.uls.pt%7Cext.visualEditor.desktopArticleTarget.noscript%7Cmediawiki.htmlform.styles%7Cmediawiki.special.userlogin.common.styles%7Cmediawiki.special.userlogin.login.styles%7Cmediawiki.ui%7Cmediawiki.ui.button%2Ccheckbox%2Cinput%2Cradio%7Cskins.vector.styles.legacy%7Cwikibase.client.data-bridge.externalModifiers&only=styles&skin=vector

Within the failing test case we can see:

  • 12:25:29 Test case starts setup
  • 12:25:31 Actual page is loaded after setup
  • 12:25:31 1/3 of the needed bridge API calls in the webserver logs
  • 12:25:42 Test fails due to a timeout (that started just after the "actual page is loaded"
  • 12:25:42 2/3 of the needed bridge API calls in the webserver logs
  • 12:25:44 3/3 of the needed bridge API calls in the webserver logs

This appears to be a very similar pattern to what was found in the deepdive at T273327#6884379
Though in that case all 3 API requests appeared in the webserver logs AFTER the test had already failed.


I decided to look a little at the VM that the CI job is running on too to see if I noticed anything happening at around this time.

https://grafana-labs.wikimedia.org/d/000000590/instance-details?orgId=1&var-project=integration&var-job=node&var-node=integration-agent-docker-1010&from=1619434800000&to=1619438400000

WM memory compaction seemed to happen at the time of the failure?

image.png (1×3 px, 382 KB)


With the same logic and reasoning as I applied to the other ticket I'd propose we just bump the timeouts in bridge to 15 or 20 seconds.
Doing this while also doing T277205: Centrally look for flakey browser tests should give us a pretty clear indication of impact.

It could also be worth looking at this specific test in other logs, and checking the API calls around, and see how long / short they can sometimes take.
I wonder if in some cases they are indeed just under the extended timeout.

With the same logic and reasoning as I applied to the other ticket I'd propose we just bump the timeouts in bridge to 15 or 20 seconds.

Looking on mass at a few of these same failures in the past days (details below) .......

  • 15 seconds would seemingly still lead to some timeouts.
  • 20 seconds would have avoided these failures....

Looking at these inidivudally

Log 1, 2 & 3 all also show "memory compactions at the time of the failed test.
Log 1

image.png (1×3 px, 586 KB)

Log 2 & 3
image.png (1×3 px, 430 KB)

And this is consistent with what was happening at the time of the issue in Log 5 that I checked in the comment above
image.png (1×3 px, 382 KB)

I'm not 100% sure what would cause this (memory compaction) within the VM system, but I'm seeing a strong correlation between things going slower and these specific tests failing.


Log 1

API call apparent time in webserver logs, after index.php request: 1) 1s 2) 14s 3) 14s

INFO:backend.PhpWebserver:[Tue Apr 20 13:18:30 2021] 127.0.0.1:54472 [200]: //api.php?format=json
INFO:backend.PhpWebserver:[Tue Apr 20 13:18:30 2021] 127.0.0.1:54474 [200]: //index.php?title=Talk%3AData-bridge-test-page-0.45496743894953795-I%C3%B1t%C3%ABrn%C3%A2ti%C3%B4n%C3%A0liz%C3%A6ti%C3%B8n
INFO:backend.PhpWebserver:[Tue Apr 20 13:18:31 2021] 127.0.0.1:54478 [200]: /api.php?action=query&format=json&titles=Talk%3AData-bridge-test-page-0.45496743894953795-I%C3%B1t%C3%ABrn%C3%A2ti%C3%B4n%C3%A0liz%C3%A6ti%C3%B8n&prop=info&meta=siteinfo&intestactions=edit&intestactionsdetail=full&siprop=restrictions&errorformat=raw&formatversion=2
[0-5] Video location: /workspace/log/target-property-label_uses-the-property-ID-if-no-label-in-fallback-chain-found.mp4
[0-5] 
	Screenshot: /workspace/log/uses-the-property-ID-if-no-label-in-fallback-chain-found.png

[0-5] Error in "init once app is launched target property label uses the property ID if no label in fallback chain found"
element (".oo-ui-dialog #data-bridge-app .wb-db-bridge") still not displayed after 10000ms
INFO:backend.PhpWebserver:[Tue Apr 20 13:18:44 2021] 127.0.0.1:54480 [200]: /api.php?action=wbgetentities&format=json&props=labels%7Cdatatype%7Cinfo%7Cclaims&ids=P13%7CQ31&languages=he&languagefallback=true&formatversion=2
INFO:backend.PhpWebserver:[Tue Apr 20 13:18:44 2021] 127.0.0.1:54482 [200]: /api.php?action=query&format=json&meta=wbdatabridgeconfig%7Csiteinfo&formatversion=2&errorformat=raw&titles=Item%3AQ31&prop=info&intestactions=edit&intestactionsdetail=full&siprop=restrictions
INFO:backend.PhpWebserver:[Tue Apr 20 13:18:44 2021] 127.0.0.1:54552 [200]: //index.php?title=Special%3AUserLogin
addshore@contint2001:~$ grep -l "Data-bridge-test-page-0.45496743894953795" /srv/jenkins/builds/*-selenium-*/*/log
/srv/jenkins/builds/wmf-quibble-selenium-php72-docker/90119/log

https://integration.wikimedia.org/ci/job/wmf-quibble-selenium-php72-docker/90119

Log 2

API call apparent time in webserver logs, after index.php request: 1) 1s 2) 17s 3) 17s

INFO:backend.PhpWebserver:[Thu Apr 22 01:43:56 2021] 127.0.0.1:49684 [200]: //api.php?format=json
INFO:backend.PhpWebserver:[Thu Apr 22 01:43:56 2021] 127.0.0.1:49686 [200]: //index.php?title=Talk%3AData-bridge-test-page-0.32098154480137664-I%C3%B1t%C3%ABrn%C3%A2ti%C3%B4n%C3%A0liz%C3%A6ti%C3%B8n
INFO:backend.PhpWebserver:[Thu Apr 22 01:43:57 2021] 127.0.0.1:49704 [200]: /api.php?action=query&format=json&titles=Talk%3AData-bridge-test-page-0.32098154480137664-I%C3%B1t%C3%ABrn%C3%A2ti%C3%B4n%C3%A0liz%C3%A6ti%C3%B8n&prop=info&meta=siteinfo&intestactions=edit&intestactionsdetail=full&siprop=restrictions&errorformat=raw&formatversion=2
[0-5] Video location: /workspace/log/target-property-label_uses-the-property-ID-if-no-label-in-fallback-chain-found.mp4
[0-5] 
	Screenshot: /workspace/log/uses-the-property-ID-if-no-label-in-fallback-chain-found.png

[0-5] Error in "init once app is launched target property label uses the property ID if no label in fallback chain found"
element (".oo-ui-dialog #data-bridge-app .wb-db-bridge") still not displayed after 10000ms
INFO:backend.PhpWebserver:[Thu Apr 22 01:44:13 2021] 127.0.0.1:49706 [200]: /api.php?action=wbgetentities&format=json&props=labels%7Cdatatype%7Cinfo%7Cclaims&ids=P13%7CQ31&languages=he&languagefallback=true&formatversion=2
INFO:backend.PhpWebserver:[Thu Apr 22 01:44:13 2021] 127.0.0.1:49708 [200]: /api.php?action=query&format=json&meta=wbdatabridgeconfig%7Csiteinfo&formatversion=2&errorformat=raw&titles=Item%3AQ31&prop=info&intestactions=edit&intestactionsdetail=full&siprop=restrictions
INFO:backend.PhpWebserver:[Thu Apr 22 01:44:13 2021] 127.0.0.1:49822 [200]: //index.php?title=Special%3AUserLogin
addshore@contint2001:~$ grep -l "Data-bridge-test-page-0.32098154480137664" /srv/jenkins/builds/*-selenium-*/*/log
/srv/jenkins/builds/wmf-quibble-selenium-php72-docker/90629/log

https://integration.wikimedia.org/ci/job/wmf-quibble-selenium-php72-docker/90629

Log 3

API call apparent time in webserver logs, after index.php request: 1) 0s 2) 18s 3) 18s

NFO:backend.PhpWebserver:[Thu Apr 22 01:44:04 2021] 127.0.0.1:49806 [200]: //api.php?format=json
INFO:backend.PhpWebserver:[Thu Apr 22 01:44:04 2021] 127.0.0.1:49808 [200]: //index.php?title=Talk%3AData-bridge-test-page-0.09227064126814599-I%C3%B1t%C3%ABrn%C3%A2ti%C3%B4n%C3%A0liz%C3%A6ti%C3%B8n
INFO:backend.PhpWebserver:[Thu Apr 22 01:44:04 2021] 127.0.0.1:49812 [200]: /api.php?action=query&format=json&titles=Talk%3AData-bridge-test-page-0.09227064126814599-I%C3%B1t%C3%ABrn%C3%A2ti%C3%B4n%C3%A0liz%C3%A6ti%C3%B8n&prop=info&meta=siteinfo&intestactions=edit&intestactionsdetail=full&siprop=restrictions&errorformat=raw&formatversion=2
[0-5] Video location: /workspace/log/target-property-label_uses-the-property-ID-if-no-label-in-fallback-chain-found.mp4
[0-5] 
	Screenshot: /workspace/log/uses-the-property-ID-if-no-label-in-fallback-chain-found.png

[0-5] Error in "init once app is launched target property label uses the property ID if no label in fallback chain found"
element (".oo-ui-dialog #data-bridge-app .wb-db-bridge") still not displayed after 10000ms
INFO:backend.PhpWebserver:[Thu Apr 22 01:44:22 2021] 127.0.0.1:49814 [200]: /api.php?action=wbgetentities&format=json&props=labels%7Cdatatype%7Cinfo%7Cclaims&ids=P13%7CQ31&languages=he&languagefallback=true&formatversion=2
INFO:backend.PhpWebserver:[Thu Apr 22 01:44:22 2021] 127.0.0.1:49816 [200]: /api.php?action=query&format=json&meta=wbdatabridgeconfig%7Csiteinfo&formatversion=2&errorformat=raw&titles=Item%3AQ31&prop=info&intestactions=edit&intestactionsdetail=full&siprop=restrictions
INFO:backend.PhpWebserver:[Thu Apr 22 01:44:22 2021] 127.0.0.1:49846 [200]: //index.php?title=Special%3AUserLogin
addshore@contint2001:~$ grep -l "Data-bridge-test-page-0.09227064126814599" /srv/jenkins/builds/*-selenium-*/*/log
/srv/jenkins/builds/wmf-quibble-selenium-php72-docker/90630/log

https://integration.wikimedia.org/ci/job/wmf-quibble-selenium-php72-docker/90630

Log 4

API call apparent time in webserver logs, after index.php request: 1) 1s 2) 2s 3) 2s
Perhaps this one failed due to PHP Notice: Undefined property: ApiPageSet::$titleFormatter in /workspace/src/includes/api/ApiPageSet.php on line 1203 ?

INFO:backend.PhpWebserver:[Fri Apr 23 15:24:54 2021] 127.0.0.1:50180 [200]: //api.php?format=json
--
INFO:backend.PhpWebserver:[Fri Apr 23 15:24:54 2021] 127.0.0.1:50198 [200]: //index.php?title=Talk%3AData-bridge-test-page-0.42619402049177557-I%C3%B1t%C3%ABrn%C3%A2ti%C3%B4n%C3%A0liz%C3%A6ti%C3%B8n
INFO:backend.PhpWebserver:[Fri Apr 23 15:24:55 2021] PHP Notice:  Undefined property: ApiPageSet::$titleFormatter in /workspace/src/includes/api/ApiPageSet.php on line 1203
INFO:backend.PhpWebserver:[Fri Apr 23 15:24:55 2021] 127.0.0.1:50202 [200]: /api.php?action=query&format=json&titles=Talk%3AData-bridge-test-page-0.42619402049177557-I%C3%B1t%C3%ABrn%C3%A2ti%C3%B4n%C3%A0liz%C3%A6ti%C3%B8n&prop=info&meta=siteinfo&intestactions=edit&intestactionsdetail=full&siprop=restrictions&errorformat=raw&formatversion=2
INFO:backend.PhpWebserver:[Fri Apr 23 15:24:56 2021] 127.0.0.1:50206 [200]: /api.php?action=wbgetentities&format=json&props=labels%7Cdatatype%7Cinfo%7Cclaims&ids=P13%7CQ27&languages=he&languagefallback=true&formatversion=2
INFO:backend.PhpWebserver:[Fri Apr 23 15:24:56 2021] PHP Notice:  Undefined property: ApiPageSet::$titleFormatter in /workspace/src/includes/api/ApiPageSet.php on line 1203
INFO:backend.PhpWebserver:[Fri Apr 23 15:24:56 2021] 127.0.0.1:50208 [200]: /api.php?action=query&format=json&meta=wbdatabridgeconfig%7Csiteinfo&formatversion=2&errorformat=raw&titles=Item%3AQ27&prop=info&intestactions=edit&intestactionsdetail=full&siprop=restrictions
[0-5] Video location: /workspace/log/target-property-label_uses-the-property-ID-if-no-label-in-fallback-chain-found.mp4
[0-5] 
	Screenshot: /workspace/log/uses-the-property-ID-if-no-label-in-fallback-chain-found.png

[0-5] Error in "init once app is launched target property label uses the property ID if no label in fallback chain found"
element (".oo-ui-dialog #data-bridge-app .wb-db-bridge") still not displayed after 10000ms
INFO:backend.PhpWebserver:[Fri Apr 23 15:25:06 2021] 127.0.0.1:50304 [200]: //index.php?title=Special%3AUserLogin
--

Log 5

API call apparent time in webserver logs, after index.php request: 1) 1s 2) 14s 3) 14s

INFO:backend.PhpWebserver:[Mon Apr 26 11:25:31 2021] 127.0.0.1:46940 [200]: //api.php?format=json
INFO:backend.PhpWebserver:[Mon Apr 26 11:25:31 2021] 127.0.0.1:46942 [200]: //index.php?title=Talk%3AData-bridge-test-page-0.8411407394109791-I%C3%B1t%C3%ABrn%C3%A2ti%C3%B4n%C3%A0liz%C3%A6ti%C3%B8n
INFO:backend.PhpWebserver:[Mon Apr 26 11:25:32 2021] 127.0.0.1:46950 [200]: /api.php?action=query&format=json&titles=Talk%3AData-bridge-test-page-0.8411407394109791-I%C3%B1t%C3%ABrn%C3%A2ti%C3%B4n%C3%A0liz%C3%A6ti%C3%B8n&prop=info&meta=siteinfo&intestactions=edit&intestactionsdetail=full&siprop=restrictions&errorformat=raw&formatversion=2
[0-5] Video location: /workspace/log/target-property-label_uses-the-property-ID-if-no-label-in-fallback-chain-found.mp4
[0-5] 
	Screenshot: /workspace/log/uses-the-property-ID-if-no-label-in-fallback-chain-found.png

[0-5] Error in "init once app is launched target property label uses the property ID if no label in fallback chain found"
element (".oo-ui-dialog #data-bridge-app .wb-db-bridge") still not displayed after 10000ms
INFO:backend.PhpWebserver:[Mon Apr 26 11:25:44 2021] 127.0.0.1:46952 [200]: /api.php?action=wbgetentities&format=json&props=labels%7Cdatatype%7Cinfo%7Cclaims&ids=P13%7CQ31&languages=he&languagefallback=true&formatversion=2
INFO:backend.PhpWebserver:[Mon Apr 26 11:25:44 2021] 127.0.0.1:46954 [200]: /api.php?action=query&format=json&meta=wbdatabridgeconfig%7Csiteinfo&formatversion=2&errorformat=raw&titles=Item%3AQ31&prop=info&intestactions=edit&intestactionsdetail=full&siprop=restrictions
INFO:backend.PhpWebserver:[Mon Apr 26 11:25:44 2021] 127.0.0.1:47074 [200]: //index.php?title=Special%3AUserLogin
addshore@contint2001:~$ grep -l "Data-bridge-test-page-0.8411407394109791" /srv/jenkins/builds/*-selenium-*/*/log
/srv/jenkins/builds/wmf-quibble-selenium-php72-docker/91140/log

https://integration.wikimedia.org/ci/job/wmf-quibble-selenium-php72-docker/91140

Change 682705 had a related patch set uploaded (by Addshore; author: Addshore):

[mediawiki/extensions/Wikibase@master] bridge: Switch tests waiting for bridge to open from 10 -> 20s wait

https://gerrit.wikimedia.org/r/682705

I briefly chatted with Release-Engineering-Team folks today about this but it seems that the correct level might be the Cloud-Services team.
Thus I am tagging re this "memory compaction" thing to see if this is the sort of thing that would slow processing while it happens.
And also to see if there is anything we could do about reducing this on CI nodes.

Addshore renamed this task from Wikibase selenium tests fails: Error: element (".oo-ui-dialog #data-bridge-app .wb-db-bridge") still not displayed after 10000ms to Wikibase selenium tests timeout, seemingly due to "memory compaction" events on CI VMs.Apr 27 2021, 3:32 PM
Addshore updated the task description. (Show Details)

TLDR: looks like there is not enough memory, at least on integration-agent-docker-1006

Log 2 and Log 3 fail at the same time on the same integration node (02:44:07 vs 02:44:15)

Grafana for the node running the job https://grafana-labs.wikimedia.org/d/000000590/instance-details?orgId=1&from=1619053200000&to=1619056800000&var-project=integration&var-job=node&var-node=integration-agent-docker-1006

From that dashboard under Memory Detail Meminfo we can see the memory committed exceeded the limit:

commit_limit.png (435×914 px, 47 KB)

Maybe that in turns trigger the memory compaction system which seems to be a Linux feature to "defrag" the memory.

I note that integration-agent-docker-1006 seems to only have 8G of RAM!!!!!!!!!

$ free -m
              total        used        free      shared  buff/cache   available
Mem:           7721        2310        3353         572        2057        4562
Swap:          7947         452        7495

I am pretty sure we had them with 32G since they can run up to 4 jobs concurrently. I can't reach out to Horizon right now to confirm the VM memory.

It happened (per comments above) on 1006 1007 and 1010, so when cloud land is back up it would be worth checking the memory on those VMs too

TLDR: looks like there is not enough memory, at least on integration-agent-docker-1006

Log 2 and Log 3 fail at the same time on the same integration node (02:44:07 vs 02:44:15)

Grafana for the node running the job https://grafana-labs.wikimedia.org/d/000000590/instance-details?orgId=1&from=1619053200000&to=1619056800000&var-project=integration&var-job=node&var-node=integration-agent-docker-1006

From that dashboard under Memory Detail Meminfo we can see the memory committed exceeded the limit:

commit_limit.png (435×914 px, 47 KB)

Maybe that in turns trigger the memory compaction system which seems to be a Linux feature to "defrag" the memory.

I note that integration-agent-docker-1006 seems to only have 8G of RAM!!!!!!!!!

$ free -m
              total        used        free      shared  buff/cache   available
Mem:           7721        2310        3353         572        2057        4562
Swap:          7947         452        7495

I am pretty sure we had them with 32G since they can run up to 4 jobs concurrently. I can't reach out to Horizon right now to confirm the VM memory.

Not sure what happened but that can be discard. After the WMCS maintenance the instances show with 24GB of RAM. I have also confirmed via Horizon that all the instances have a 24G flavor.

Not sure what happened but that can be discard. After the WMCS maintenance the instances show with 24GB of RAM. I have also confirmed via Horizon that all the instances have a 24G flavor.

Hmm, what do those grafana dashboards show then?

@Addshore could it be that the MediaWiki api is slow to respond? We have some debug logs available and attached to the build as mw-debug-www.log.gz. Also, the jobs use the php built-in server which process requests serially so that might cause issues. There is an Apache based flavor of the job which I think can be triggered via the experimental pipeline, though that surfaces some race conditions in the tests :-/

Change 682705 merged by jenkins-bot:

[mediawiki/extensions/Wikibase@master] bridge: Switch tests waiting for bridge to open from 10 -> 20s wait

https://gerrit.wikimedia.org/r/682705

Change 683141 had a related patch set uploaded (by Addshore; author: Addshore):

[mediawiki/extensions/Wikibase@REL1_36] bridge: Switch tests waiting for bridge to open from 10 -> 20s wait

https://gerrit.wikimedia.org/r/683141

@Addshore could it be that the MediaWiki api is slow to respond? We have some debug logs available and attached to the build as mw-debug-www.log.gz. Also, the jobs use the php built-in server which process requests serially so that might cause issues. There is an Apache based flavor of the job which I think can be triggered via the experimental pipeline, though that surfaces some race conditions in the tests :-/

I don't think the php built in server, or mediawiki would / could be causing these requests to take 18 seconds to complete.

A paste of the lots relating to the main failure I was investigating in this ticket can be found at P15653.
I don't see anything concerning there, but also there are not timestamps with the log lines which makes it a little hard to draw conclusions from..
Perhaps that is something we could change for easier future debugging.
That would require us to spot another one of these event in order to re look at these logs.

The requests that this relates to are included below for convenience.

12:25:31 INFO:backend.PhpWebserver:[Mon Apr 26 11:25:31 2021] 127.0.0.1:46940 [200]: //api.php?format=json
12:25:31 INFO:backend.PhpWebserver:[Mon Apr 26 11:25:31 2021] 127.0.0.1:46942 [200]: //index.php?title=Talk%3AData-bridge-test-page-0.8411407394109791-I%C3%B1t%C3%ABrn%C3%A2ti%C3%B4n%C3%A0liz%C3%A6ti%C3%B8n
12:25:31 INFO:backend.PhpWebserver:[Mon Apr 26 11:25:32 2021] 127.0.0.1:46950 [200]: /api.php?action=query&format=json&titles=Talk%3AData-bridge-test-page-0.8411407394109791-I%C3%B1t%C3%ABrn%C3%A2ti%C3%B4n%C3%A0liz%C3%A6ti%C3%B8n&prop=info&meta=siteinfo&intestactions=edit&intestactionsdetail=full&siprop=restrictions&errorformat=raw&formatversion=2
12:25:32 [0-5] Video location: /workspace/log/target-property-label_uses-the-property-ID-if-no-label-in-fallback-chain-found.mp4
12:25:42 [0-5] 
12:25:42 	Screenshot: /workspace/log/uses-the-property-ID-if-no-label-in-fallback-chain-found.png
12:25:42 
12:25:42 [0-5] Error in "init once app is launched target property label uses the property ID if no label in fallback chain found"
12:25:42 element (".oo-ui-dialog #data-bridge-app .wb-db-bridge") still not displayed after 10000ms
12:25:42 INFO:backend.PhpWebserver:[Mon Apr 26 11:25:44 2021] 127.0.0.1:46952 [200]: /api.php?action=wbgetentities&format=json&props=labels%7Cdatatype%7Cinfo%7Cclaims&ids=P13%7CQ31&languages=he&languagefallback=true&formatversion=2
12:25:44 INFO:backend.PhpWebserver:[Mon Apr 26 11:25:44 2021] 127.0.0.1:46954 [200]: /api.php?action=query&format=json&meta=wbdatabridgeconfig%7Csiteinfo&formatversion=2&errorformat=raw&titles=Item%3AQ31&prop=info&intestactions=edit&intestactionsdetail=full&siprop=restrictions

Change 685474 had a related patch set uploaded (by WMDE-leszek; author: Addshore):

[mediawiki/extensions/Wikibase@REL1_35] bridge: Switch tests waiting for bridge to open from 10 -> 20s wait

https://gerrit.wikimedia.org/r/685474

Change 685474 abandoned by WMDE-leszek:

[mediawiki/extensions/Wikibase@REL1_35] bridge: Switch tests waiting for bridge to open from 10 -> 20s wait

Reason:

https://gerrit.wikimedia.org/r/685474

Unassigning myself as I don't think there is anything more I can do here.

Change 683141 merged by jenkins-bot:

[mediawiki/extensions/Wikibase@REL1_36] bridge: Switch tests waiting for bridge to open from 10 -> 20s wait

https://gerrit.wikimedia.org/r/683141

I'm seeing this in the Selenium test for https://integration.wikimedia.org/ci/job/wmf-quibble-apache-selenium-php72-docker/1906/console but it looks like the spike is at 15:50, which is in the middle of the composer install.

image.png (752×1 px, 298 KB)

I wanted to follow-up on this ticket to say a few things from the WMCS perspective. Sorry you are experiencing weirdness! From the platform side:

  1. We can grant more resources for the project to allow you to avoid a memory limit or cpu limit-- would this help?
  2. You can recreate a new VM / flavor that could also provide higher resource limits

Not sure if either would help, but happy to grant more resources if you want to try!

Thanks. I'd be quite happy for more resources but I can't talk on behalf on releng so I think they should be in loop.

cc @hashar & @thcipriani on that.

Personally i dont think that more resources would go amiss, but It would be good to try and tie any increase in resources / specs to increased speed and stability of CI.

I did a comparison of speed running the same tests on Github actions vs on current CI VMs for the same mediawiki core change and this is what I saw (last year).

StageJenkinsGithub Actions (no caching)
Initial startup?48s46s
Fetch Code47s20m 1s
Start Backends10s10s
Install MediaWiki4s2s
Composer Install32s51s
NPM Install23s19s
Tests23m 10s16m 3s

(more details at https://github.com/addshore/wmf-gha/tree/75c525f91a8f4b04692083701022bbf0d5ae0346)

Fetch Code obviously goes faster on Jenkins, as this takes advantage of caching and being much closer to the machines with the code on them (gerrit / zuul).
However the tests take 7 extra minuites on Jenkins, which is very roughly an extra 30% of runtime.

I ran this again today, and generally speaking, every seems faster in jenkins land (comparable to github actions)

StageJenkinsGithub Actions (no caching)
Initial startup37s1s
Fetch Code53s22m 30s
Composer Install8s6s
Start Backends4s4s
Post dependency install6s3s
Install MediaWiki5s7s
NPM Install4m 39s4m 40s
Tests6m 51s7m 8s

So maybe something already changed int he past year? :)

I am not sure whether anything is actionable for this task. It got filed in August 2021 and a lot of things have changed since then (Quibble improvements, change of the underlying WMCS and Docker infra). The Wikibase test suites are definitely heavy though and we could surely run a lot of those tests in a standalone job.

@Addshore can we pair on this one to revisit the current state?

untagging per ^

Umherirrender subscribed.

My core patch https://gerrit.wikimedia.org/r/c/mediawiki/core/+/869838 gets similiar failures

https://integration.wikimedia.org/ci/job/wmf-quibble-selenium-php74-docker/12766/console

20:19:27 [chrome 90.0.4430.212 linux #0-4] 1) target property label uses the property ID if no label in fallback chain found
20:19:27 [chrome 90.0.4430.212 linux #0-4] Timeout of 60000ms exceeded. The execution in the test "target property label uses the property ID if no label in fallback chain found" took too long. Try to reduce the run time or increase your timeout for test specs (https://webdriver.io/docs/timeouts). (/workspace/src/extensions/Wikibase/client/data-bridge/tests/selenium/specs/init.js)
20:19:27 [chrome 90.0.4430.212 linux #0-4] Error: Timeout of 60000ms exceeded. The execution in the test "target property label uses the property ID if no label in fallback chain found" took too long. Try to reduce the run time or increase your timeout for test specs (https://webdriver.io/docs/timeouts). (/workspace/src/extensions/Wikibase/client/data-bridge/tests/selenium/specs/init.js)
20:19:27 [chrome 90.0.4430.212 linux #0-4]     at createTimeoutError (/workspace/src/extensions/Wikibase/client/data-bridge/node_modules/mocha/lib/errors.js:498:15)
20:19:27 [chrome 90.0.4430.212 linux #0-4]     at Test.Runnable._timeoutError (/workspace/src/extensions/Wikibase/client/data-bridge/node_modules/mocha/lib/runnable.js:431:10)
20:19:27 [chrome 90.0.4430.212 linux #0-4]     at Timeout.<anonymous> (/workspace/src/extensions/Wikibase/client/data-bridge/node_modules/mocha/lib/runnable.js:246:24)
20:19:27 [chrome 90.0.4430.212 linux #0-4]     at listOnTimeout (internal/timers.js:557:17)
20:19:27 [chrome 90.0.4430.212 linux #0-4]     at processTimers (internal/timers.js:500:7)
20:19:27 [chrome 90.0.4430.212 linux #0-4]
20:19:27 [chrome 90.0.4430.212 linux #0-4] 2) warning for anonymous edits "before each" hook for init
20:19:27 [chrome 90.0.4430.212 linux #0-4] Timeout of 60000ms exceeded. The execution in the test "init "before each" hook for "is not shown when logged in"" took too long. Try to reduce the run time or increase your timeout for test specs (https://webdriver.io/docs/timeouts). (/workspace/src/extensions/Wikibase/client/data-bridge/tests/selenium/specs/init.js)
20:19:27 [chrome 90.0.4430.212 linux #0-4] Error: Timeout of 60000ms exceeded. The execution in the test "init "before each" hook for "is not shown when logged in"" took too long. Try to reduce the run time or increase your timeout for test specs (https://webdriver.io/docs/timeouts). (/workspace/src/extensions/Wikibase/client/data-bridge/tests/selenium/specs/init.js)
20:19:27 [chrome 90.0.4430.212 linux #0-4]     at createTimeoutError (/workspace/src/extensions/Wikibase/client/data-bridge/node_modules/mocha/lib/errors.js:498:15)
20:19:27 [chrome 90.0.4430.212 linux #0-4]     at Hook.Runnable._timeoutError (/workspace/src/extensions/Wikibase/client/data-bridge/node_modules/mocha/lib/runnable.js:431:10)
20:19:27 [chrome 90.0.4430.212 linux #0-4]     at Timeout.<anonymous> (/workspace/src/extensions/Wikibase/client/data-bridge/node_modules/mocha/lib/runnable.js:246:24)
20:19:27 [chrome 90.0.4430.212 linux #0-4]     at listOnTimeout (internal/timers.js:557:17)
20:19:27 [chrome 90.0.4430.212 linux #0-4]     at processTimers (internal/timers.js:500:7)

The build has a video from that - https://integration.wikimedia.org/ci/job/wmf-quibble-selenium-php74-docker/12766/artifact/log/target-property-label_uses-the-property-ID-if-no-label-in-fallback-chain-found.mp4
Maybe that helps to find a issue or get an idea to harden the code, but that video is only there for some days