Page MenuHomePhabricator

503 spikes and resulting API slowness starting 18:45 October 26
Closed, ResolvedPublic

Description

Starting at around 18:45 on October 26 we had a huge spike of 503s.

Screenshot_20171027_123424.png (375×1 px, 32 KB)

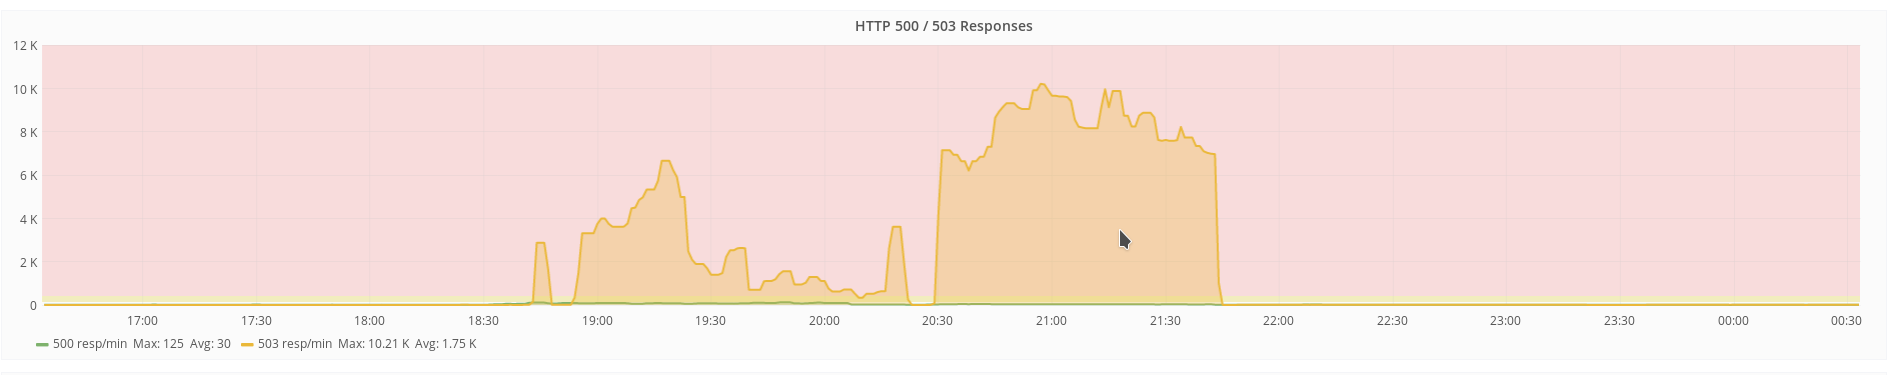
The perceivable problem on cp1053 were to many open connections to the backend, leaving no room for new requests. As we weren't able to identify what actually caused the connection limit exhaustion, we tried to disable several recently deployed/ potentially troublesome things.

Finally lifting the connection limit from 1k to 10k on cp1053 mitigated the problem, but the underlying issue is most likely still not resolved.

Related SAL entries:

 03:02 bblack: cp1067, cp4026 - backend restarts, mailbox lag
22:47 demon@tin: rebuilt wikiversions.php and synchronized wikiversions files: wikidata to wmf.4
22:39 bblack: restarting varnish-backend on cp1053 (mailbox lag from ongoing issues elsewhere?)
21:40 bblack: raising backend max_connections for api.svc.eqiad.wmnet + appservers.svc.eqiad.wmnet from 1K to 10K on cp1053.eqiad.wmnet (current funnel for the bulk of the 503s)
21:32 hoo@tin: Synchronized wmf-config/InitialiseSettings.php: Temporary disable remex html (T178632) (duration: 00m 50s)
21:30 hoo@tin: Synchronized wmf-config/InitialiseSettings.php: Temporary disable remex html (T178632) (duration: 00m 50s)
21:00 hoo: Fully revert all changes related to T178180
20:59 hoo@tin: Synchronized wmf-config/Wikibase.php: Revert "Add property for RDF mapping of external identifiers for Wikidata" (T178180) (duration: 00m 50s)
20:02 ladsgroup@tin: Synchronized wmf-config/InitialiseSettings.php: UBN! disbale ores for wikidata (T179107) (duration: 00m 50s)
20:00 ladsgroup@tin: Synchronized wmf-config/InitialiseSettings.php: UBN! disbale ores for wikidata (T179107) (duration: 00m 50s)

Changes done during investigation that need to be undone:

  • Move wikidatawiki back to wmf5
  • Re-enable remex html (T178632)
  • Re-enable the RDF mapping of external identifiers on Wikidata (T178180)
  • Re-enable constraints check with SPARQL
  • Re-enable ORES on wikidata (T179107)
  • Revert https://gerrit.wikimedia.org/r/387028 if needed (but maybe not to 100s which seems a little excessive)

Also the train was halted due to this (T174361).

Event Timeline

There are a very large number of changes, so older changes are hidden. Show Older Changes

Copying this in from etherpad (this is less awful than 6 hours of raw IRC+SAL logs, but still pretty verbose):

# cache servers work ongoing here, ethtool changes that require short depooled downtimes around short ethernet port outages:
17:49 bblack: ulsfo cp servers: rolling quick depool -> repool around ethtool parameter changes for -lro,-pause
17:57 bblack@neodymium: conftool action : set/pooled=no; selector: name=cp4024.ulsfo.wmnet
17:59 bblack: codfw cp servers: rolling quick depool -> repool around ethtool parameter changes for -lro,-pause
18:00 <+jouncebot> Amir1: A patch you scheduled for Morning SWAT (Max 8 patches) is about to be deployed. Please be around during the process. Note: If you break AND fix the wikis, you will 
                   be rewarded with a sticker.
18:27 bblack: esams cp servers: rolling quick depool -> repool around ethtool parameter changes for -lro,-pause
18:41 bblack: eqiad cp servers: rolling quick depool -> repool around ethtool parameter changes for -lro,-pause

# 5xx alerts start appearing.  initial assumption is related to ethtool work above
18:44 <+icinga-wm> PROBLEM - Esams HTTP 5xx reqs/min on graphite1001 is CRITICAL: CRITICAL: 10.00% of data above the critical threshold [1000.0]
18:46 <+icinga-wm> PROBLEM - Text HTTP 5xx reqs/min on graphite1001 is CRITICAL: CRITICAL: 22.22% of data above the critical threshold [1000.0]
18:47 <+icinga-wm> PROBLEM - Eqiad HTTP 5xx reqs/min on graphite1001 is CRITICAL: CRITICAL: 33.33% of data above the critical threshold [1000.0]
18:48 <+icinga-wm> PROBLEM - MediaWiki exceptions and fatals per minute on graphite1001 is CRITICAL: CRITICAL: 90.00% of data above the critical threshold [50.0]
# ...but once the MW exceptions hit, seems less-likely to be related to the ethtool work

# notices hit IRC for these wikidata sorting changes:
18:51 ladsgroup@tin: Synchronized php-1.31.0-wmf.5/extensions/Wikidata/extensions/Constraints/includes/ConstraintCheck/DelegatingConstraintChecker.php: Fix sorting of NullResults (T179038) (duration: 01m 04s)
18:52 ladsgroup@tin: Synchronized php-1.31.0-wmf.5/extensions/Wikidata/extensions/Constraints/tests/phpunit/DelegatingConstraintCheckerTest.php: Fix sorting of NullResults (T179038) (duration: 00m 49s)
19:12 ladsgroup@tin: Synchronized php-1.31.0-wmf.5/extensions/WikibaseQualityConstraints/tests/phpunit/DelegatingConstraintCheckerTest.php: Fix sorting of NullResults (T179038) (duration: 00m 50s)
19:14 ladsgroup@tin: Synchronized php-1.31.0-wmf.5/extensions/WikibaseQualityConstraints/includes/ConstraintCheck/DelegatingConstraintChecker.php: Fix sorting of NullResults (T179038) (duration: 00m 49s)

# Lots of discussion and digging ensues on all sides...
# bblack figures out that while the logs implicate a single eqiad text backend cache, depooling said cache moves the problem to a different cache host (repeatedly), so it doesn't seem to be a faulty cache node.
# One cache just happens to be the unlucky chash destination for more of the problematic traffic than the others at any given time.
# The problematic traffic load/patterns consumes all of the 1K connection slots varnish allows to api.svc+appservers.svc, and then this causes many unrelated 503s for lack of available backend connection slots to service requests.

# The Fatals logs seem to be related to ORES fetching from Wikidata
# So, a timeout is increased there to cope with slow wikidata responses:

19:33 awight@tin: Started deploy [ores/deploy@0adae70]: Increase extractor wikidata API timeout to 15s, T179107
19:33 awight@tin: Finished deploy [ores/deploy@0adae70]: Increase extractor wikidata API timeout to 15s, T179107 (duration: 00m 10s)
19:34 awight@tin: Started deploy [ores/deploy@0adae70]: Increase extractor wikidata API timeout to 15s, T179107
19:36 aaron@tin: Started restart [jobrunner/jobrunner@a20d043]: (no justification provided)
19:41 awight@tin: Finished deploy [ores/deploy@0adae70]: Increase extractor wikidata API timeout to 15s, T179107 (duration: 07m 25s)

# Still doesn't fix the problem, so the next attempted fix is to disable ores+wikidata entirely:

20:02 ladsgroup@tin: Synchronized wmf-config/InitialiseSettings.php: UBN! disbale ores for wikidata (T179107) (duration: 00m 50s)
20:00 ladsgroup@tin: Synchronized wmf-config/InitialiseSettings.php: UBN! disbale ores for wikidata (T179107) (duration: 00m 50s)

# Things are still borked, try reverting some other recent Wikidata-related changes:

20:59 hoo@tin: Synchronized wmf-config/Wikibase.php: Revert "Add property for RDF mapping of external identifiers for Wikidata" (T178180) (duration: 00m 50s)
21:00 hoo: Fully revert all changes related to T178180

# Still borked.  Tried reverting something else that looks dangerous in the logstash errors, but also wasn't the cause:

21:30 hoo@tin: Synchronized wmf-config/InitialiseSettings.php: Temporary disable remex html (T178632) (duration: 00m 50s)
21:32 hoo@tin: Synchronized wmf-config/InitialiseSettings.php: Temporary disable remex html (T178632) (duration: 00m 50s)

# For lack of anything better to try, raise varnish->MW connection limits by an order of magnitude to see what happens:

21:40 bblack: raising backend max_connections for api.svc.eqiad.wmnet + appservers.svc.eqiad.wmnet from 1K to 10K on cp1053.eqiad.wmnet (current funnel for the bulk of the 503s)

# At this point the large rate of unrelated 503s subsides.  Socket counts eventually stabilize without reaching the new (10K) limits on this host.  There's still clearly a problem, but this is effectively mitigating the worst of the damage for now.
# Eventually puppetize this change out to the other cache_text in eqiad and restart cp1053 backend to clear mailbox lag from the heavy connection-cycling, which moves the traffic pattern over to cp1052, where the same bad connection pattern appears yet again (but now without unrelated 503s, of course):

22:34 <+wikibugs> (CR) BBlack: [C: 2] cache_text: raise MW connection limits to 10K [puppet] - https://gerrit.wikimedia.org/r/386756 (owner: BBlack)
22:39 bblack: restarting varnish-backend on cp1053 (mailbox lag from ongoing issues elsewhere?)
22:41 < bblack> so the target cache is now cp1052 it seems

# ori chimes in out of nowhere that we should try reverting the earlier "Fix sorting of NullResults" stuff, which then leads to a decision to just roll Wikidatawiki back to wmf.4 (which undoes those changes and more):

22:47 demon@tin: rebuilt wikiversions.php and synchronized wikiversions files: wikidata to wmf.4

# In reference to how quickly this might work even if it's the right revert (finally?):

22:49 < ori> it'll probably take a few minutes

# Keep debating and staring at things.  We're still not having unrelated 503s since back at ~21:40, but the pattern (now on cp1052) of the underlying badness is still present (large counts ofsockets cycling to MW).  Eventually:

23:22 < bblack> I'm going to restart cp1052 varnish backend again just to clear out other noise that makes it harder to see what's going on
23:24 < bblack> cp1067 is the new target
[...]
23:29 < bblack> well, cp1067 isn't building up the connection stats I'd expect
23:29 < bblack> none of them seem to clearly be the target anymore...
23:30 < bblack> problem mysteriously poofed? probably not right when I moved the traffic above.  probably earlier, but varnish was still suffering until I moved it.
23:33 < bblack> yeah, still none of the eqiad text caches are showing signs of connection problems.
23:33 < bblack> the last action I took was restarting cp1052, which would've (at least, the several previous times I did this) shifting the load to a random new cache
23:34 < bblack> it was ~22:40 (nearly an hour ago) when we switched from cp1053 to cp1052
23:35 < bblack> and it was during the earlier part of that nearly-an-hour window that the wmf.4 revert for wikidatawiki happened
23:35 < bblack> I tihnk somewhere in there the underlying problem went away, and cp1052 was just still suffering lingering effects.
23:35 < bblack> that's my best hypothesis right now
[...]
23:36 < bblack> but yeah, I think the revert did it, eventually
23:37 < bblack> [plus kicking the tires of the varnish cluster to shake it out of its bad pattern afterwards]

My gut instinct remains what it was at the end of the log above. I think something in the revert of wikidatawiki to wmf.4 fixed this. And I think given the timing alignment of the Fix sorting of NullResults changes + the initial ORES->wikidata fatals makes those in particular a strong candidate. I would start with undo all of the other emergency changes first, leaving the wikidatawiki->wmf.4 bit for last.

Unless anyone objects, I'd like to start with reverting our emergency varnish max_connections changes from https://gerrit.wikimedia.org/r/#/c/386756 . Since the end of the log above, connection counts have returned to normal, which is ~100, which is 1/10th the normal 1K limit that usually isn't a problem. If we leave the 10K limit in place, it will only serve to mask (for a time) any recurrence of the issue, making it only possible to detect it early by watching varnish socket counts on all the text cache machines.

Change 386824 had a related patch set uploaded (by BBlack; owner: BBlack):
[operations/puppet@production] Revert "cache_text: raise MW connection limits to 10K"

https://gerrit.wikimedia.org/r/386824

I think I found the root cuase now, seems it's actually related to the WikibaseQualityConstraints extension:

Screenshot_20171027_145440.png (864×1 px, 257 KB)
(Permalink: https://grafana.wikimedia.org/dashboard/db/wikidata-quality?panelId=10&fullscreen&orgId=1&from=now-2d&to=now)

See also T173696: Cache format constraint check results.

I think I found the root cuase now, seems it's actually related to the WikibaseQualityConstraints extension:

Isn't that the same extension referenced in the suspect commits mentioned above?

18:51 ladsgroup@tin: Synchronized php-1.31.0-wmf.5/extensions/Wikidata/extensions/Constraints/includes/ConstraintCheck/DelegatingConstraintChecker.php: Fix sorting of NullResults (T179038) (duration: 01m 04s)
18:52 ladsgroup@tin: Synchronized php-1.31.0-wmf.5/extensions/Wikidata/extensions/Constraints/tests/phpunit/DelegatingConstraintCheckerTest.php: Fix sorting of NullResults (T179038) (duration: 00m 49s)
19:12 ladsgroup@tin: Synchronized php-1.31.0-wmf.5/extensions/WikibaseQualityConstraints/tests/phpunit/DelegatingConstraintCheckerTest.php: Fix sorting of NullResults (T179038) (duration: 00m 50s)
19:14 ladsgroup@tin: Synchronized php-1.31.0-wmf.5/extensions/WikibaseQualityConstraints/includes/ConstraintCheck/DelegatingConstraintChecker.php: Fix sorting of NullResults (T179038) (duration: 00m 49s)

Or is an unrelated problem in the same area?

The functionality has been there for longer, but the above changes made it actually work… which probably caused the heavy stress.

Change 386833 had a related patch set uploaded (by Hoo man; owner: Hoo man):
[operations/mediawiki-config@master] Disable constraints check with SPARQL for now

https://gerrit.wikimedia.org/r/386833

Change 386833 merged by jenkins-bot:
[operations/mediawiki-config@master] Disable constraints check with SPARQL for now

https://gerrit.wikimedia.org/r/386833

Mentioned in SAL (#wikimedia-operations) [2017-10-27T15:50:58Z] <hoo@tin> Synchronized wmf-config/Wikibase-production.php: Disable constraints check with SPARQL for now (T179156) (duration: 00m 50s)

Mentioned in SAL (#wikimedia-operations) [2017-10-27T17:54:14Z] <hoo> Taking mwdebug1001 to do tests regarding T179156

Change 386939 had a related patch set uploaded (by BBlack; owner: BBlack):
[operations/puppet@production] Varnish: puppetize per-backend between_bytes_timeout

https://gerrit.wikimedia.org/r/386939

Change 386939 merged by BBlack:
[operations/puppet@production] Varnish: puppetize per-backend between_bytes_timeout

https://gerrit.wikimedia.org/r/386939

Happening again, this time on cp1055.

Example from mw1180:

$ ss --tcp -r | grep -oP 'cp\d+' | sort | uniq -c
      2 cp1053
     20 cp1055
      2 cp1066
      1 cp1068

Also:

$ cat /tmp/apache_status.mw1180.1509206746.txt | grep 10.64.32.107 | wc -l
31
$ cat /tmp/apache_status.mw1180.1509206746.txt | grep 10.64.32.107 | grep NULL | wc -l
12

Also on mw1180:

$ sudo -u www-data ss --tcp -r -p > ss
$ cat ss | grep -c FIN-WAIT-2
16
$ cat ss | grep -c cp1055
18
$ cat ss | grep -v cp1055 | grep -c FIN-WAIT-2
0
Paladox triaged this task as Unbreak Now! priority.Oct 28 2017, 4:22 PM

Spoke to hoo on irc, who agreed it's an UBN now.

Mentioned in SAL (#wikimedia-operations) [2017-10-28T16:51:54Z] <elukey> restart varnish backend on cp1055 - mailbox lag + T179156

Mentioned in SAL (#wikimedia-operations) [2017-10-28T19:39:06Z] <hoo@tin> Synchronized wmf-config/CommonSettings.php: Half the Flow -> Parsoid timeout (100s -> 50s) (T179156) (duration: 00m 51s)

Updates from the Varnish side of things today (since I've been bad about getting commits/logs tagged onto this ticket):

  • 18:15 - I took over looking at today's outburst on the Varnish side
  • The current target at the time was cp1053 (after elukey's earlier restart of cp1055 varnish-be above)
  • 18:21 - I manually reduced the backend timeouts for api+appservers to from defaults of connect/firstbyte/betweenbytes of 5/180/60 to 3/20/10
  • cp1053 had already been under assault for quite a while though, and this didn't seem to help much.
  • 18:39 - restarted varnish-be on cp1053 to clear it of issues and move to a new target
  • 18:41 - identified cp1065 as the new target (more on identifying these below!)
  • 18:42 - Merged->deployed https://gerrit.wikimedia.org/r/#/c/387024/ to apply the shorter-timeouts workaround above to all text caches
  • at this point, cp1065 was showing various signs of the issue (rising connection counts + mailbox lag), but connection counts stabilized much lower than before, ~200-300 instead of rising towards ~3K, an apparent success of the timeout-reduction mitigation.
  • 18:56 - Identified the first slow-running requests in cp1065 logs with the reduced timeouts:
18:56 < bblack> -   BereqURL       
/w/api.php?action=flow-parsoid-utils&from=wikitext&to=html&content=%7B%7BQ%7C352804%7D%7D+has+date+P569%3A+1533-01-01%2C+but+%5Bhttp%3A%2F%2Fd-nb.info%2Fgnd%2F100198414+GND%5D+has+1534&title=Q352804&format=json
18:56 < bblack> -   BereqHeader    Host: www.wikidata.org
18:56 < bblack> -   Timestamp      Bereq: 1509216884.761646 0.000042 0.000042
18:56 < bblack> -   Timestamp      Beresp: 1509216965.538549 80.776945 80.776903
18:56 < bblack> -   Timestamp      Error: 1509216965.538554 80.776950 0.000005
18:56 < bblack> -   Timestamp      Start: 1509216970.911803 0.000000 0.000000
  • after this, identified several other slow requests. All were for the same basic flow-parsoid-utils API + www.wikidata.org
  • 19:39 - hoo's parsoid timeout reduction for Flow (above) hits
  • 19:39 - restarted varnish-backend on cp1065 due to rising mailbox lag
  • 19:41 - new target seems to be cp1067, briefly, but within a minute or two it recovers to normal state and stops exhibiting the symptoms much? Apparently the problem-causing traffic may have temporarily died off on its own.

For future reference by another opsen who might be looking at this: one of the key metrics that identifies what we've been calling the "target cache" in eqiad, the one that will (eventually) have issues due to whatever bad traffic is currently mapped through it, is by looking at the connection counts to appservers.svc.eqiad.wmnet + api-appservers.svc.eqiad.wmnet on all the eqiad cache nodes. For this, I've been using:

bblack@neodymium:~$ sudo cumin A:cp-text_eqiad 'netstat -an|egrep "10\.2\.2\.(1|22)"|awk "{print \$5}"|sort|uniq -c|sort -n'

Which during the latter/worst part of cp1053's earlier target-period produced output like:

===== NODE GROUP =====                                                                                                                                                                         
(1) cp1068.eqiad.wmnet                                                                                                                                                                         
----- OUTPUT of 'netstat -an|egre...|uniq -c|sort -n' -----                                                                                                                                    
      1 10.2.2.18:8080                                                                                                                                                                         
     15 10.2.2.17:7231                                                                                                                                                                         
     79 10.2.2.1:80
    111 10.2.2.22:80
===== NODE GROUP =====                                                                                                                                                                         
(1) cp1066.eqiad.wmnet                                                                                                                                                                         
----- OUTPUT of 'netstat -an|egre...|uniq -c|sort -n' -----                                                                                                                                    
      1 10.2.2.18:8080                                                                                                                                                                         
     14 10.2.2.17:7231                                                                                                                                                                         
     92 10.2.2.1:80
    111 10.2.2.22:80
===== NODE GROUP =====                                                                                                                                                                         
(1) cp1052.eqiad.wmnet                                                                                                                                                                         
----- OUTPUT of 'netstat -an|egre...|uniq -c|sort -n' -----                                                                                                                                    
      1 10.2.2.18:8080                                                                                                                                                                         
     14 10.2.2.17:7231                                                                                                                                                                         
    100 10.2.2.1:80
    116 10.2.2.22:80
===== NODE GROUP =====                                                                                                                                                                         
(1) cp1054.eqiad.wmnet                                                                                                                                                                         
----- OUTPUT of 'netstat -an|egre...|uniq -c|sort -n' -----                                                                                                                                    
      1 10.2.2.18:8080                                                                                                                                                                         
     17 10.2.2.17:7231                                                                                                                                                                         
    125 10.2.2.1:80
    126 10.2.2.22:80
===== NODE GROUP =====                                                                                                                                                                         
(1) cp1067.eqiad.wmnet                                                                                                                                                                         
----- OUTPUT of 'netstat -an|egre...|uniq -c|sort -n' -----                                                                                                                                    
      1 10.2.2.18:8080                                                                                                                                                                         
     16 10.2.2.17:7231                                                                                                                                                                         
     78 10.2.2.1:80
    140 10.2.2.22:80
===== NODE GROUP =====                                                                                                                                                                         
(1) cp1065.eqiad.wmnet                                                                                                                                                                         
----- OUTPUT of 'netstat -an|egre...|uniq -c|sort -n' -----                                                                                                                                    
      1 10.2.2.18:8080                                                                                                                                                                         
     46 10.2.2.17:7231                                                                                                                                                                         
     85 10.2.2.1:80
    113 10.2.2.22:80
===== NODE GROUP =====                                                                                                                                                                         
(1) cp1053.eqiad.wmnet                                                                                                                                                                         
----- OUTPUT of 'netstat -an|egre...|uniq -c|sort -n' -----                                                                                                                                    
      2 10.2.2.18:8080                                                                                                                                                                         
   1140 10.2.2.17:7231                                                                                                                                                                         
   3031 10.2.2.22:80
   3345 10.2.2.1:80
===== NODE GROUP =====                                                                                                                                                                         
(1) cp1055.eqiad.wmnet                                                                                                                                                                         
----- OUTPUT of 'netstat -an|egre...|uniq -c|sort -n' -----                                                                                                                                    
      3 10.2.2.18:8080                                                                                                                                                                         
     27 10.2.2.17:7231                                                                                                                                                                         
     98 10.2.2.1:80
    123 10.2.2.22:80
================                                         `

Above, you can see most of the nodes have ~100 sockets to .1 and .22 (appservers and api-appservers), but cp1053 has ~3K (most of which will be in CLOSE_WAIT). It takes a while to build up to ~3K under the pressure of the problem, but that's about the plateau we've seen. Once a node's mailbox lag gets bad and the connection counts are up in this range, usually the recourse is to restart that varnish backend (run-no-puppet varnish-backend-restart) to move the problem to a new node and restart the clock on the badness impacting a varnishd.

A while after the above, @hoo started focusing on a different aspect of this we've been somewhat ignoring as more of a side-symptom: that there tend to be a lot of sockets in a strange state on the "target" varnish, to various MW nodes. They look strange on both sides, in that they spend significant time in the CLOSE_WAIT state on the varnish side and FIN_WAIT_2 on the MW side. This is a consistent state between the two nodes, but it's not usually one that non-buggy application code spends much time in. In this state, the MW side has sent FIN, Varnish has seen that and sent FIN+ACK, but Varnish has not yet decided to send its own FIN to finish the active closing process, and MW is still waiting on it.

While staring at the relevant Varnish code to figure out why or how it would delay closing in this case, it seemed like it was possible in certain cases related to connections in the VBC_STOLEN state. Instead of closing immediately, in some such cases it defers killing the socket until some future eventloop event fires, which could explain the closing-delays under heavy load (and we know Varnish is backlogged in some senses when the problem is going on, because mailbox lag rises indefinitely). All of that aside, at some point while staring at related code I realized that do_stream behaviors can influence some related things as well, and we had a recent related VCL patch....

The patch in question was https://gerrit.wikimedia.org/r/#/c/386616/ , which was merged around 14:13 Oct 26, about 4.5 hours before the problems were first noticed (!).

I manually reverted the patch on cp1067 (current target problem node) as a test, and all of the CLOSE_WAIT sockets disappeared shortly, never to return. I reverted the whole patch through gerrit shortly afterwards, so that's permanent now across the board.

I think there's a strong chance this patch was the catalyst for start of the problems. At the very least, it was exacerbating the impact of the problems. If it turns out to be the problem, I think we still have more post-mortem investigation to do here, because the issues that raises are tricky. If it's just exacerbating, I think it's still useful to think about why it would, because that may help pin down the real problem.

Operating on the assumption that it's the catalyst and diving a little deeper on that angle:

The patch simply turned off do_stream behavior when the backend-most Varnish was talking to application layer services, when the applayer response did not contain a Content-Length header. Turning off do_stream makes Varnish act in a store-and-forward mode for the whole response, rather than forwarding bytes onwards to upstream clients as they arrive from the application. The benefit we were aiming for there was to have Varnish calculate the value of the missing Content-Length so that we can make more-informed cache-tuning decisions at higher layers. Minor performance tradeoffs aside, turning off do_stream shouldn't be harmful to any of our HTTP transactions under "reasonable" assumptions (more later on what "reasonable" is here). In fact, that was the default/only mode our caches operated in back when we were running Varnish 3, but streaming became the default for the text cluster when it switched to Varnish 4 just under a year ago. So this was "OK" a year ago, but clearly isn't ok for some requests today.

That there was always a singular chash target within the text cluster for the problems also resonates here: there's probably only one special URI out there which breaks the "reasonable" assumption. Another oddity that we didn't delve into much before was that when we restarted the problematic varnish, it only depooled for a short period (<1 min), yet the problem would move *permanently* to its next chash target node and stay there even after the previous target node was repooled. This might indicate that the clients making these requests are doing so over very-long-lived connections, and even that the request->response cycle itself must be very-long-lived.... It moves via re-chashing when a backend is restarted, but doesn't move on repool because everything's still connected and transacting...

My best hypothesis for the "unreasonable" behavior that would break under do_stream=false is that we have some URI which is abusing HTTP chunked responses to stream an indefinite response. Sort of like websockets, but using the normal HTTP protocol primitives. Client sends a request for "give me a live stream of some events or whatever", and the server periodically sends new HTTP response chunks to the client containing new bits of the event feed. Varnish has no way to distinguish this behavior from normal chunked HTTP (where the response chunks will eventually reach a natural end in a reasonable timeframe), and in the do_stream=false store-and-forward mode, Varnish would consume this chunk stream into its own memory buffers indefinitely, waiting for the stream to end before it can forward the whole thing to the client. This behavior would line up with a lot of the strange stats indicators we've seen in Varnish recently (both during this problem, and at other earlier points in time).

Does anyone know of something we've added in the past ~1y that has this behavior through the text caches? I don't recall having heard about it! Later (not now, as I have a weekend to get back to!) I'll do some digging to find such traffic patterns and empirically nail it down, but it might save a lot of trouble if someone already knows what this is.

For future reference by another opsen who might be looking at this: one of the key metrics that identifies what we've been calling the "target cache" in eqiad, the one that will (eventually) have issues due to whatever bad traffic is currently mapped through it, is by looking at the connection counts to appservers.svc.eqiad.wmnet + api-appservers.svc.eqiad.wmnet on all the eqiad cache nodes.

I've just added a dashboard plotting per-backend connection count, which should be helpful to pinpoint the "target cache" (cp1054 in the example).

Does Echo have any kind of push notification going on, even in light testing yet?

Now that I'm digging deeper, it seems there are one or more projects in progress built around Push-like things, in particular T113125 . I don't see any evidence that there's been live deploy of them yet, but maybe I'm missing something or other. If we have a live deploy of any kind of push-like functionality through the text cluster, it's a likely candidate for issues above in the short term.

In the long term, discussions about push services need to loop in Traffic much earlier in the process. This kind of thing is a definite No through the current traffic termination architecture as it's configured today. I've even seen some tickets mention the possibility of push for anonymous users (!). The changes on our end to sanely accommodate various push technologies reliably at wiki-scale could potentially be very large and costly, and could involve carving out a separate parallel edge-facing architecture for this stuff, distinct from the edge architecture we use for simpler transactions. We don't have any kind of long-term planning at the Traffic level around supporting this in our annual plans and headcounts, either. It may seem like a small thing from some perspectives, but push notifications at wiki-scale is a huge sea-change on our end from simple HTTP transactions.

Does Echo have any kind of push notification going on, even in light testing yet?

Nothing that's deployed AFAIK. The only live polling feature I can think of that was recently introduced is for the live updates to Special:RecentChanges. (Visit https://www.mediawiki.org/wiki/Special:RecentChanges and click "Live updates").

Change 387188 had a related patch set uploaded (by Hoo man; owner: Hoo man):
[operations/mediawiki-config@master] Revert "Wikidatawiki to wmf.4"

https://gerrit.wikimedia.org/r/387188

Change 387189 had a related patch set uploaded (by Hoo man; owner: Hoo man):
[operations/mediawiki-config@master] Revert "Disable constraints check with SPARQL for now"

https://gerrit.wikimedia.org/r/387189

Change 387190 had a related patch set uploaded (by Hoo man; owner: Hoo man):
[operations/mediawiki-config@master] Revert "Revert "Add property for RDF mapping of external identifiers for Wikidata""

https://gerrit.wikimedia.org/r/387190

My best hypothesis for the "unreasonable" behavior that would break under do_stream=false is that we have some URI which is abusing HTTP chunked responses to stream an indefinite response. Sort of like websockets, but using the normal HTTP protocol primitives. Client sends a request for "give me a live stream of some events or whatever", and the server periodically sends new HTTP response chunks to the client containing new bits of the event feed. Varnish has no way to distinguish this behavior from normal chunked HTTP (where the response chunks will eventually reach a natural end in a reasonable timeframe), and in the do_stream=false store-and-forward mode, Varnish would consume this chunk stream into its own memory buffers indefinitely, waiting for the stream to end before it can forward the whole thing to the client. This behavior would line up with a lot of the strange stats indicators we've seen in Varnish recently (both during this problem, and at other earlier points in time).

There's a timeout limiting the total amount of time varnish is allowed to spend on a single request, send_timeout, defaulting to 10 minutes. Unfortunately there's no counter tracking when the timer kicks in, although a debug line is logged to VSL when that happens. We can identify requests causing the "unreasonable" behavior as follows:

varnishlog -q 'Debug ~ "Hit total send timeout"'

Change 387188 merged by jenkins-bot:
[operations/mediawiki-config@master] Revert "Wikidatawiki to wmf.4"

https://gerrit.wikimedia.org/r/387188

Mentioned in SAL (#wikimedia-operations) [2017-10-30T11:15:55Z] <hoo@tin> rebuilt wikiversions.php and synchronized wikiversions files: Wikidatawiki back to wmf.5 (T179156)

The only live polling feature I can think of that was recently introduced is for the live updates to Special:RecentChanges.

As far as I know, that feature just reloads the recent changes every few seconds with a new request.

Another thing that might be similar: for certain queries, the Wikidata Query Service can push out lots of results for up to sixty seconds (at which point the query is killed by timeout) or even longer (if the server returned results faster than they could be transferred – it seems the timeout only applies to the query itself). The simplest such query would be SELECT * WHERE { ?s ?p ?o. }; when I just tried it out (curl -d 'query=SELECT * WHERE { ?s ?p ?o. }' https://query.wikidata.org/sparql -o /dev/null), I received 1468M in 5 minutes (at which point I killed curl – I have no idea how much longer it would have continued to receive results). However, if I understand it correctly, WDQS’ proxy seems to be running in do_stream mode, since I’m receiving results immediately and continuously.

Change 387189 merged by jenkins-bot:
[operations/mediawiki-config@master] Revert "Disable constraints check with SPARQL for now"

https://gerrit.wikimedia.org/r/387189

Mentioned in SAL (#wikimedia-operations) [2017-10-30T11:33:14Z] <hoo@tin> Synchronized wmf-config/Wikibase-production.php: Re-enable constraints check with SPARQL (T179156) (duration: 00m 50s)

Change 387190 merged by jenkins-bot:
[operations/mediawiki-config@master] Revert "Revert "Add property for RDF mapping of external identifiers for Wikidata""

https://gerrit.wikimedia.org/r/387190

Mentioned in SAL (#wikimedia-operations) [2017-10-30T11:44:38Z] <hoo@tin> Synchronized wmf-config/Wikibase.php: Re-add property for RDF mapping of external identifiers for Wikidata (T179156, T178180) (duration: 00m 49s)

There's a timeout limiting the total amount of time varnish is allowed to spend on a single request, send_timeout, defaulting to 10 minutes. Unfortunately there's no counter tracking when the timer kicks in, although a debug line is logged to VSL when that happens. We can identify requests causing the "unreasonable" behavior as follows:

varnishlog -q 'Debug ~ "Hit total send timeout"'

Yeah, this might help find the triggering clients. However, I don't know if the backend side of Varnish would actually abandon the backend request on send_timeout to the client....

Another thing that might be similar: for certain queries, the Wikidata Query Service can push out lots of results for up to sixty seconds (at which point the query is killed by timeout) or even longer (if the server returned results faster than they could be transferred – it seems the timeout only applies to the query itself). The simplest such query would be SELECT * WHERE { ?s ?p ?o. }; when I just tried it out (curl -d 'query=SELECT * WHERE { ?s ?p ?o. }' https://query.wikidata.org/sparql -o /dev/null), I received 1468M in 5 minutes (at which point I killed curl – I have no idea how much longer it would have continued to receive results). However, if I understand it correctly, WDQS’ proxy seems to be running in do_stream mode, since I’m receiving results immediately and continuously.

That's probably not causing the problem on text-lb, since query.wikidata.org goes through cache_misc at present. But if there's no known actual-push traffic, the next-best hypothesis is behavior exactly like the above: something that's doing a legitimate request->response cycle, but trickling out the bytes of it over a very long period. This would wrap back around to why we were looking at some of these cases before I think: could other services on text-lb be making these kinds of queries to WDQS on behalf of the client and basically proxying the same behavior through?

Change 386824 merged by BBlack:
[operations/puppet@production] Revert "cache_text: raise MW connection limits to 10K"

https://gerrit.wikimedia.org/r/386824

could other services on text-lb be making these kinds of queries to WDQS on behalf of the client and basically proxying the same behavior through?

WikibaseQualityConstraints runs a limited set of queries, but none that could return a lot of results, I think. It also sets a stricter timeout for those queries (5 s iirc) and also applies that timeout + 1 s to the MWHttpRequest.

Change 387225 had a related patch set uploaded (by BBlack; owner: BBlack):
[operations/puppet@production] cache_text: reduce applayer timeouts to reasonable values

https://gerrit.wikimedia.org/r/387225

Change 387228 had a related patch set uploaded (by BBlack; owner: BBlack):
[operations/puppet@production] cache_text: reduce inter-cache backend timeouts as well

https://gerrit.wikimedia.org/r/387228

Change 387236 had a related patch set uploaded (by BBlack; owner: BBlack):
[operations/debs/varnish4@debian-wmf] [WIP] backend transaction_timeout

https://gerrit.wikimedia.org/r/387236

@BBlack wrote:

something that's doing a legitimate request->response cycle, but trickling out the bytes of it over a very long period.

That's a well known attack method. Could this be coming from the outside, trickling bits bytes of a post? Are we sure we are safe against this kind of attack?

Also: is there an equivalent of mysql's slow query log for the app servers? E.g. is there a way to see what requests to longer than n seconds on the app servers?

Trickled-in POST on the client side would be something else. Varnish's timeout_idle, which is set to 5s on our frontends, acts as the limit for receiving all client request headers, but I'm not sure that it has such a limitation that applies to client-sent bodies. In any case, this would consume front-edge client connections, but wouldn't trigger anything deeper into the stack. We could/should double-check varnish's behavior there, but that's not what's causing this, this is definitely on the receiving end of responses from the applayer.

In any case, this would consume front-edge client connections, but wouldn't trigger anything deeper into the stack

That's assuming varnish always caches the entire request, and never "streams" to the backend, even for file uploads. When discussing this with @hoo he told me that this should be the case - but is it? That would make it easy to exhaust RAM on the varnish boxes, no?

this is definitely on the receiving end of responses from the applayer.

So a slow-request-log would help?

In any case, this would consume front-edge client connections, but wouldn't trigger anything deeper into the stack

That's assuming varnish always caches the entire request, and never "streams" to the backend, even for file uploads. When discussing this with @hoo he told me that this should be the case - but is it? That would make it easy to exhaust RAM on the varnish boxes, no?

Maybe? I haven't really delved deeply into this angle yet, because it seems less-likely to be the cause of the current issues. We have an obvious case of normal slow chunked uploads of large files to commons to look at for examples to observe, though. Because they're POST they'd be handled as an immediate pass through the varnish layers, so I don't think this would cause what we're looking at now. GETs with request-bodies that were slowly-chunked-out might be different, I don't know yet.

this is definitely on the receiving end of responses from the applayer.

So a slow-request-log would help?

Yes. We've gathered those manually in specific cases so far. Aggregating them across the varnishes to somewhere central all the time will require some significant work I think. Right now I'm more-worried about the fact that, since varnish doesn't log a transaction at all until the transaction is complete, without overall transaction timeouts on the backend connections there are cases that would slip through all possible logging (if they stayed open virtually-indefinitely and sent data often enough to evade the between_bytes_timeout check).

BBlack lowered the priority of this task from Unbreak Now! to High.Oct 30 2017, 4:28 PM

Reducing this from UBN->High, because current best-working-theory is this problem is gone so long as we keep the VCL do_stream=false change reverted. Obviously, there's still some related investigations ongoing, and I'm going to write up an Incident_Report about the 503s later today as well.

Because they're POST they'd be handled as an immediate pass through the varnish layers, so I don't think this would cause what we're looking at now.

"pass" means stream, right? wouldn't that also grab a backend connection from the pool, and hog it if throughput is slow?

We've gathered those manually in specific cases so far. Aggregating them across the varnishes to somewhere central all the time will require some significant work I think.

How about doing this on the app servers instead of varnish? We do track MediaWiki execution time, right? Would it be possible to also track overall execution time, from the moment php starts receiving data, before giving controle to mediawiki?

We have an obvious case of normal slow chunked uploads of large files to commons to look at for examples to observe, though.

Rewinding a little: this is false, I was just getting confused by terminology. Commons "chunked" uploads through UploadWizard are not HTTP chunked transfer encoding, which is what I meant by "chunked uploads" in the rest of this conversation.

"pass" means stream, right? wouldn't that also grab a backend connection from the pool, and hog it if throughput is slow?

I'm pretty sure non-piped client request bodies are not streamed to backends, looking at the code (even in the pass case), and we don't use pipe-mode in cache_text at all. There's still an open question about whether that allows for resource exhaustion on the frontend (plain memory consumption, or slowloris-like), but again it's not the problem we're looking at here.

We've gathered those manually in specific cases so far. Aggregating them across the varnishes to somewhere central all the time will require some significant work I think.

How about doing this on the app servers instead of varnish? We do track MediaWiki execution time, right? Would it be possible to also track overall execution time, from the moment php starts receiving data, before giving controle to mediawiki?

That would be nice too I think. But at the end of the day, probably our Varnishes should assume that we won't necessarily have sane execution timeouts at all possible underlying applayer services (if nothing else because Bugs). So we probably still want to capture this at the Varnish level as well.

Relatedly, I know hhvm has a max_execution_time parameter which we've set to 60s, so you'd *think* that would be a limit for the MediaWiki requests in question. But on the other hand, I know during the weekend I logged requests going into (through?) the MW API for flow-parsoid stuff that timed out at ~80s (when we had the super-short Varnish timeouts configured as emergency workaround, which helped somewhat).

This comment was removed by BBlack.

Change 387225 merged by BBlack:
[operations/puppet@production] cache_text: reduce applayer timeouts to reasonable values

https://gerrit.wikimedia.org/r/387225

Change 387228 merged by BBlack:
[operations/puppet@production] cache_text: reduce inter-cache backend timeouts as well

https://gerrit.wikimedia.org/r/387228

BBlack changed the task status from Open to Stalled.Nov 6 2017, 9:37 PM
BBlack lowered the priority of this task from High to Medium.

The timeout changes above will offer some insulation, and as time passes we're not seeing evidence of this problem recurring with the do_stream=false patch reverted.

Some related investigations on slow requests have turned up some pointers 120-240s timeouts on requests to the REST API at /api/rest_v1/transform/wikitext/to/html. which are eerily similar to the kinds of problems we saw a while back in T150247 . RB was dropping the connection from Varnish, and doing so in a way that Varnish would retry it indefinitely internally. We patched Varnish to mitigate that particular problem in the past, but something related may be surfacing here...

We have a few steps to go here, but there's going to be considerable delays before we get to the end of all of this:

  • We have a preliminary patch to Varnish to limit the total response transaction time on backend requests (if the backend is dribbling response bytes often enough to evade hitting the between_bytes_timeout) at https://gerrit.wikimedia.org/r/#/c/387236/ . However, the patch is built on Varnish v5, and cache_text currently runs Varnish v4. We weren't planning to do any more Varnish v4 releases before moving all the clusters to v5 unless an emergency arose, as it complicates our process and timelines considerably, and this isn't enough of an emergency to justify it. Therefore, this part is blocked on https://phabricator.wikimedia.org/T168529 .
  • We want to log slow backend queries so that we have a better handle on these cases in general. There's ongoing work for this in https://gerrit.wikimedia.org/r/#/c/389515/ , https://gerrit.wikimedia.org/r/#/c/389516 , and more to come. One of those patches also has the v4/v5 issues above and blocks on upgrading cache_text to v5.
  • With those measures in place, we should be able to definitively identify (and/or workaround) the problematic transactions and figure out what needs fixing at the application layer, at which point we can un-revert the do_stream=false and move forward with our other VCL plans around exp(-size/c) admission policies on cache_text frontends as part of T144187 (but none of this ties up doing the same on cache_upload).

Change 387236 merged by Ema:
[operations/debs/varnish4@debian-wmf] Add local patch for transaction_timeout

https://gerrit.wikimedia.org/r/387236

@hoo Wondering if you wrote an incident report, that I can add to with an explanation of ORES's involvement?

No, we never made an incident rep on this one, and I don't think it would be fair at this time to implicate ORES as a cause. We can't really say that ORES was directly involved at all (or any of the other services investigated here). Because the cause was so unknown at the time, we stared at lots of recently-deployed things, and probably uncovered hints at minor issues in various services incidentally, but none of them may have been causative.

All we know for sure is that switching Varnish's default behavior from streaming to store-and-forward of certain applayer responses (which was our normal mode over a year ago) broke things, probably because some services are violating assumptions we hold. Unfortunately proper investigation of this will stall for quite a while on our end, but we'll probably eventually come back with some analysis on that later and push for some fixups in various services so that we can move forward on that path again. The RB timeouts mentioned earlier seem a more-likely candidate for what we'll eventually uncover than ORES at this point.

@BBlack Thanks for the detailed notes! All I was going to add was my understanding of how Ext:ORES has the potential for exacerbating any issues with the API layer, simply by consuming with every new edit.

Does it made problem with high sleep times in pywiki?

@BBlack Thanks for the detailed notes! All I was going to add was my understanding of how Ext:ORES has the potential for exacerbating any issues with the API layer, simply by consuming with every new edit.

The extension has potential for that (cf our unpleasantness from Monday of this week). We need to have a discussion about how the extension can be a little more robust in handling failures at the service level and not causing issues for MW too.

This comment was removed by demon.
greg assigned this task to BBlack.

No, we never made an incident rep on this one, and I don't think it would be fair at this time to implicate ORES as a cause. We can't really say that ORES was directly involved at all (or any of the other services investigated here). Because the cause was so unknown at the time, we stared at lots of recently-deployed things, and probably uncovered hints at minor issues in various services incidentally, but none of them may have been causative.

All we know for sure is that switching Varnish's default behavior from streaming to store-and-forward of certain applayer responses (which was our normal mode over a year ago) broke things, probably because some services are violating assumptions we hold. Unfortunately proper investigation of this will stall for quite a while on our end, but we'll probably eventually come back with some analysis on that later and push for some fixups in various services so that we can move forward on that path again. The RB timeouts mentioned earlier seem a more-likely candidate for what we'll eventually uncover than ORES at this point.

I think this is as good as we're going to get with this one, sadly.